


Falco Feeds extends the power of Falco by giving open source-focused companies access to expert-written rules that are continuously updated as new threats are discovered.

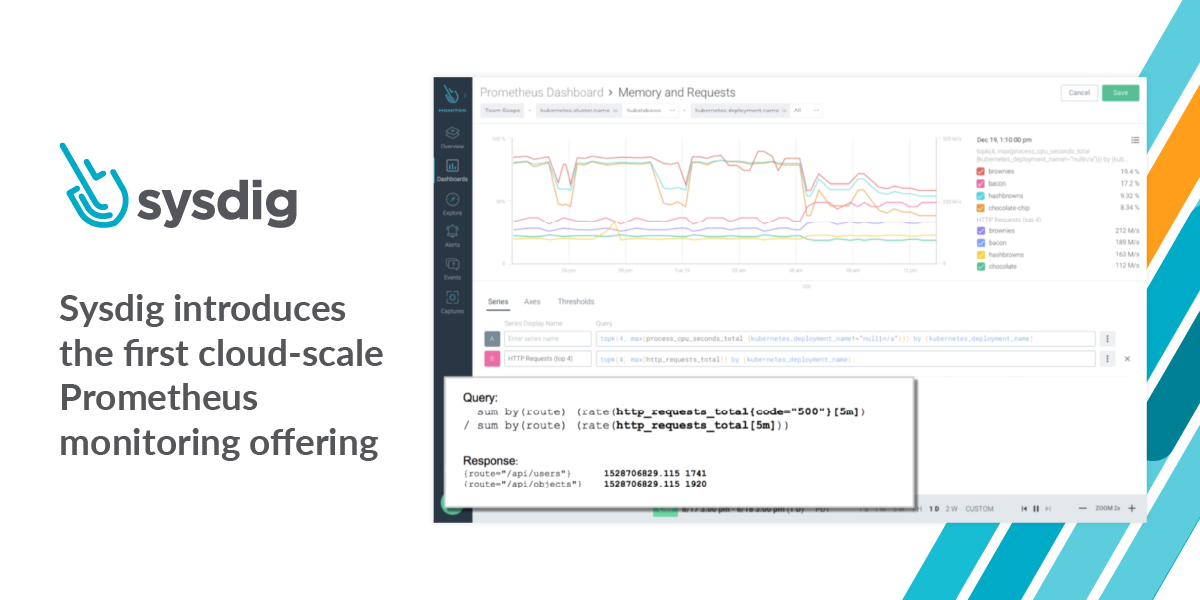
Today, we are excited to announce a huge step forward for Sysdig Monitor. We're introducing the ability for our customers to use Sysdig to scale Prometheus monitoring to millions of metrics with long-term retention. The improvements we are releasing make Sysdig the first cloud-scale monitoring offering to deliver full Prometheus compatibility. This enables end-users to retain their investment in Prometheus monitoring standards while improving scalability, productivity, and troubleshooting capabilities.This release has three main features:
- Full Prometheus compatibility
- Unparalleled scale and retention
- The introduction of PromCat.io
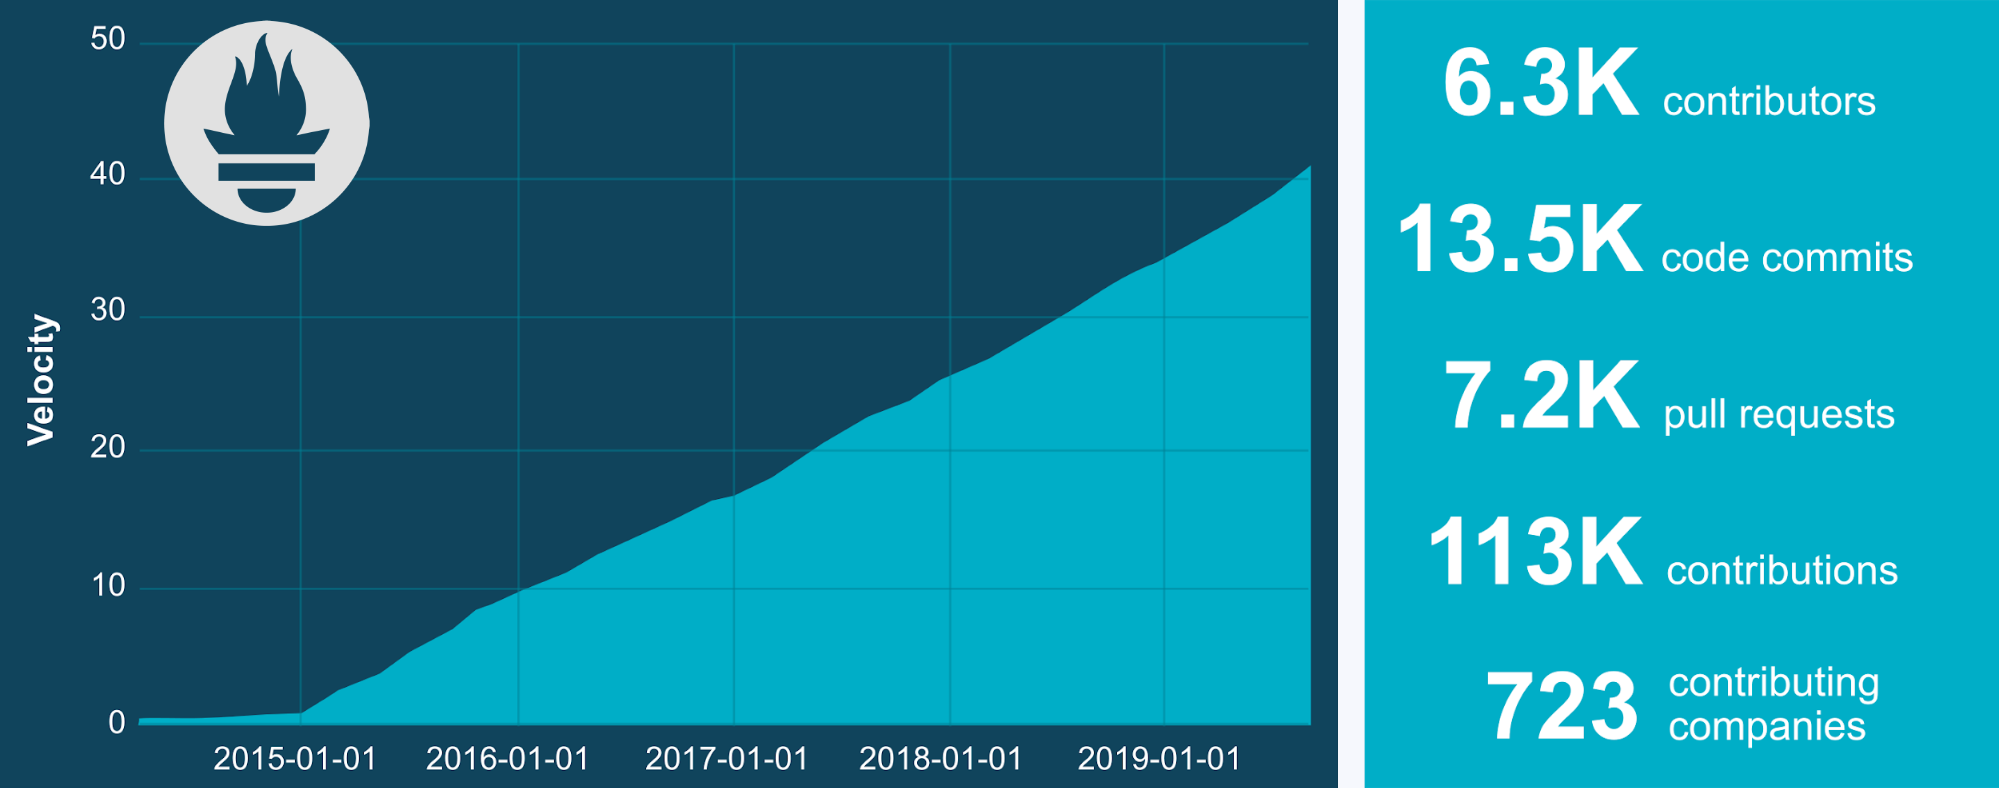
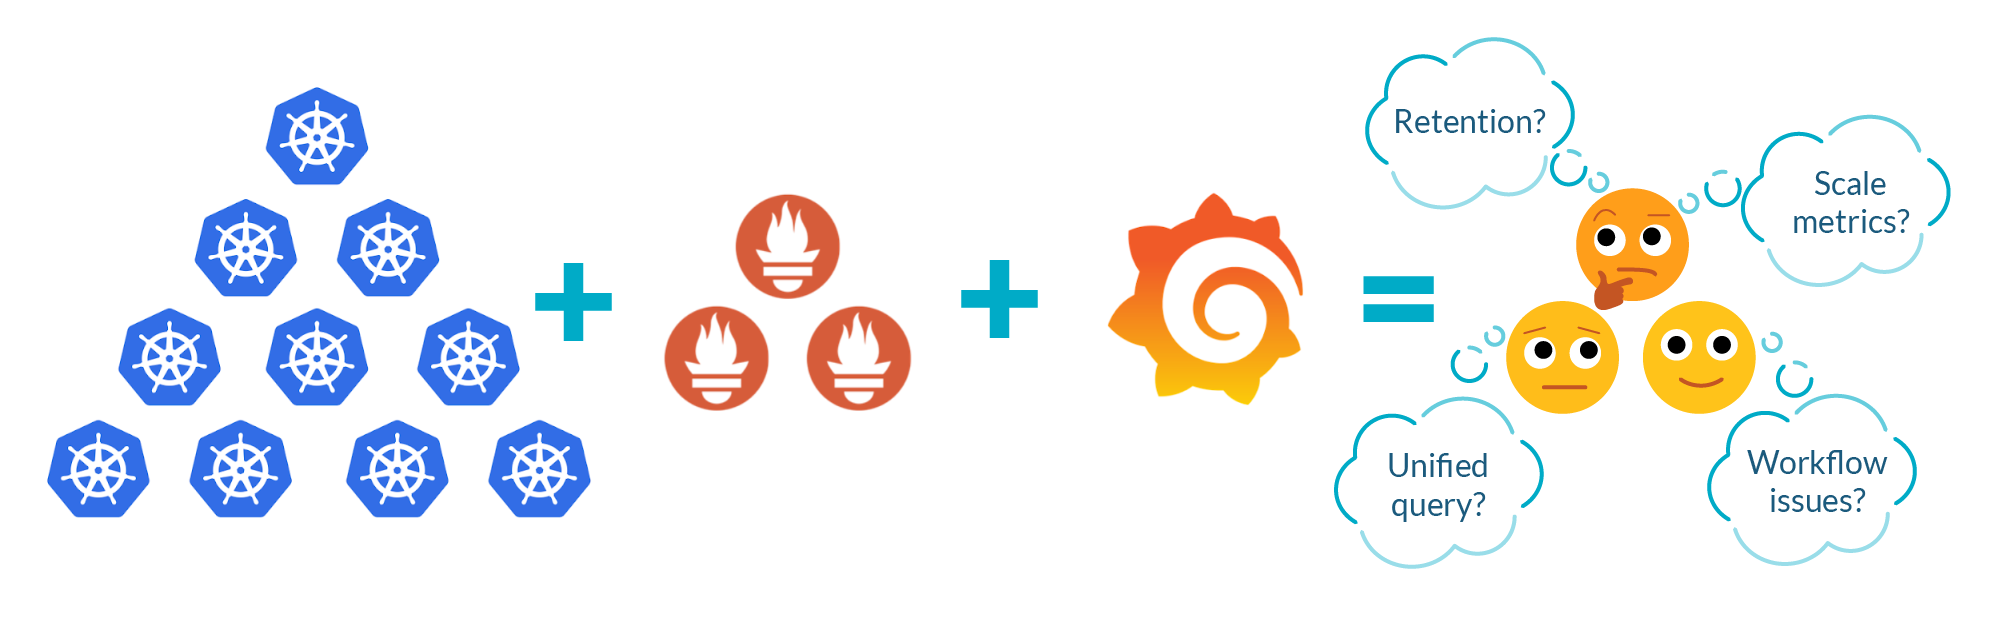
Sysdig announced cloud monitoring at scale with full Prometheus compatibility. Keep the Prometheus metrics standard you love, while improving scalability, productivity, and troubleshooting capabilities. Click to tweet Developers are rapidly adopting Prometheus monitoring to analyze the performance of their infrastructure, applications, and services. With more than 13,500 code commits and 6,300 contributors, Prometheus adoption is accelerating. However, as organizations deploy more and more Prometheus servers, they encounter scaling and workflow issues. Additional requirements — including the need for centralized and scalable metric stores, a unified view across Kubernetes clusters as well as cloud services, and out-of-the-box integrations — are needed in order to reduce risk and maintain application availability. Without a macro view of the environment, it's difficult to anticipate issues with microservices that have cross-platform dependencies.
Organizations are trying to address these scaling issues by building their own federation systems and data stores. Open-source projects like Thanos, Cortex, and M3 are helping, but they're still in the early stages of development and don't offer customer support or troubleshooting capabilities. Companies that require enterprise-grade access controls like RBAC and SSO, among others, have to roll their own support or do without it. In addition, extending Prometheus monitoring to collect metrics from external services can take time and resources. This is due to the myriad of exporters that are available at various levels of quality and documentation. Dedicating development resources to finding and maintaining the right exporters can take those resources away from building the next great application.Sysdig made a bold move and determined that the best approach for us to address these issues was to enhance our backend and Sysdig Monitor to support Prometheus monitoring natively. Instead of a single connector or exporter for Prometheus, we have decided to go "all in" and embrace the way that our customers have chosen to build out cloud-native monitoring. In this way, customers get the best of both worlds by having a Prometheus-compatible platform that offers greater scale, data retention, troubleshooting, correlation, alerts, and enterprise access controls. Oh, and did we mention security? Yeah, Sysdig does that, too.Over the past 12 months, our engineers have been working hard at transforming our platform to offer full Prometheus compatibility. They've been busy building out the necessary scalability to our backend that is required when hooking into Prometheus interfaces. Their hard work has paid off in our announcement today and we're excited to be able to offer the following features:
Full Prometheus compatibility
So what does "full compatibility" mean? In short, it means that if you're familiar with interacting with Prometheus, you won't need to change anything to monitor with Sysdig. We have added support for PromQL, the functional query language used to select and aggregate time series data for Prometheus monitoring. This means that if you're using PromQL in your environment today, you won't need to change anything to query the data in Sysdig. We have built PromQL into our own dashboard interface so you can choose form-based or PromQL entry to build stellar dashboards with just the information you need or use it to configure alerts.
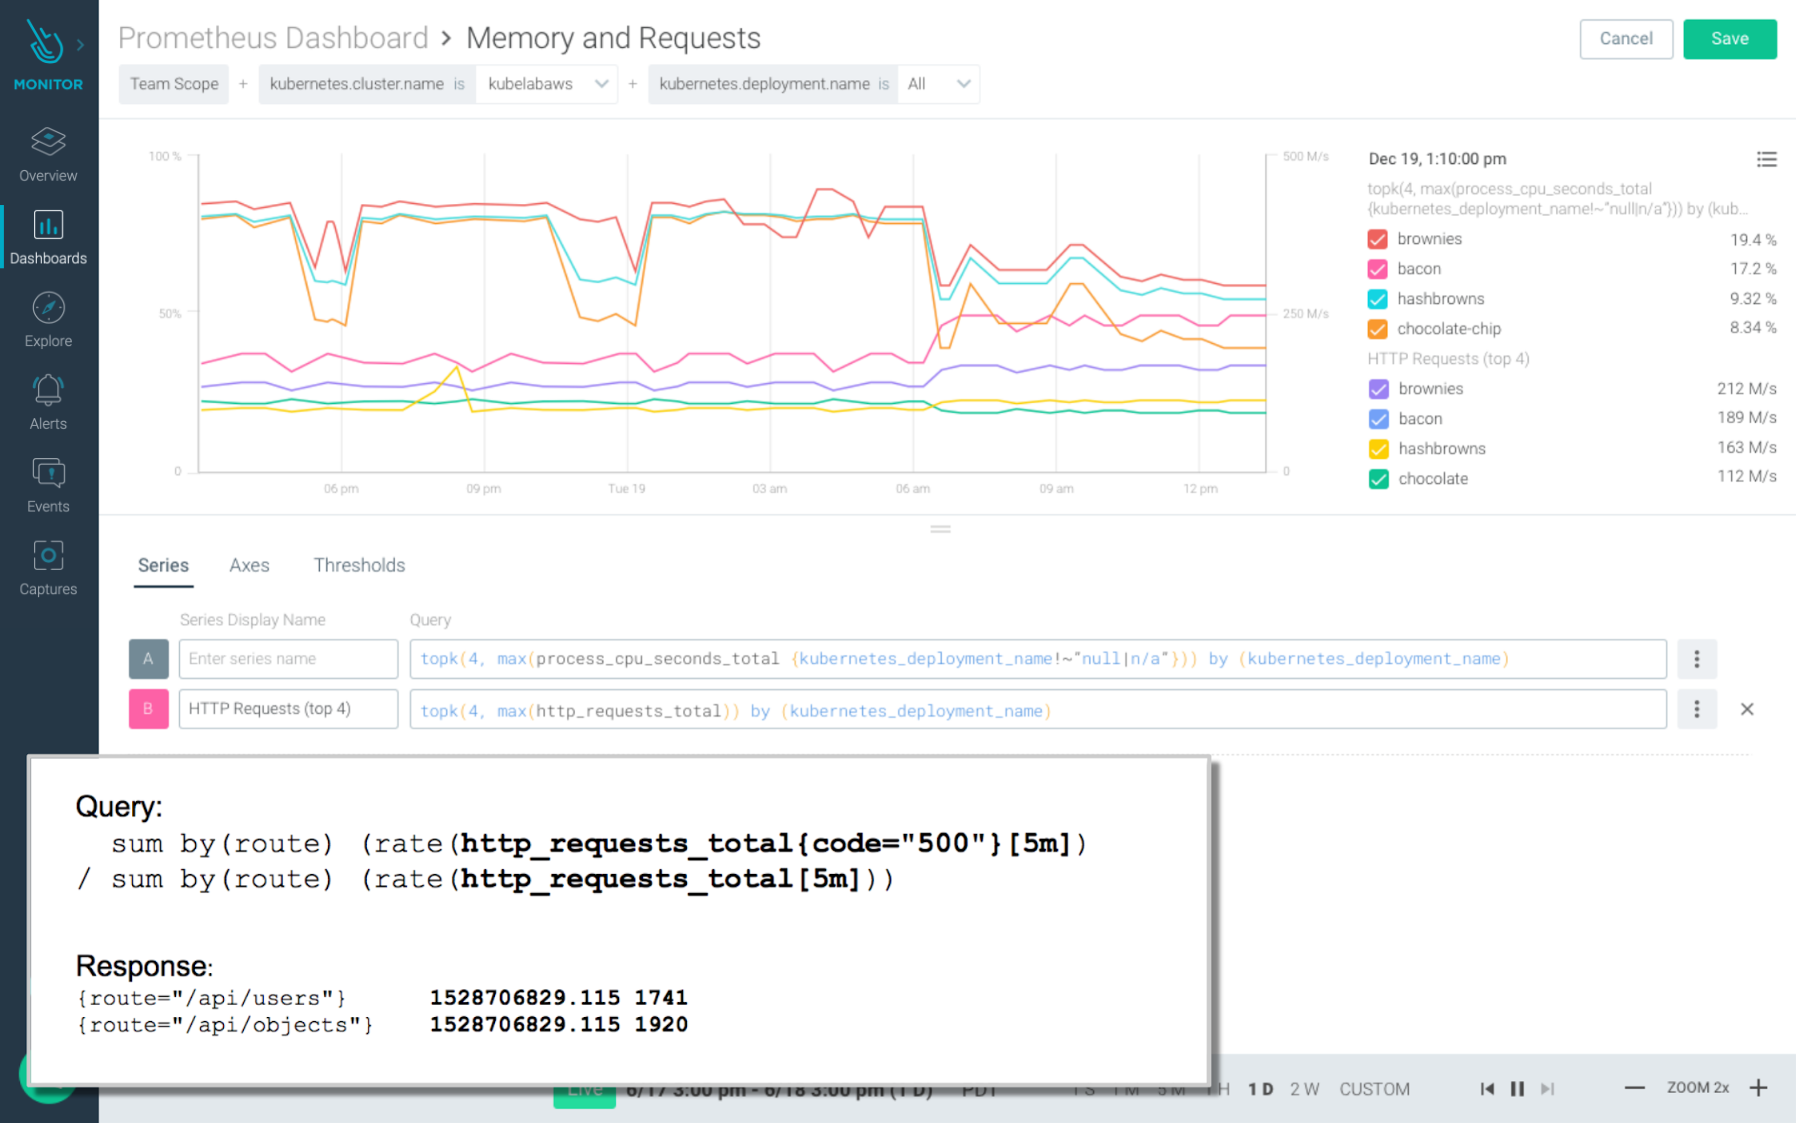
You can also use third-party tools like Grafana to build your own dashboards if you desire. Sysdig is compatible with Prometheus HTTP API to query your monitoring data programmatically using PromQL. From a collection standpoint, we have embedded a lightweight Prometheus server directly into our agent to facilitate metric collection which gets forwarded to our backend. This also supports targets, instances, and jobs with filtering and relabeling using Prometheus syntax. You can also use the hundreds of available Prometheus exporters with Sysdig in the same way that you would use them otherwise (more on this later).
Scale and retention for Prometheus monitoring
Cloud-native environments tend to scale very quickly in both the number of total entities and the frequency of which these entities are recycled, changed or duplicated. We know from our customers that they are looking for a scalable data store with long-term retention for Prometheus monitoring. With this release, organizations will be able to store millions of time series data with ten-second resolution for faster troubleshooting across their entire environment. These metrics will be stored for up to 13 months making them useful for trend analysis down the road.
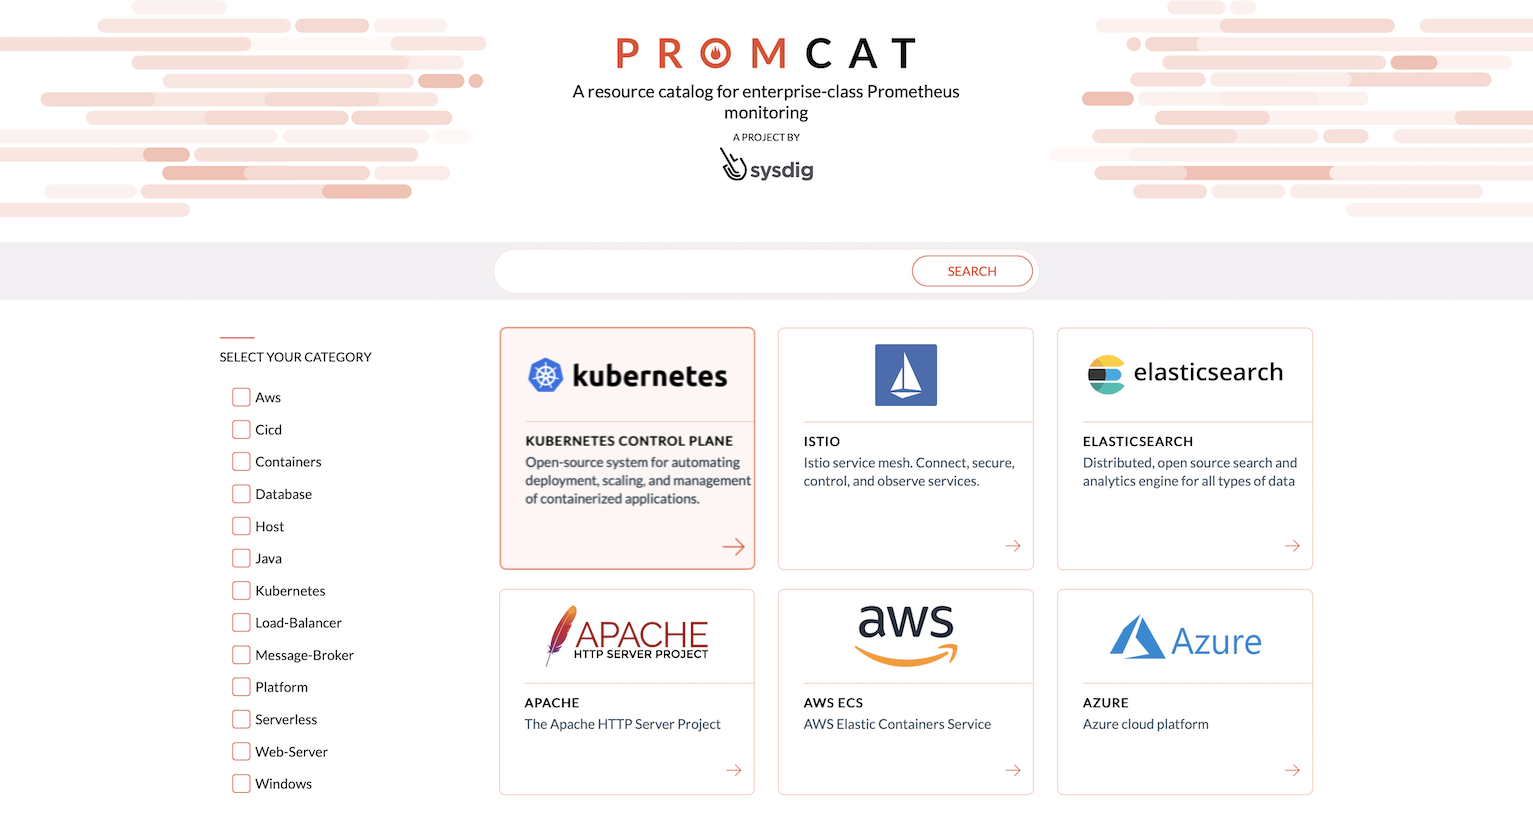
PromCat.io: A Prometheus monitoring resource catalog
The number of exporters available for Prometheus has grown dramatically in recent years. In general, this is a good thing as it allows organizations to pull in metrics and events from the various infrastructure, applications, and services that support their business. However, it can be difficult to know which exporter is the right one to use, not to mention the testing, configuration, and ongoing maintenance of each one. Sysdig is helping address this issue by introducing PromCat.io, a growing, curated catalog of Prometheus monitoring integrations with configuration, documentation and official customer support by Sysdig. You can read more about PromCat.io in the official announcement.
Conclusion
Sysdig is the first cloud-scale monitoring offering that delivers full Prometheus compatibility along with troubleshooting, enterprise access controls, and security. With Sysdig, companies can maintain their investment in Prometheus monitoring without sacrificing scale, visibility, or support. With new cloud services and ever-changing infrastructure, you can expand your monitoring capabilities with curated, supported Prometheus exporters, alerts and dashboards on PromCat.io.These features will be rolling out to customers over the next few months. For a preview of some of the new features, you can watch our Sysdig Monitor overview video. If you are new to Sysdig, start a free trial and experience how easy cloud-native monitoring can be.