Prometheus monitoring that is radically simple and fully compatible with open source.
Why Prometheus Monitoring?
Prometheus is transforming observability for cloud-native applications and services. As an open source project, Prometheus offers a standard way to collect, store, and query metrics across containers, Kubernetes, services, and applications. Because Sysdig Monitor is fully compatible with Prometheus, you can take advantage of enterprise features without sacrificing your investment in the Prometheus ecosystem.
We have built so much around Prometheus, and with Sysdig, we are able to really use those metrics. Sysdig’s support of Prometheus is unique, along with its support for PromQL.”
Prometheus Monitoring Use Cases
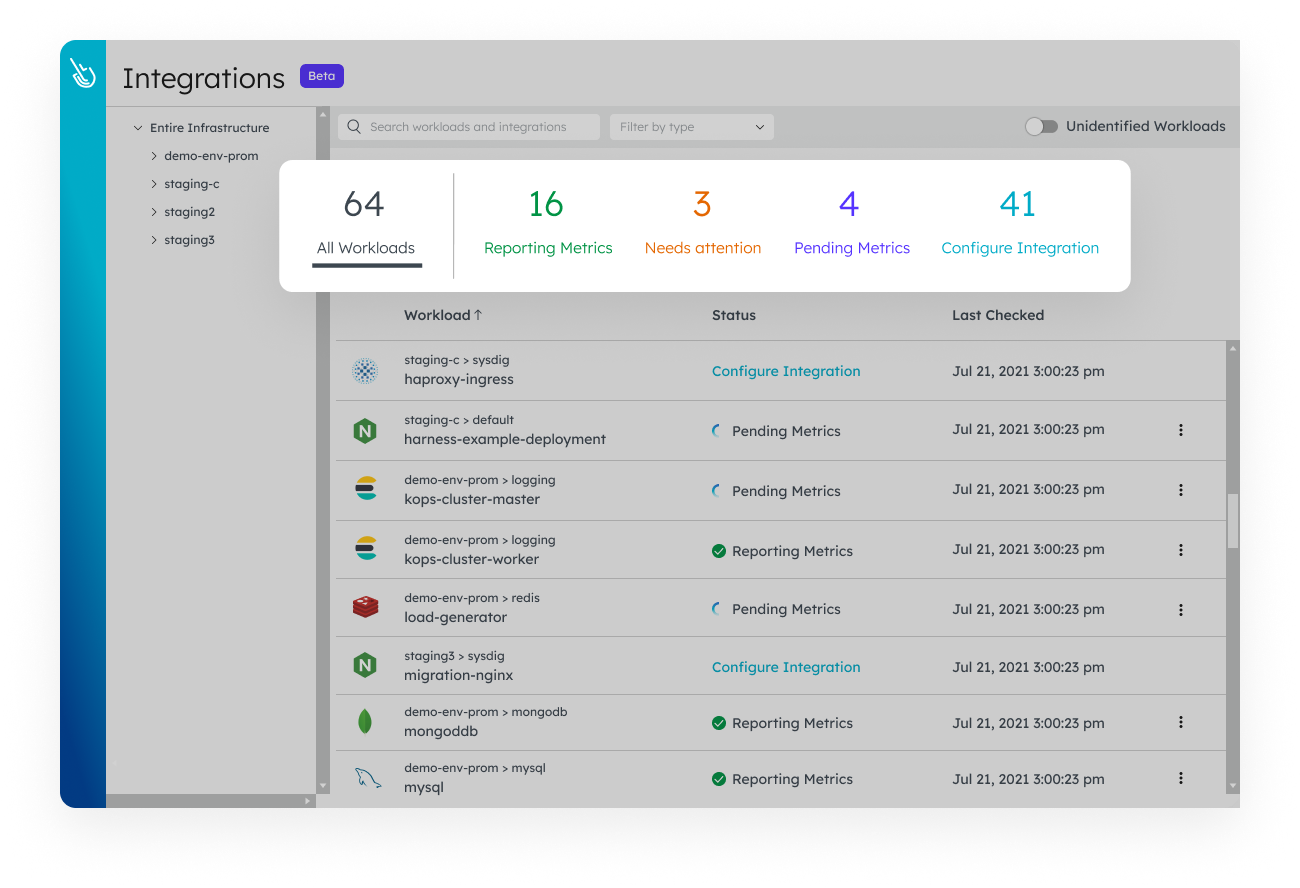
Prometheus Managed Service
A fully managed Prometheus monitoring service with enterprise features, such as automatic service detection and assisted integration deployment.
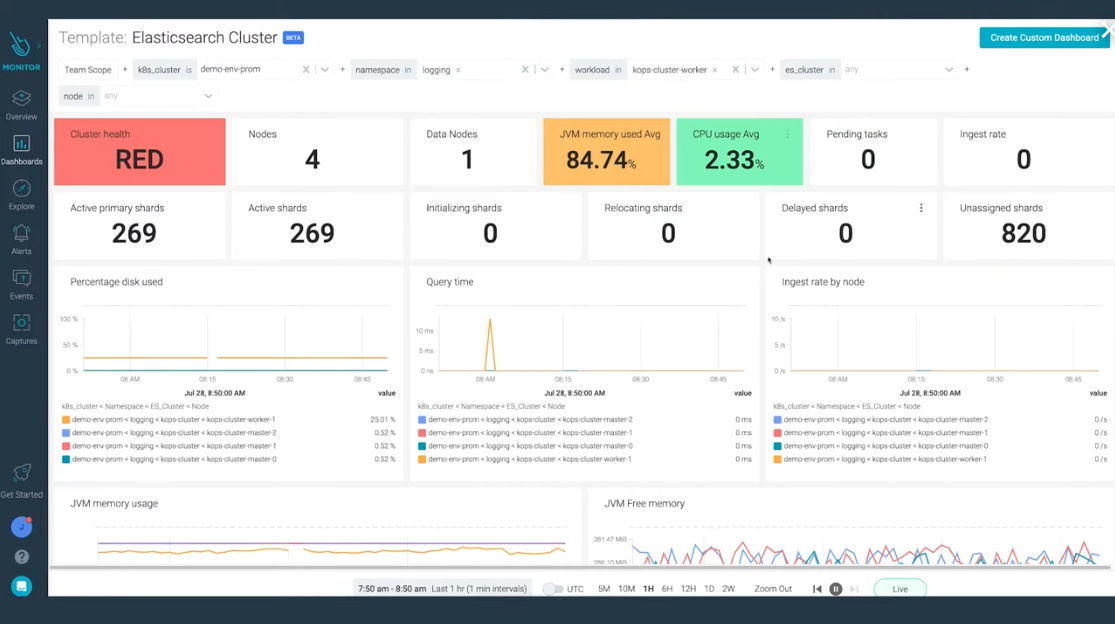
Dashboards and Querying
Use a simple form-based approach to query your Prometheus time series, or use the powerful Prometheus Query Language (PromQL) to build dashboards and alerts.
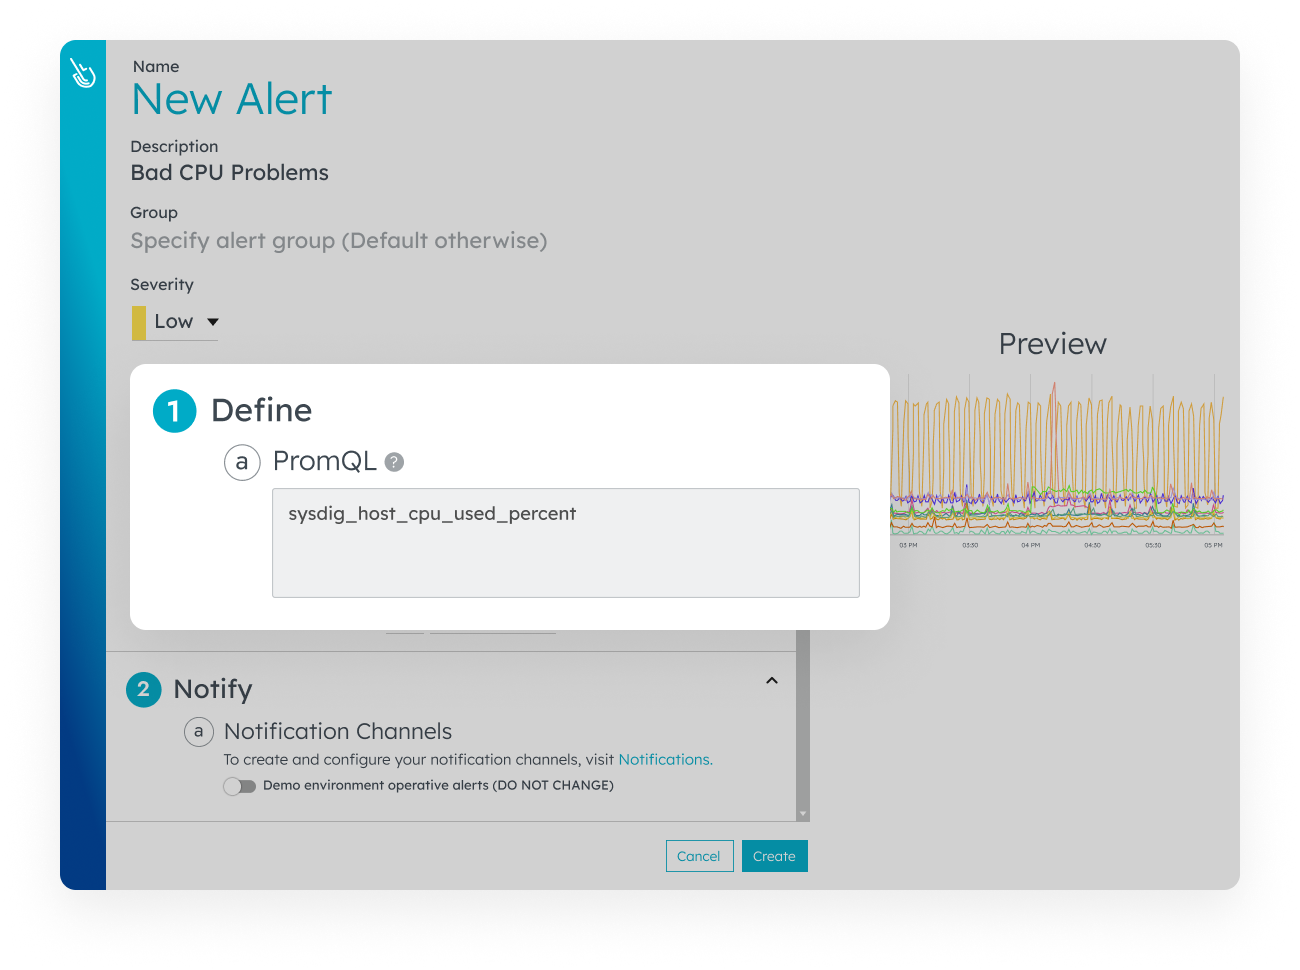
Prometheus Alerting
Set alerts for Prometheus monitoring metrics and get automated notifications of application issues across your entire environment. Import your recording rules for faster configuration.
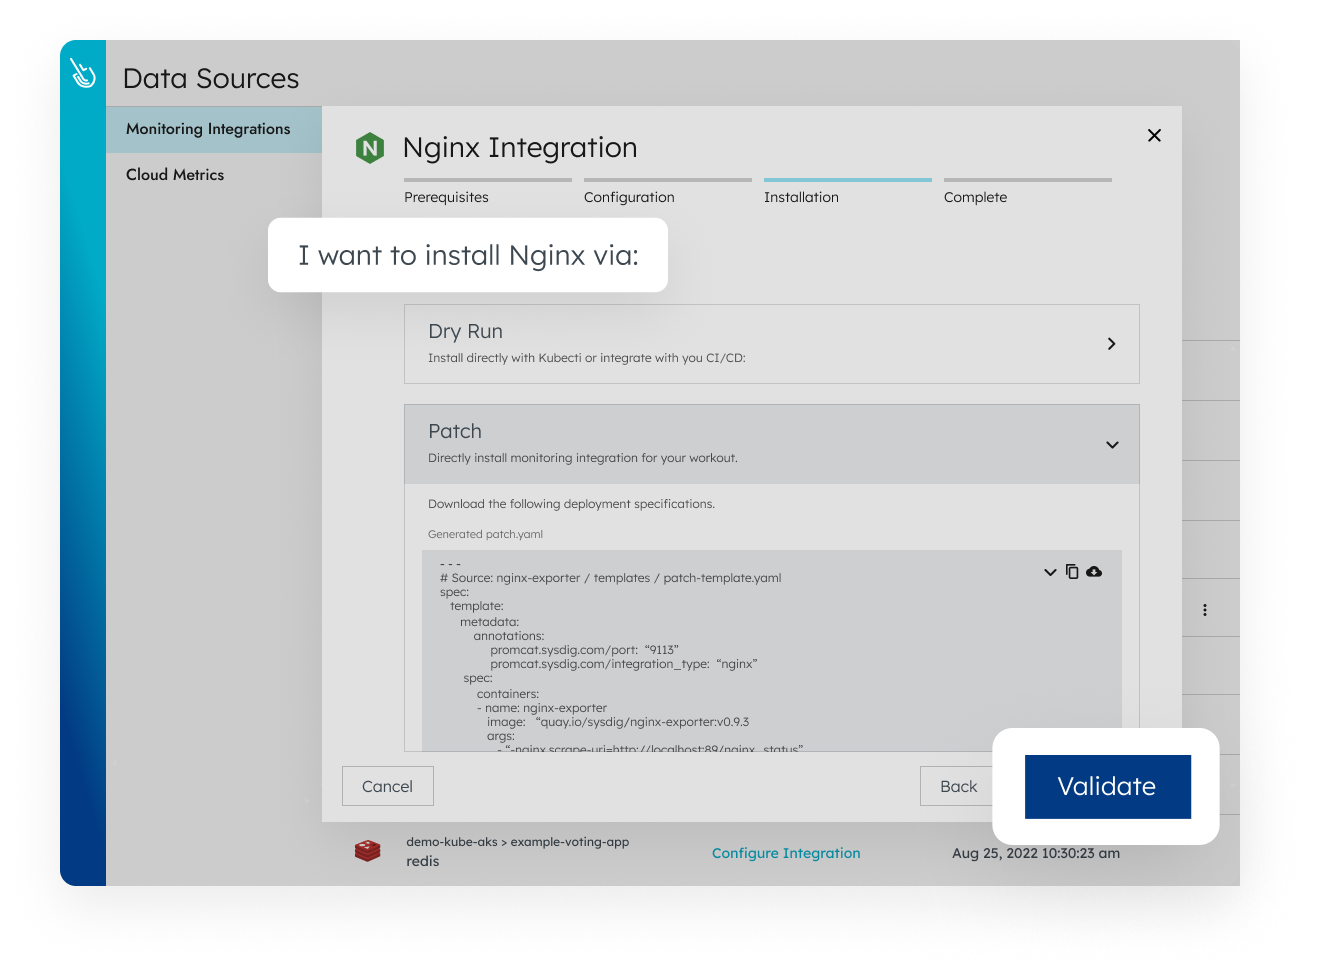
Simplified Configuration and Storage
Our agent can scrape metrics for you, and our back end provides long-term time series retention with a unified view across your whole environment.
How to monitor Openshift with Sysdig Monitor

How to monitor Kubernetes Control Plane with Sysdig