Monitoring Pi-hole: Having your Raspberry Pi, and eating it with Prometheus remote write!


Falco Feeds extends the power of Falco by giving open source-focused companies access to expert-written rules that are continuously updated as new threats are discovered.

Last year we cooked a holiday ham using Sysdig. Honestly, just revisiting that makes me hungry, but it got me thinking. What about dessert?\r
\rToday, I'd like to discuss baking a pie and eating it with Prometheus Remote Write. But not just any pie: a Raspberry Pi. Specifically, I'd like to introduce you to Pi-hole, an open-source project that has become very popular in the community. In this article you'll learn how easy is Monitoring Pi-hole with Prometheus Remote Write.\r
\r\r
What is Pi-hole?
\r
\rPi-hole is an advertisement and internet-tracking blocker for your network. It's designed to run on devices such as the Raspberry Pi, but you can easily install it on almost any Linux system. \r
\r
\rBased on the rules you've defined in the application, Pi-hole intercepts DNS requests that would otherwise go out into the ether, and blocks the potentially dangerous or otherwise ad-laden requests. All devices connected to your network are protected: phones, tablets, computers, and that scary no-name IoT device you just purchased on eBay.\r
\r
\r
\r
\r
\rThat's why some businesses and schools use Pi-hole as a way to prevent employees from navigating to dangerous places and protect children while browsing the web.\r
\r
\rLet's see how you can properly start monitoring Pi-hole with Prometheus Remote Write to assure it's successfully protecting your network.\r
\r\r\r
Monitoring Pi-hole with Prometheus Remote Write
\r
\rHaving a Prometheus server in a Raspberry Pi can be problematic due to Raspis using SD memory cards as storage. Intensive continuous writing can damage the cards and long retention configurations can end the available storage in the SD card. \r
\r
\rThat's why you can configure the local Prometheus to have a short retention time, minimizing the occupation of disk and configuring it to send the data to a Prometheus server hosted on a computer or cloud service. \r
\r
\rMonitoring Pi-hole with Prometheus Remote Write, instead of relying on an agent to pull a few key metrics from your Prometheus Exporter, allows you to configure Prometheus itself to write your favorite metrics to your Prometheus server, completely agentless.\r
\r
\rThis solution also allows you to centralize the data if you have different Pi-Holes for different rooms, LANs, or buildings.\r
\r\r\r
Let's Bake a Pi!
\r
\rIngredients:\r
\r
- \r
- A Raspberry Pi of any flavor, running Raspberry Pi OS Lite with Pi-hole installed. \r
- Docker.\r
- Pi-Hole Prometheus Exporter.\r
- A docker container running Prometheus server.\r \r
\r\r\r
A Delicious Crust to Contain our Pi
\r
\rYou need to get Docker installed in your Raspi since it is going to be used in later steps:\r
\rcurl -sSL https://get.docker.com | sudo sh\r
\r\r\r
Prepare the Filling
\r
\rLet's deploy the Prometheus exporter to get the metrics that the Prometheus server will receive.\r
\r\r\r
So what is a Prometheus Exporter?
\r
\rAn exporter is a "translator" or "adapter" program that fetches data from a non-Prometheus endpoint and then converts it to the Prometheus metrics format, ready to be scraped by a Prometheus server.\r
\r
\rThere are a ton of different Prometheus exporters out there to monitor all kinds of things. You'll need the Pi-hole exporter for this project, a simple exporter written for Pi-Hole and already containerized.\r
\r
\rThe first step is getting credentials that the exporter can use to collect data from Pi-Hole. The easiest way to do this is to use the API key, which can be obtained using the following command:\r
\rawk -F= -v key="WEBPASSWORD" '$1==key {print $2}' /etc/pihole/setupVars.conf\r
\r
\rNext, we need to spin up the exporter as a daemon to run in the background. In this case, we are also exposing the exporter on port 9617, but you can use any free port available:\r
\rsudo docker run \r
-d \r
--network="host" \r
-e 'PIHOLE_HOSTNAME=127.0.0.1' \r
-e "PIHOLE_API_TOKEN=" \r
-e 'INTERVAL=10s' \r
-e 'PORT=9617' \r
-p 9617:9617 \r
ekofr/pihole-exporter:v0.0.11\r
\r
\rOnce the container is running, you can test that metrics are being collected from Pi-Hole and published by the exporter:\r
\rcurl -s http://127.0.0.1:9617/metrics | grep pihole\r
# HELP pihole_ads_blocked_today This represent the number of ads blocked over the current day\r
# TYPE pihole_ads_blocked_today gauge\r
pihole_ads_blocked_today{hostname="127.0.0.1"} 21319\r
# HELP pihole_ads_percentage_today This represent the percentage of ads blocked over the current day\r
# TYPE pihole_ads_percentage_today gauge\r
pihole_ads_percentage_today{hostname="127.0.0.1"} 28.602285\r
…\r
\r
\rYou could also access the /metrics endpoint via a web browser to verify the collected and available metrics.\r
\r\r\r
Baking our Pi!
\r
\rNow that our metrics are available locally, we need a way to ship them to the Prometheus server to start monitoring Pi-hole with Prometheus Remote Write. As discussed earlier, We'll use the Prometheus containerized version to accomplish this. \r
\r
\rFirst, create the prometheus.yml file. There is a basic one already included with the binary you unpacked earlier, so you can use a copy as a template. \r
\r
\rTo get started, there are a few main sections you might want to be aware of:\r
\r
\rThe external_labels section\r
\rIn this section, you can pass through labels on every metric written to the Prometheus destination server. Here, you can place some labels to help you easily identify and scope the metrics later.\r
\r
\rThe scrape_configs section\r
\rHere, you can define jobs to tell Prometheus where to scrape the metrics from. In this case, the only job you need is to connect to the loopback and collect the metrics from the Pi-Hole Exporter on port 9617. \r
\r
\rBy default, Prometheus will scrape from the /metrics path when an alternative is not defined, which is exactly what we need.\r
\r
\rThe remote_write section\r
\rThis is the section you'll use to ship metrics to the Prometheus server. You need to define an url that is the API endpoint for the Prometheus server.\r
\r
\rHere's the resulting prometheus.yml after the aforementioned modifications:\r
\rglobal:\r
scrape_interval: 10s # By default, scrape targets every 15 seconds.\r
evaluation_interval: 10s # By default, scrape targets every 15 seconds.\r
scrape_timeout: 10s # By default, is set to the global default (10s).\r
# Attach these labels to any time series or alerts when communicating with\r
# external systems (federation, remote storage, Alertmanager).\r
external_labels:\r
monitor: 'pihole'\r
origin_prometheus: 'donald-pihole'\r
# A scrape configuration containing exactly one endpoint to scrape:\r
scrape_configs:\r
- job_name: 'pihole'\r
static_configs:\r
- targets: ['127.0.0.1:9617']\r
remote_write:\r
- url: ""\r
tls_config:\r
insecure_skip_verify: true\r
\r
\rTo simplify the Prometheus installation process, we recommend you using the official Prometheus docker images to launch the server in the Raspi. This will start the scraping from your Pi-Hole exporter and remote write the metrics to the Prometheus server!\r
\rdocker run \r
-p 9090:9090 \r
-v /path/to/prometheus.yml:/etc/prometheus/prometheus.yml \r
prom/prometheus\r
\r\r
Let's Eat!
\r
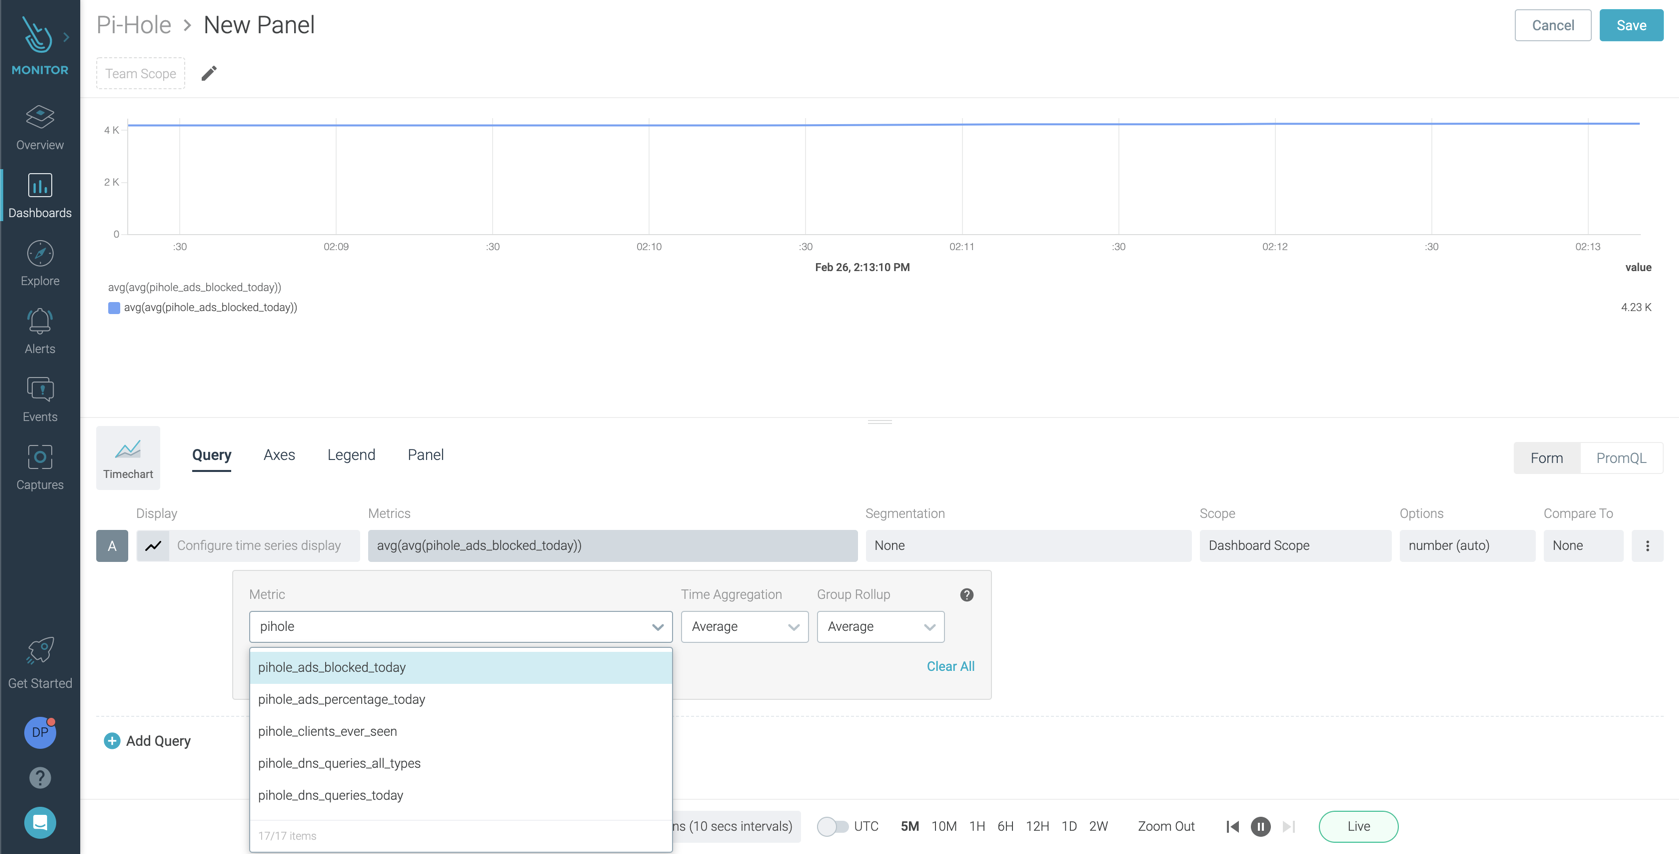
\rWithin a few moments of starting the Prometheus container, you should notice delicious, new pihole_* metrics available within Sysdig Monitor for your enjoyment! You can use Grafana or whatever dashboard tool you like, but I will be using Sysdig Monitor for the sake of convenience.\r
\r
\r
\r
\r
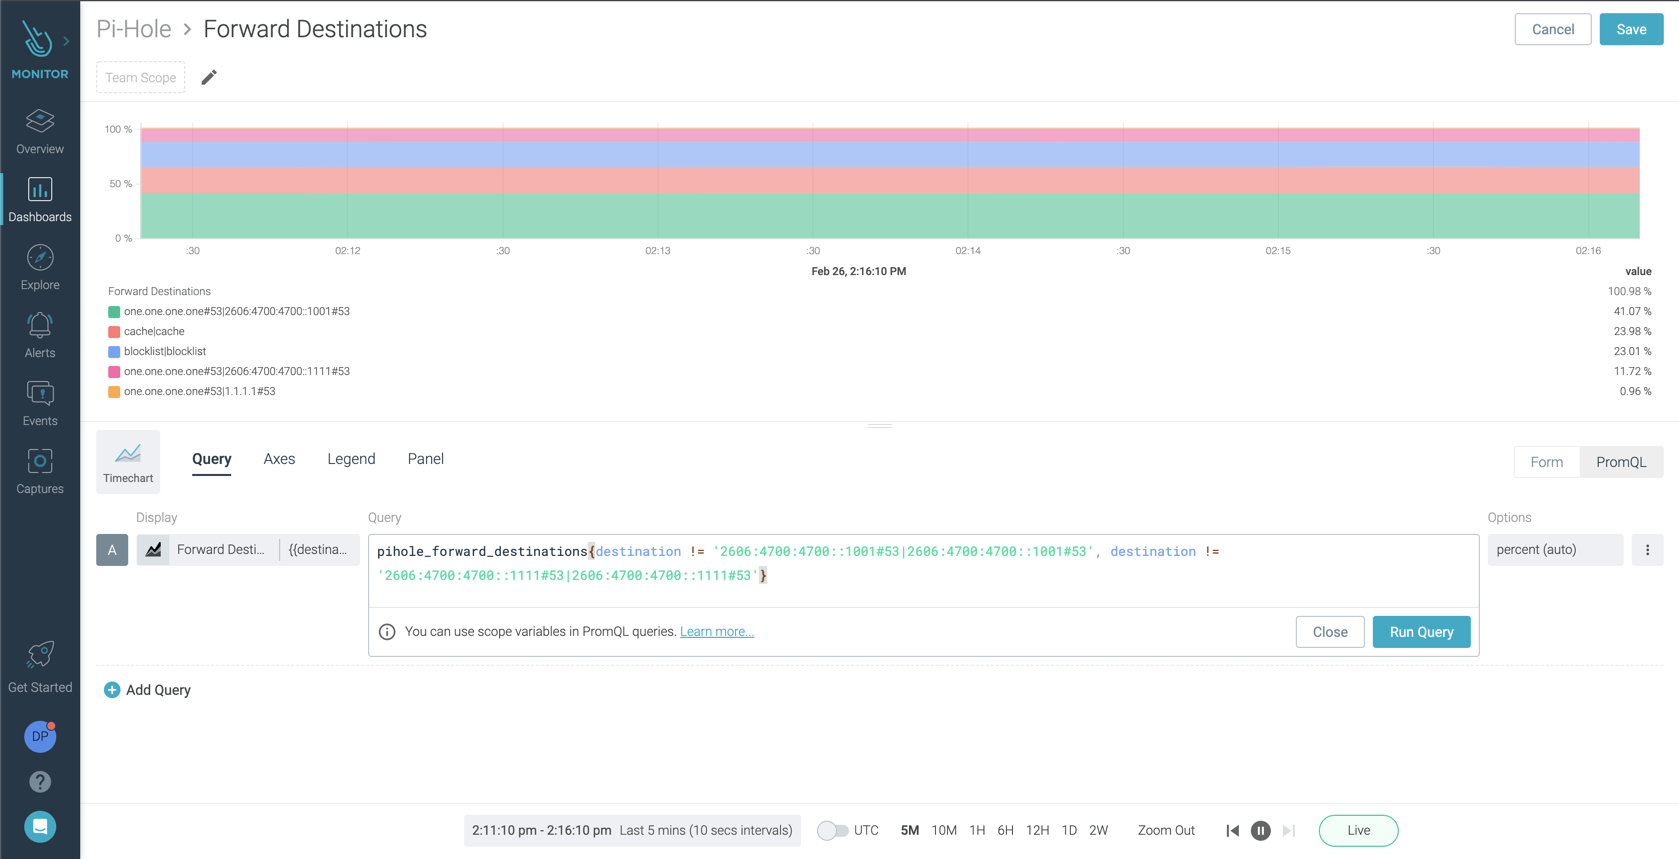
\rWith PromQL, you can make queries ranging from the simple to the complex, and everything in between. This allows you to monitor your new Pi-Hole deployment the way you want.\r
\r
\r
\r
\r
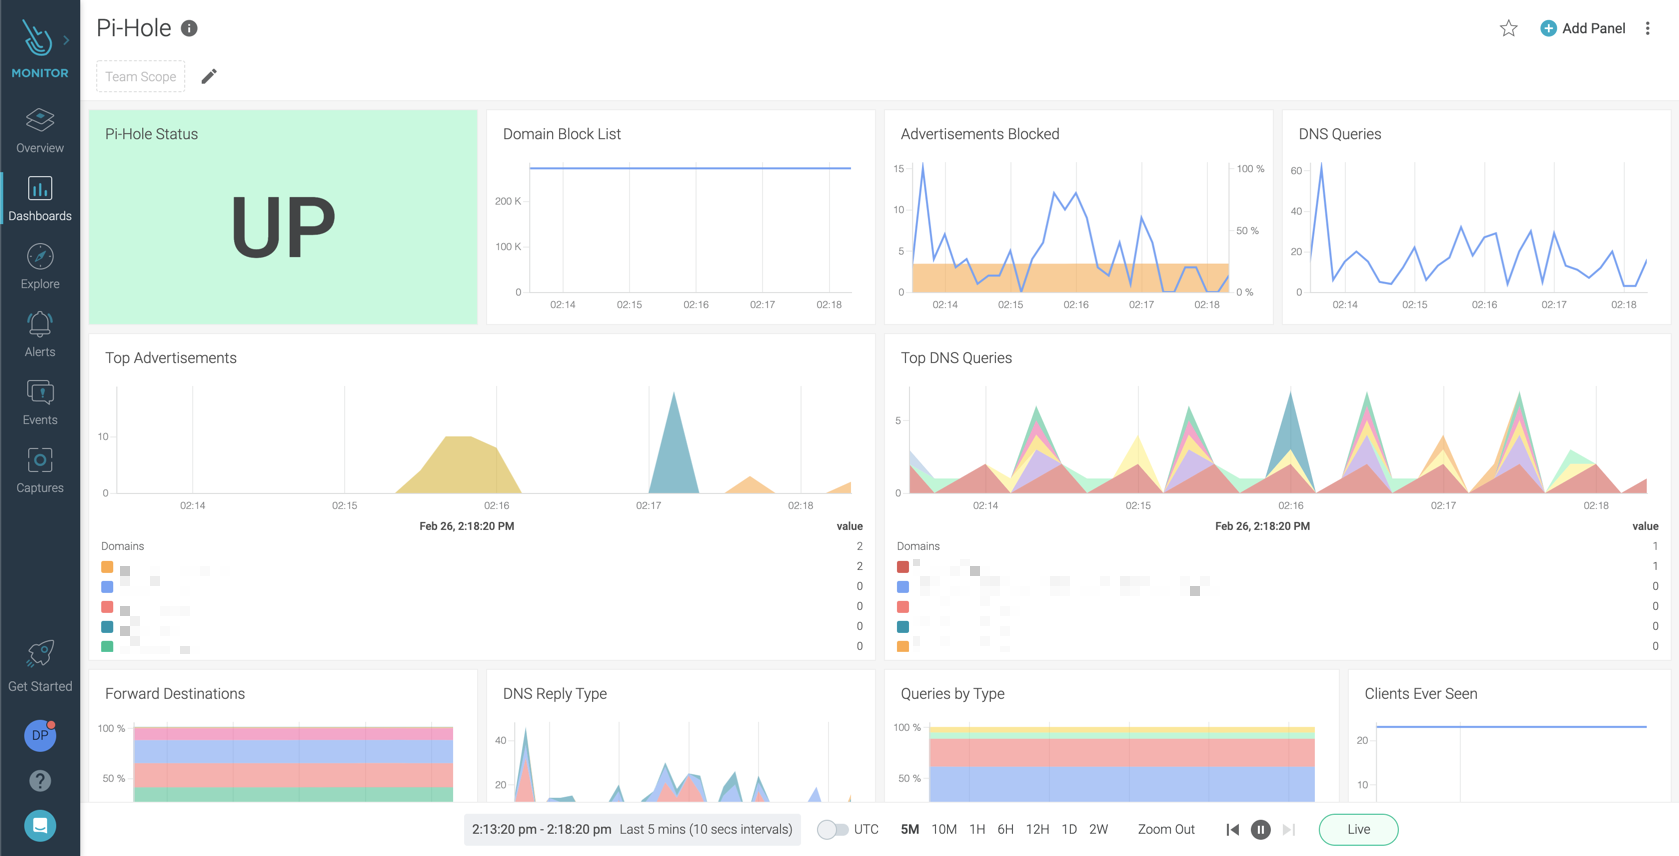
\rIn only a few minutes, I was able to create a dashboard to give me complete visibility into the requests on my network, leaving me feeling more secure and protected:\r
\r
\r
\r
\r\r
\rSysdig's managed Prometheus service supports Prometheus remote write functionality allowing you to easily implement a long-term managed storage solution for your metrics, and monitor the metrics that matter with minimal overhead, and without any impact to your waistline! \r
\r
\r
\r
\rYou can try this in just a few minutes in the Sysdig Monitor free trial, \r
\r