


Falco Feeds extends the power of Falco by giving open source-focused companies access to expert-written rules that are continuously updated as new threats are discovered.

In the following example-driven tutorial we will learn how to use Prometheus metrics / OpenMetrics to instrument your code whether you are using Golang, Java, Python or Javascript. We will cover the different metric types and provide readily executable code snippets.
Prometheus is an open source time series database for monitoring that was originally developed at SoundCloud before being released as an open source project.
Nowadays, Prometheus is a completely community-driven project hosted at the Cloud Native Computing Foundation.
The Prometheus project includes a collection of client libraries which allow metrics to be published so they can then be collected (or "scraped" using Prometheus' terminology) by the metrics server.
"How to instrument your #Golang #Java #Python and #Javascript code using #Prometheus metrics."
Prometheus metrics libraries have become widely adopted, not only by Prometheus users, but by other monitoring systems including InfluxDB, OpenTSDB, Graphite, and Sysdig Monitor. Nowadays, many CNCF projects expose out-of-the-box metrics using the Prometheus metrics format. You'll also find them in core Kubernetes components like the API server, etcd, CoreDNS and more. You can learn more about this in Kubernetes monitoring with Prometheus guide.
The Prometheus metrics format is so widely adopted that it became an independent project: OpenMetrics, striving to make this metric format specification an industry standard. Sysdig Monitor supports this format out of the box, it will dynamically detect and scrape Prometheus metrics for you.
If you're new to custom metrics, you can start from the beginning here: How to instrument code: Custom Metrics vs APM vs OpenTracing to understand why you need custom application metrics, which use cases they cover, and how they compare with other observability options.
Prometheus metrics: dot-metrics vs tagged metrics
Before describing the Prometheus metrics / OpenMetrics format in particular, let's take a broader look at the two main paradigms used to represent a metric: dot notation and multi-dimensional tagged metrics.
Let's start with dot-notated metrics. In essence, everything you need to know about the metric is contained within the name of the metric. For example:
production.server5.pod50.html.request.total
production.server5.pod50.html.request.error
These metrics provide the detail and the hierarchy needed to effectively utilize your metrics. In order to make it fast and easy to use your metrics, this model of metrics exposition suggests that if you'd like a different aggregation, then you should calculate that metric up front and store it using a separate name. So, with our example above, let's suppose we were interested in the "requests" metrics across the entire service. We might rearrange our metrics to look like this:
production.service-nginx.html.request.total
production.service-nginx.html.request.error
You could imagine many more combinations of metrics that you might need.
On the other hand, the Prometheus metric format takes a flat approach to naming metrics. Instead of a hierarchical, dot separated name, you have a name combined with a series of labels or tags:
<metric name>{<label name>=<label value>, ...}A time series with the metric name http_requests_total and the labels service="service", server="pod50″ and env="production" could be written like this:
http_requests_total{service="service", server="pod50", env="production"}Highly dimensional data basically means that you can associate any number of context-specific labels to every metric you submit.
Imagine a typical metric like http_requests_per_second, every one of your web servers is emitting these metrics. You can then bundle the labels (or dimensions):
- Web Server software (Nginx, Apache)
- Environment (production, staging)
- HTTP method (POST, GET)
- Error code (404, 503)
- HTTP response code (number)
- Endpoint (/webapp1, /webapp2)
- Datacenter zone (east, west)
And voila! Now you have N-dimensional data, and can easily derive the following data graphs:
- Total number of requests per web server pod in production
- Number of HTTP errors using the Apache server for webapp2 in staging
- Slowest POST requests segmented by endpoint URL
Prometheus metrics / OpenMetrics format
Prometheus metrics text-based format is line oriented. Lines are separated by a line feed character (n). The last line must end with a line feed character. Empty lines are ignored.
A metric is composed by several fields:
- Metric name
- Any number of labels (can be 0), represented as a key-value array
- Current metric value
- Optional metric timestamp
A Prometheus metric can be as simple as:
http_requests 2Or, including all the mentioned components:
http_requests_total{method="post",code="400"} 3 1395066363000Metric output is typically preceded with # HELP and # TYPE metadata lines.
The HELP string identifies the metric name and a brief description of it. The TYPE string identifies the type of metric. If there's no TYPE before a metric, the metric is set to untyped. Everything else that starts with a # is parsed as a comment.
# HELP metric_name Description of the metric
# TYPE metric_name type
# Comment that's not parsed by prometheus
http_requests_total{method="post",code="400"}  3   1395066363000
Prometheus metrics / OpenMetrics represents multi-dimensional data using labels or tags as we saw in the previous section:
traefik_entrypoint_request_duration_seconds_count{code="404",entrypoint="traefik",method="GET",protocol="http"} 44The key advantage of this notation is that all these dimensional labels can be used by the metric consumer to dynamically perform metric aggregation, scoping and segmentation. Using these labels and metadata to slice and dice your metrics is an absolute requirement when working with Kubernetes and microservices.
Prometheus metrics client libraries
Golang, Java, Scala and Python prometheus client libraries
The Prometheus project maintains 4 official Prometheus metrics libraries written in Go, Java / Scala, Python, and Ruby.
The Prometheus community has created many third-party libraries that you can use to instrument other languages (or just alternative implementations for the same language):
- Bash
- C++
- Common Lisp
- Elixir
- Erlang
- Haskell
- Lua for Nginx
- Lua for Tarantool
- .NET / C#
- Node.js
- Perl
- PHP
- Rust
Full list of code instrumentation libraries here.
Prometheus metrics / OpenMetrics types
Depending on what kind of information you want to collect and expose, you'll have to use a different metric type. Here are your four choices available on the OpenMetrics specification:
Counter
This represents a cumulative metric that only increases over time, like the number of requests to an endpoint.
Note: instead of using Counter to instrument decreasing values, use Gauges.
# HELP go_memstats_alloc_bytes_total Total number of bytes allocated, even if freed.
# TYPE go_memstats_alloc_bytes_total counter
go_memstats_alloc_bytes_total 3.7156890216e+10
Gauge
Gauges are instantaneous measurements of a value. They can be arbitrary values which will be recorded.
Gauges represent a random value that can increase and decrease randomly such as the load of your system.
# HELP go_goroutines Number of goroutines that currently exist.
# TYPE go_goroutines gauge
go_goroutines 73
Histogram
A histogram samples observations (usually things like request durations or response sizes) and counts them in configurable buckets. It also provides a sum of all observed values.
A histogram with a base metric name of exposes multiple time series during a scrape:
# HELP http_request_duration_seconds request duration histogram
# TYPE http_request_duration_seconds histogram
http_request_duration_seconds_bucket{le="0.5"} 0
http_request_duration_seconds_bucket{le="1"} 1
http_request_duration_seconds_bucket{le="2"} 2
http_request_duration_seconds_bucket{le="3"} 3
http_request_duration_seconds_bucket{le="5"} 3
http_request_duration_seconds_bucket{le="+Inf"} 3
http_request_duration_seconds_sum 6
http_request_duration_seconds_count 3
Summary
Similar to a histogram, a summary samples observations (usually things like request durations and response sizes). While it also provides a total count of observations and a sum of all observed values, it calculates configurable quantiles over a sliding time window.
A summary with a base metric name of also exposes multiple time series during a scrape:
# HELP go_gc_duration_seconds A summary of the GC invocation durations.
# TYPE go_gc_duration_seconds summary
go_gc_duration_seconds{quantile="0"} 3.291e-05
go_gc_duration_seconds{quantile="0.25"} 4.3849e-05
go_gc_duration_seconds{quantile="0.5"} 6.2452e-05
go_gc_duration_seconds{quantile="0.75"} 9.8154e-05
go_gc_duration_seconds{quantile="1"} 0.011689149
go_gc_duration_seconds_sum 3.451780079
go_gc_duration_seconds_count 13118
Prometheus metrics code examples
Golang code instrumentation with Prometheus metrics / OpenMetrics
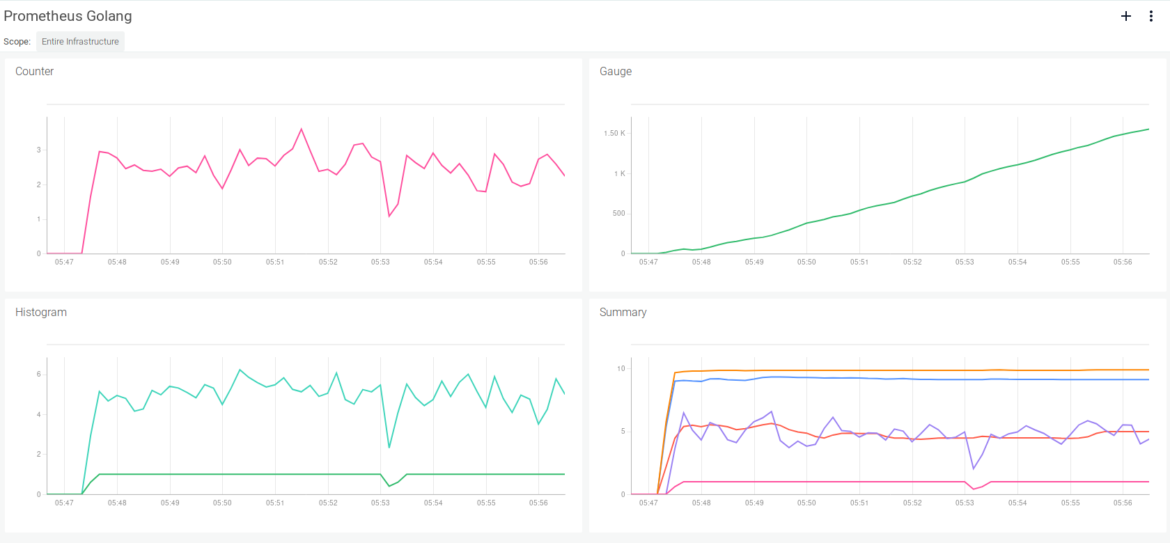
To demonstrate Prometheus metrics code instrumentation in Golang, we're going to use the official Prometheus library to instrument a simple application.
You just need to create and register your metrics and update their values. Prometheus will handle the math behind the summaries and expose the metrics to your HTTP endpoint.
This is how these Golang Prometheus metrics look using a Sysdig Monitor dashboard when scraped over a few minutes:
Try it in Docker
To make things easier and because we just love containers, you can directly run this example using Docker:
$ git clone https://github.com/sysdiglabs/custom-metrics-examples
$ docker build custom-metrics-examples/prometheus/golang -t prometheus-golang
$ docker run -d --rm --name prometheus-golang -p 8080:8080 prometheus-golang
Check your metrics live:
$ curl localhost:8080/metricsJava code instrumentation with Prometheus metrics / OpenMetrics
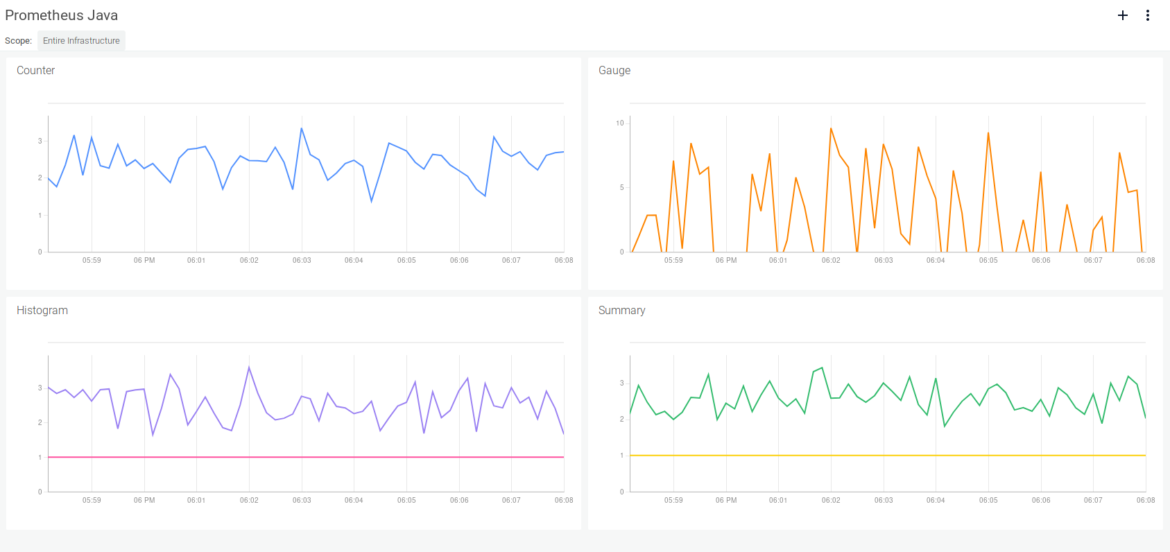
Using the official Java client library, we created this small example of Java code instrumentation with Prometheus metrics:
This is how the Java Prometheus metrics look using a Sysdig Monitor dashboard:
Try it in Docker
Download, build and run (make sure you have ports 8080 and 80 free in your host or change the redirected port):
$ git clone https://github.com/sysdiglabs/custom-metrics-examples
$ docker build custom-metrics-examples/prometheus/java -t prometheus-java
$ docker run -d --rm --name prometheus-java -p 8080:8080 -p 80:80 prometheus-java
Check that the endpoint is working:
$ curl -v localhost
* Rebuilt URL to: localhost/
*   Trying 127.0.0.1...
* TCP_NODELAY set
* Connected to localhost (127.0.0.1) port 80 (#0)
> GET / HTTP/1.1
> Host: localhost
> User-Agent: curl/7.61.1
> Accept: */*
>
< HTTP/1.1 200 OK
< Date: Mon, 08 Oct 2018 13:17:07 GMT
< Transfer-encoding: chunked
<
* Connection #0 to host localhost left intact
Check the local metrics endpoint:
$ curl localhost:8080Python code instrumentation with Prometheus metrics / OpenMetrics
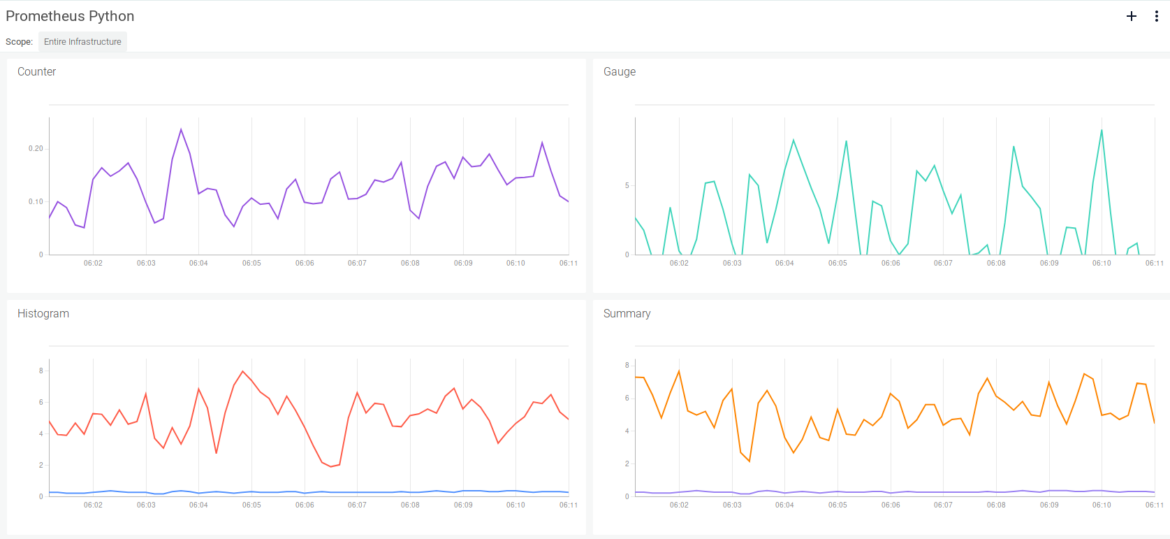
This example uses the same application as the previous example, but this time written in Python using the official Python client library:
This is how Python Prometheus metrics look in the Sysdig Monitor dashboard:
Try it in Docker
Download, build and run (make sure you have ports 8080 and 80 free in your host or change the redirected port):
$ git clone https://github.com/sysdiglabs/custom-metrics-examples
$ docker build custom-metrics-examples/prometheus/python -t prometheus-python
$ docker run -d --rm --name prometheus-python -p 8080:8080 -p 80:80 prometheus-python
Check the local metrics endpoint:
$ curl -v localhost
* Rebuilt URL to: localhost/
*   Trying 127.0.0.1...
* TCP_NODELAY set
* Connected to localhost (127.0.0.1) port 80 (#0)
> GET / HTTP/1.1
> Host: localhost
> User-Agent: curl/7.61.1
> Accept: */*
>
* HTTP 1.0, assume close after body
< HTTP/1.0 200 OK
< Content-Type: text/html; charset=utf-8
< Content-Length: 2
< Server: Werkzeug/0.14.1 Python/3.7.0
< Date: Mon, 08 Oct 2018 13:21:54 GMT
<
* Closing connection 0
Check the local metrics endpoint:
$ curl localhost:8080NodeJS / Javascript code instrumentation with Prometheus OpenMetrics
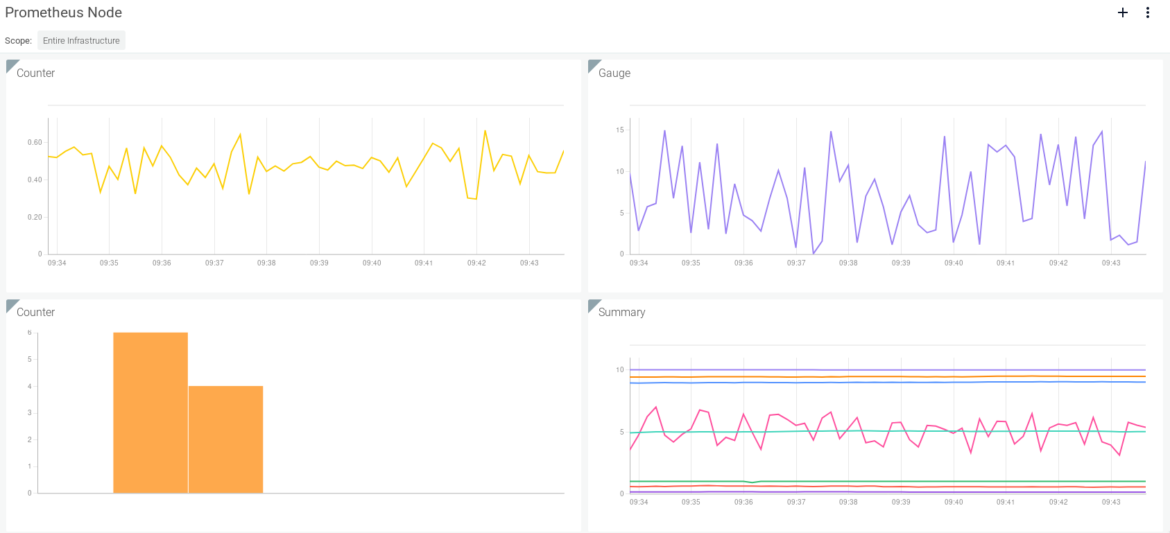
This last example uses the same app again written in Javascript and running in Node.js. We're using an unofficial client library that can be installed via npm: npm i prom-client:
This is how Node.js/Javascript Prometheus metrics will look using a Sysdig Monitor dashboard:
Try it in Docker
Download, build and run (make sure you have port 8080 free in your host or change the redirected port):
$ git clone https://github.com/sysdiglabs/custom-metrics-examples
$ docker build custom-metrics-examples/prometheus/javascript -t prometheus-node
$ docker run -d --rm --name prometheus-node -p 8080:8080 prometheus-node
Check the metrics endpoint:
$ curl localhost:8080/metricsPrometheus metrics and Sysdig Monitor
Using Sysdig Monitor, you automatically can scrape any of the Prometheus metrics exposed by your containers or pods.
Following the Prometheus autodiscovery labeling protocol, the Sysdig agent will look for the following annotations:
prometheus.io/scrape: "true"(adds this container to the list of entities to scrape)prometheus.io/port: "endpoint-TCP-port"(defaults to 8080)prometheus.io/path: "/endpoint-url"(defaults to /metrics)
Using the standard Prometheus notation has the advantage of having to annotate your containers or pods only once, whether you want to use a Prometheus server, a Sysdig Monitor agent or both.
To dig deeper into the details about our customizable configurations, visit our Sysdig agent configuration for Prometheus metrics support page.
Monitoring Prometheus metrics with Sysdig Monitor
Another immediate advantage of using the Sysdig agent to collect Prometheus metrics is that the resulting metrics will include not only the labels added in the Prometheus metrics, but also the full Docker container and Kubernetes metadata. Developers won't need to add those labels manually. For example:
- Host, process, container runtime labels like
proc.name="nginx" - Kubernetes metadata (namespace, deployment, pod, etc) like
kubernetes.namespace.name="frontend" - Cloud provider metadata (region, AZ, securityGroups, etc) like
cloudProvider.region="us-east-1"
These extra dimensions are extremely valuable when monitoring microservices / container oriented environments. Even more if you are using an orchestrator like Kubernetes or OpenShift.
Out of the box and without any further labelling effort from your developers, you can do things like:
- Measure the overall performance of a service for your entire infrastructure, regardless of the physical hosts or pods, just aggregating the metrics by service label.
- Comparing the number of errors of every deployment in your Kubernetes cluster using a single graph separated in different lines (segmented by deployment label).
- Create a multi-dimensional table with the different HTTP response codes and their frequency (columns), by service (rows).
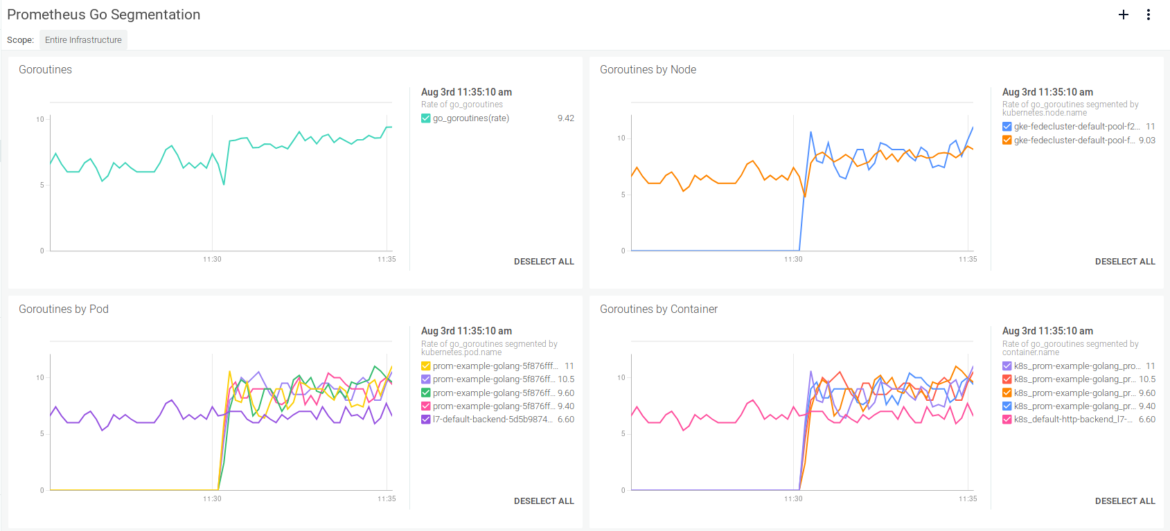
Here's what Prometheus metrics exported by the Go app and segmented by Kubernetes pod look like with Sysdig:
Alerting on Prometheus metrics with Sysdig Monitor
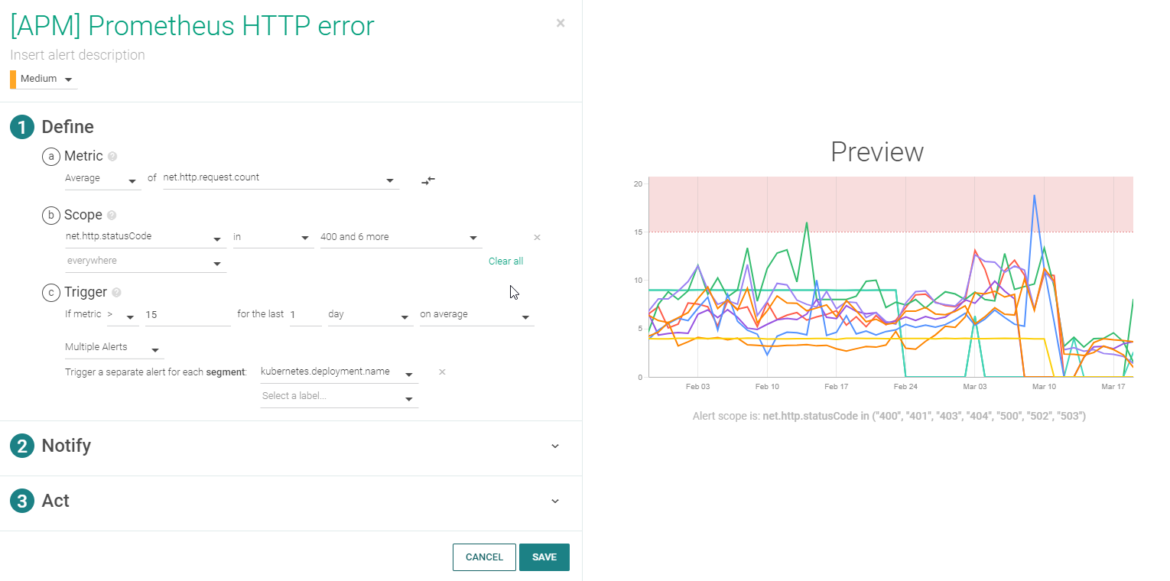
On top of that, you can also use Prometheus metrics with Sysdig Monitor to configure alerts and notifications. For example using the metric net.http.request.count(base metric), setting the scope using the label net.http.statusCode(Aggregate only for error values like 4xx or 5xx) and segmenting by the kubernetes.deployment.name label (that's why you can see a different line per deployment):
Prometheus metrics for Golden Signals monitoring
Golden Signals monitoring is a microservices / distributed systems monitoring strategy introduced by Google. At a glance, these are the four most important metrics to monitor any microservices application:
- Latency or response time
- Traffic or connections
- Errors
- Saturation
When you instrument your code using Prometheus metrics, one of the first things you'll want to do is to expose these metrics from your app. Prometheus libraries empower you to easily expose the first three: latency or response time, traffic or connections, and errors.
Exposing HTTP metrics can be as easy as importing the instrumenting library, like promhttp in our previous Golang example:
import (
...
  "github.com/prometheus/client_golang/prometheus/promhttp"
...
)
...
  http.Handle("/metrics", promhttp.Handler())
...
Sysdig Monitor makes this process even easier, by automatically discovering and collecting these application performance metrics without any instrumentation required, Prometheus or otherwise.
The Sysdig agent decodes any known protocol directly from the kernel system calls and translates this huge amount of low level information into high-level metrics, which gives you a degree of visibility that's typically only found on APMs. Although Prometheus instrumentation can provide more accurate metrics, this is great when you don't have the possibility of instrumenting code, like in legacy apps or when the issues to troubleshoot are already happening.
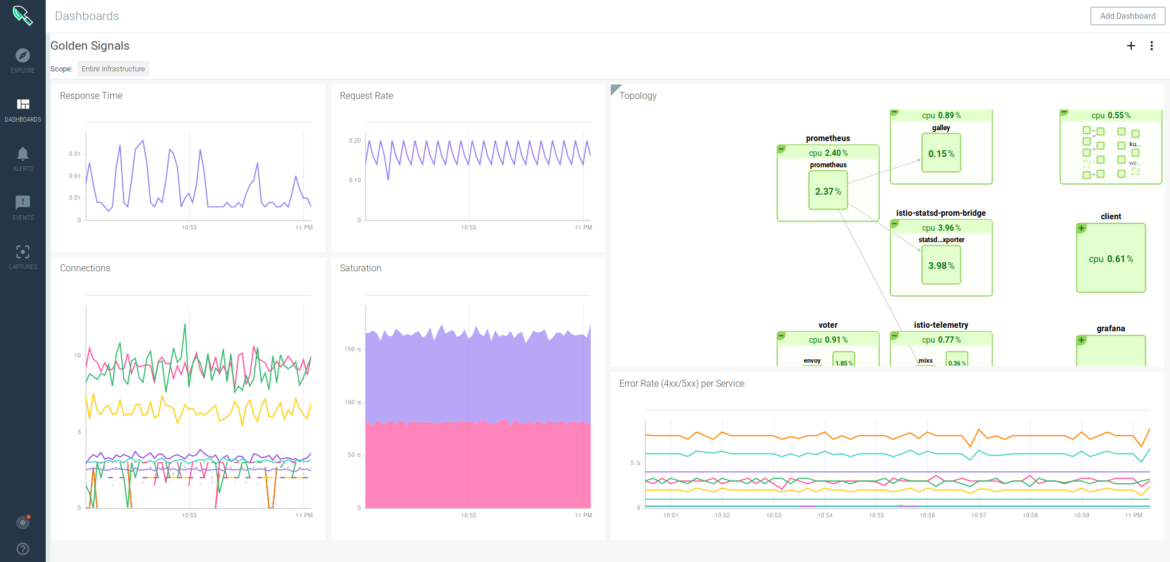
Here is what your Golden Signals monitoring may look like with Sysdig Monitor—including a topology map of your microservices application:
Prometheus exporters
Many popular server applications like Nginx or PostgreSQL are much older than the Prometheus metrics / OpenMetrics popularization. They usually have their own metrics formats and exposition methods. If you are trying to unify your metric pipeline across many microservices and hosts using Prometheus metrics, this may be a problem.
To work around this hurdle, the Prometheus community is creating and maintaining a vast collection of Prometheus exporters. An exporter is a "translator" or "adapter" program able to collect the server native metrics (or generate its own data observing the server behaviour) and re-publishing these metrics using the Prometheus metrics format and HTTP protocol transports.
These small binaries can be co-located in the same container or pod executing the main server that is being monitored, or isolated in their own sidecar container and then you can collect the service metrics scraping the exporter that exposes and transforms them into Prometheus metrics.
Check the up-to-date list of available Prometheus exporters and integrations here.
Conclusion
Prometheus metrics / OpenMetrics facilitate a clean and mostly frictionless interface between developers and operators, making code instrumentation easy and standardized. Libraries already exist for the most popular languages and more are being developed by the community. In addition, the labeling feature makes it a great choice for instrumenting custom metrics if you plan to use containers and microservices.
Using Sysdig Monitor on top of application instrumented with Prometheus, you will go one step further, automatically enhancing all the collected metrics with container, orchestrator and cloud provider metadata and enabling golden signal metrics and dashboards without additional instrumentation.