


Falco Feeds extends the power of Falco by giving open source-focused companies access to expert-written rules that are continuously updated as new threats are discovered.

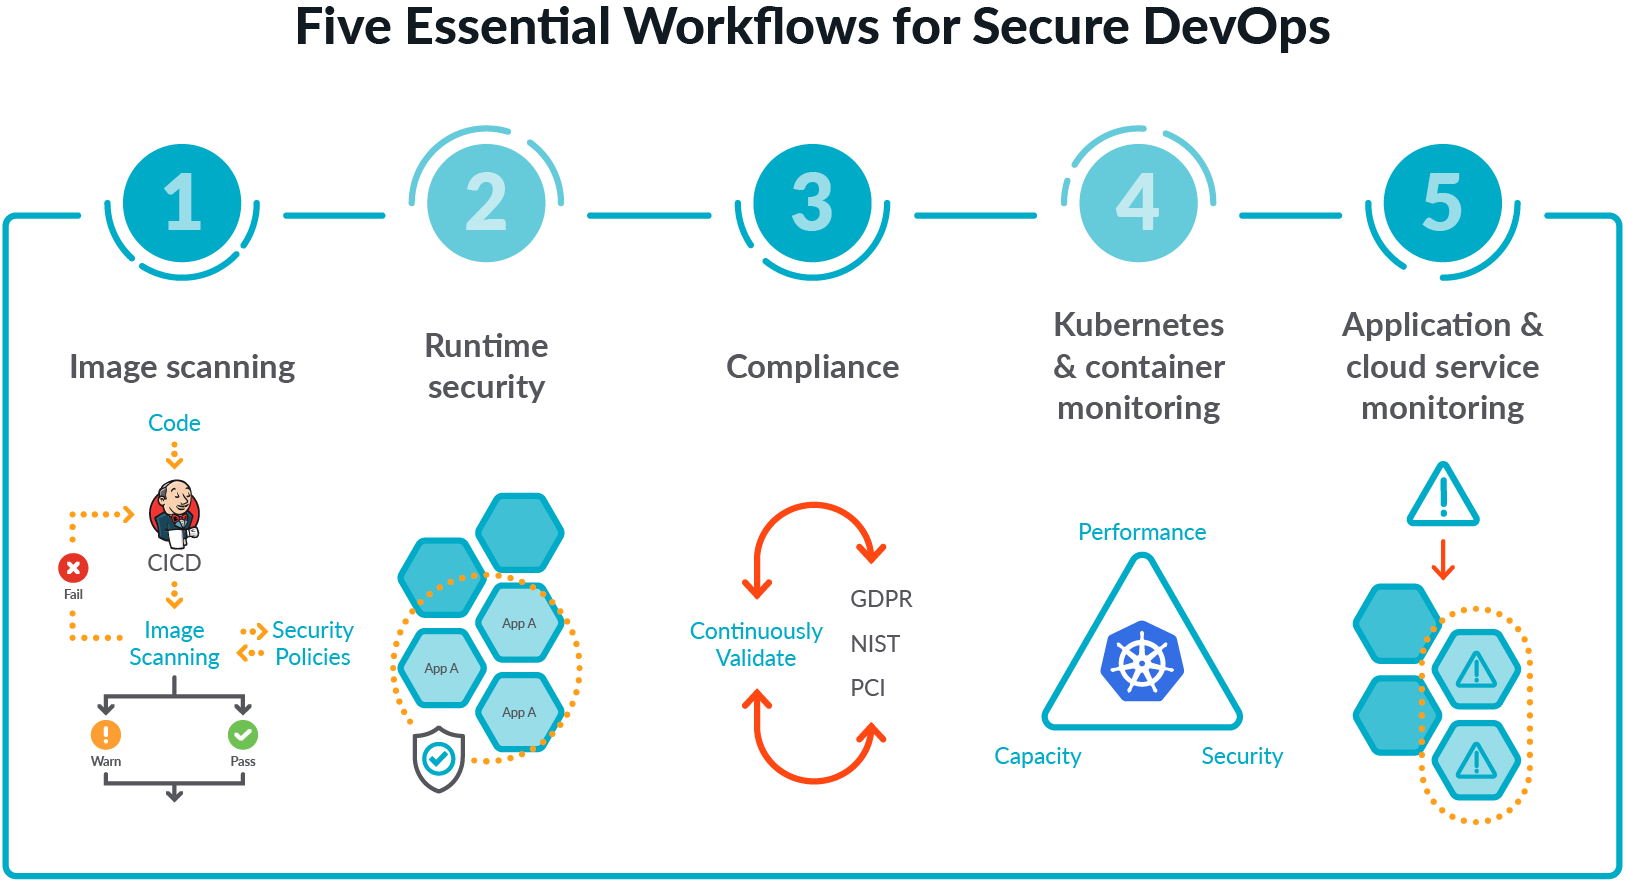
The following Prometheus exporters best practices will help you implement a monitoring solution based on Prometheus, and will also increase your productivity.Prometheus is one of the foundations of the cloud-native environment. It has become the de-facto standard for visibility in Kubernetes environments, creating a new category called Prometheus monitoring. However, many applications in the systems you're in charge of may be third-party applications and cloud services, which do not natively expose Prometheus-formatted metrics. For example, Linux does not expose Prometheus-formatted metrics. That's why Prometheus exporters, like the node exporter, exist. You can download and run it to expose hundreds of machine-level metrics.Secure DevOps, also known as DevSecOps, brings security and monitoring throughout the application lifecycle, from development through production. This sets you up to deliver applications that are secure, stable, and high performance. This workflow plugs into your existing toolchain and provides a single source of truth across DevOps, developer, and security teams to maximize efficiency and provide visibility for troubleshooting and optimization.
In this article, we will take a look at some best practices when monitoring applications and cloud services using Prometheus exporters.Recently, a customer told us…"I spend one developer week per integration trying to figure out which version of Prometheus exporters, dashboards and alerts we should use, how to configure them, and how to keep up with open source changes."The maintenance burden created when running many Prometheus exporters is often worse than you might think. With so many exporters and configurations to consider, it can sometimes feel like the Wild West. By thinking ahead and arming yourself with these Prometheus exporters best practices, you can make your life easier so you can spend less time maintaining exporters and more time on the things that make a difference for your organization.
1. Find the right Prometheus exporter
As you start using Prometheus, you will soon discover that there are many Prometheus exporters available to monitor the various applications and cloud services that are critical to your application environment. However, you will also be left with the problem of choosing which one to use.One way to handle this would be to personally evaluate how well each candidate exporter provides the metrics you're interested in, and how healthy the exporter is as a software project. For example, an exporter that was developed years ago by one person, with no recent updates, and a low number of PRs/issues/Github stars is likely unused and unmaintained.Many aspects of metrics and Prometheus exporters best practices are not obvious at first glance, so relying on existing curated lists can help find ones that are likely to work well into the future.Your first stop should be the Exporters and Integrations page on the main Prometheus website. If your application or the protocol it provides metrics over is listed there, then that exporter is probably a good choice.There are also third-party listings of exporters, such as PromCat.io maintained by Sysdig, or the default port allocations page, which inadvertently ended up as a fairly comprehensive list of exporters.
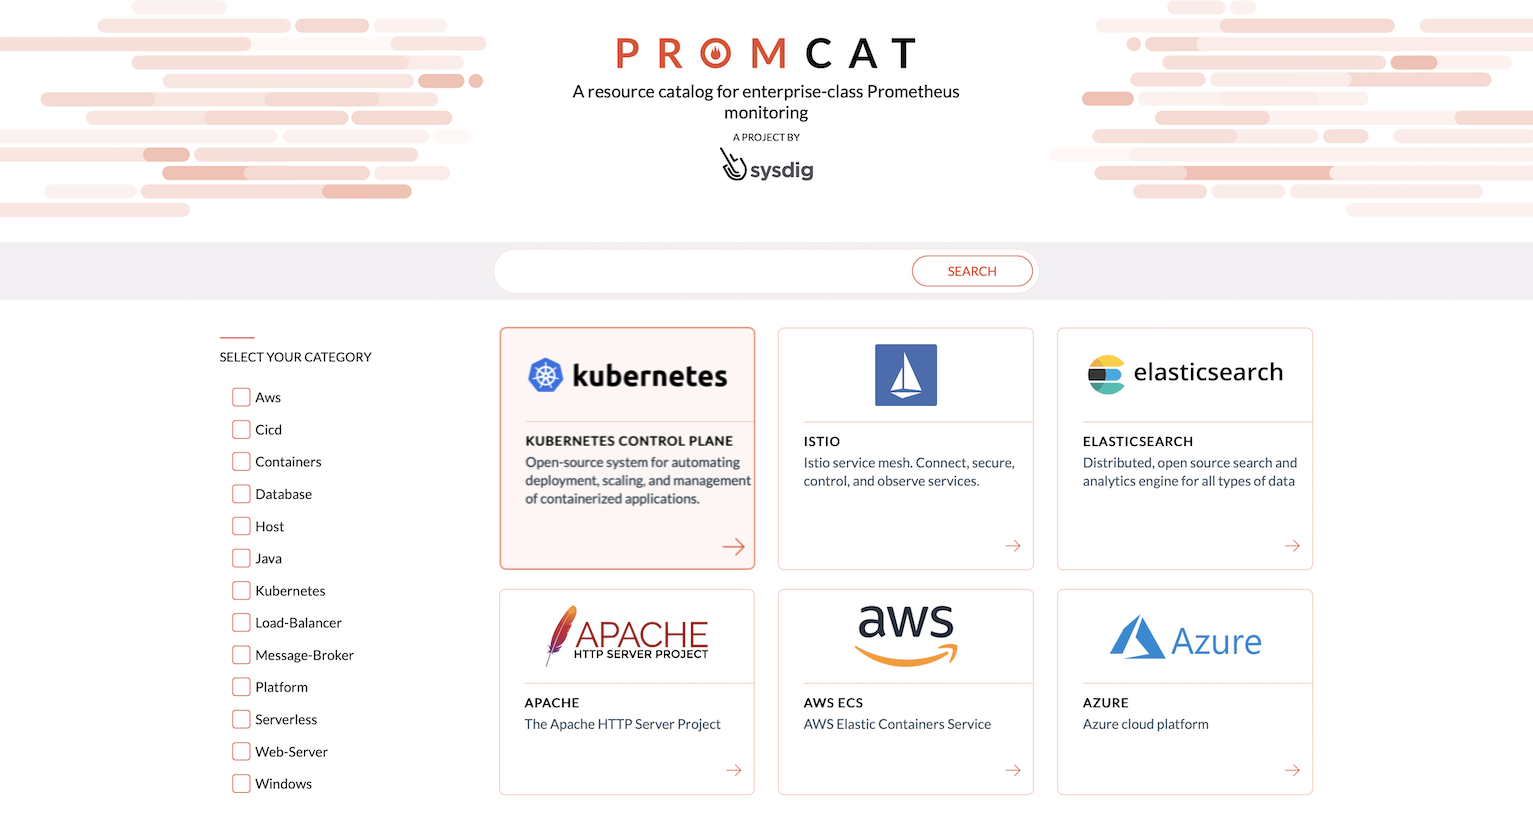
PromCat helps you eliminate the time it takes to choose and test Prometheus exporters, dashboards, and alerts. Sysdig has a team of engineers who maintain this site and continually test the content to make sure it is working correctly. For example:
2. Understand your exporter metrics
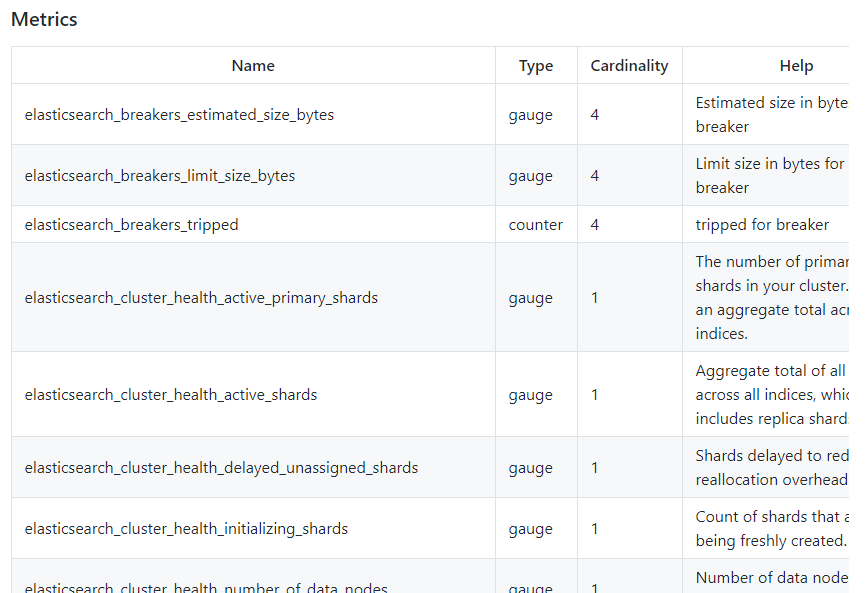
Each exporter comes with its own set of metrics that it exposes. It is a Prometheus exporters best practice to provide that information. Metrics details are usually listed on the exporter's project page, although sometimes you'll have to look for it in a help file or a documentation page. If the exporter uses the OpenMetrics format, it can add several fields with extra information to the metric, like type, info, or units.
Another thing to look for in the exporter documentation is how to label its metrics to help you understand them.Instrumentation labels will provide context like "Is this from a production service or a dev environment?", "What host is the service running on?", and "What application does this service belong to?" For example, both the backend and analytics teams may have their own MySQLds. You will later want to filter out those metrics and split things up by application name, production and development, or region.Just as instrumentation labels are useful when analyzing what's going on inside an application, target labels are useful when aggregating metrics across an entire deployment. Judicious use of target labels allows for answering questions like "how much CPU all development applications are currently using worldwide?" or "what is the total RAM usage of all applications owned by the frontend team in Europe?" You can see examples of using target labels in this webinar.
3. Set alerts that matter and are actionable
Alerts can be challenging when learning a new application monitoring or cloud monitoring tool like Prometheus exporters. If you set your alerts with a low threshold, your support teams will develop alert fatigue. On the other end of the spectrum, if your alerts are not triggering at the right time, you may miss important information about a condition that could be affecting your end-users.The first step in figuring out any alert strategy is to understand your applications, and the same applies to Prometheus exporters. By following the DevOps guidelines of Service Level Indicators and Service Level Objectives along with the golden signals for your application or service, you can determine what critical elements will need an alert. A good monitoring tool with deep visibility and Kubernetes context can help find those critical factors.Working with tools that use native PromQL for alerts can save you time by avoiding the need to translate alerts into another format which can lead to errors. For example, promtool can help you test PromQL alert configurations (among other things).However, your tool for alerts should be able to handle more than just PromQL. Beyond setting basic alerts on any metric or event, you should also be able to output the results of that alert to email, Slack, Pagerduty, Service Now, etc.
4. Enable your team to use your data (or not)
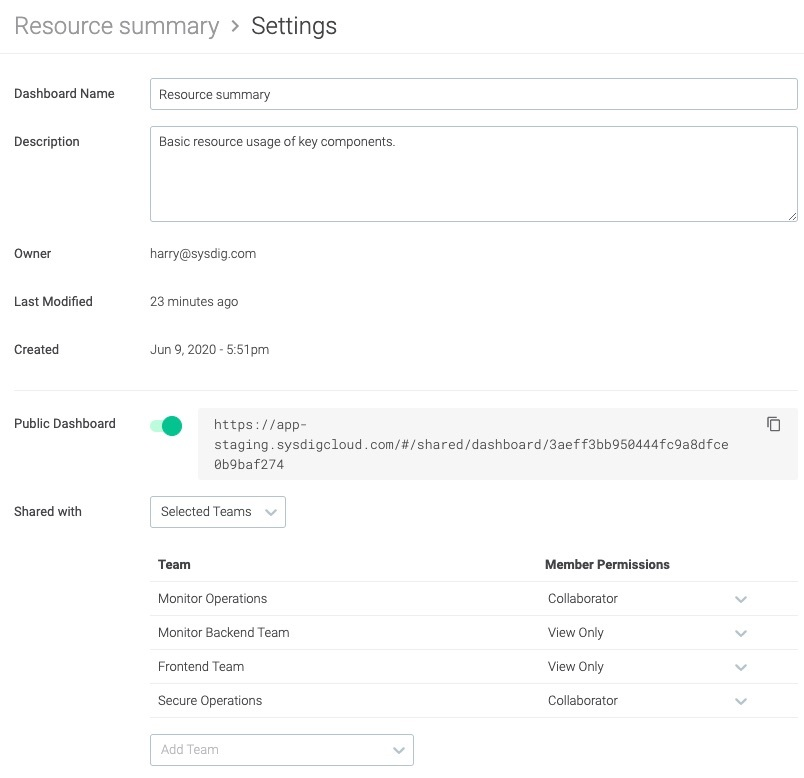
Now that you have this valuable data from your Prometheus exporters and you're using it for application monitoring and cloud service monitoring, make sure your team can see it and use it.The most common way to interact with those metrics is visualizing the data inside Dashboards. To help create them, PromCat.io provides dashboard templates ready to be imported into Grafana or Sysdig Monitor.But how is your team managing those Dashboards? It's a Prometheus exporters best practice that, instead of each team member creating their own dashboards, a single dashboard is created and shared across the whole DevOps team. Team members can use that as an example and only make minor changes if they need to. To make things work, your monitoring tool should be able to define who can see those dashboards and what level of access they are granted (View Only or Collaborator with edit privileges).Sometimes, you need to be able to restrict access to your metric data as well. If your monitoring tool has full RBAC support, you can provide each team with just the data they need. For example, an application team should access only the metrics being emitted from their namespace, while an on-call team will need read-only access to all production hosts.
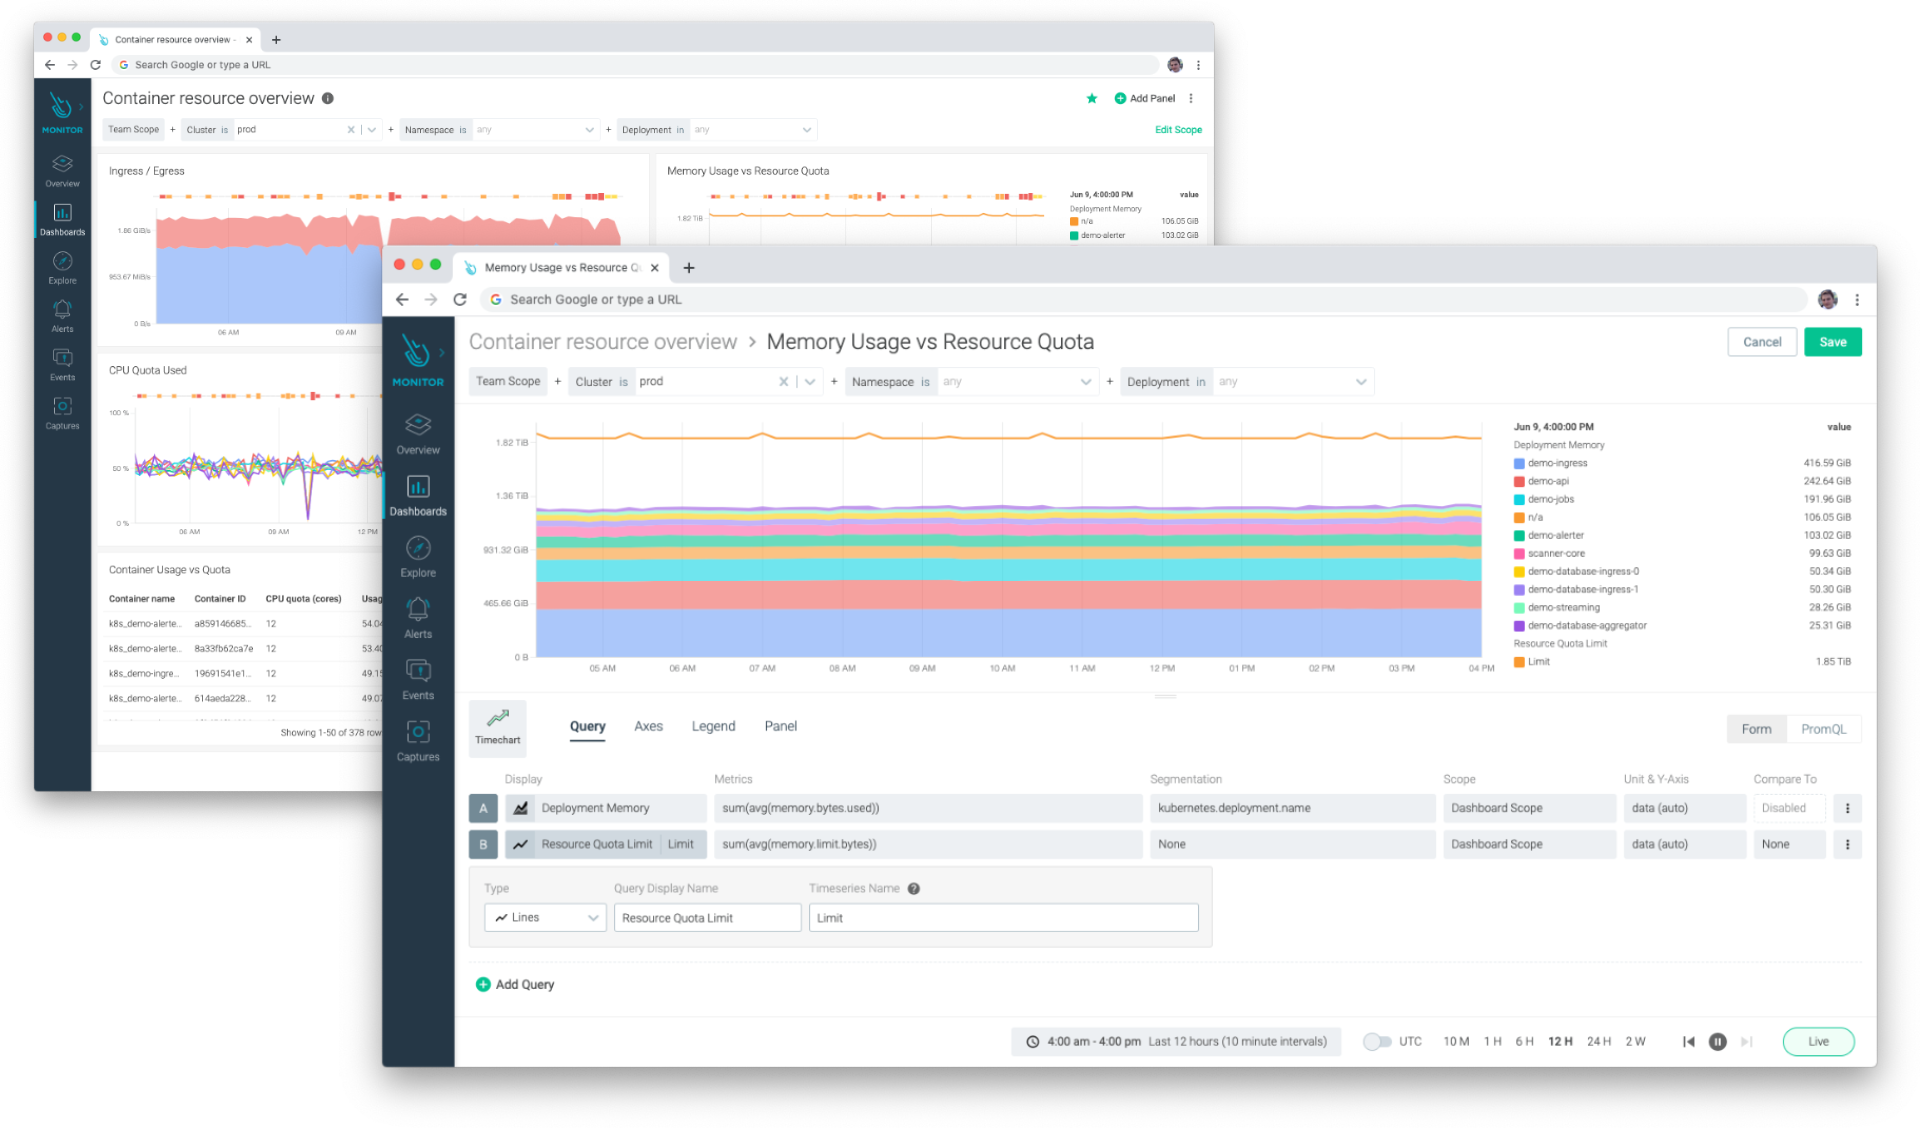
PromQL is a powerful way to query the metrics you collect from your Prometheus exporters. With PromQL, you can perform complex mathematical operations, statistical analyses, and use a variety of functions.While mastering PromQL can make it feel like you've leveled up your monitoring expertise, it does have a steep learning curve which shouldn't be overlooked. If you want new users to get up and running quickly, you should make sure you use a tool that will allow for some simple form-based entry when creating dashboards. You shouldn't ask those new users to write complex PromQL queries composed of joins and functions. Also, your tool shouldn't be complex for non-technical folks who just want to run a simple report to perform rightsizing tasks.
5. Have a plan for scale
As you continue to use Prometheus with more and more exporters, bottlenecks on visibility, horizontal scaling, and long term storage might arise. It's a Prometheus exporters best practice to plan how to scale your Prometheus exporter metrics before you run into problems.Let's take a look at these Prometheus scaling challenges and some different ways to address them.
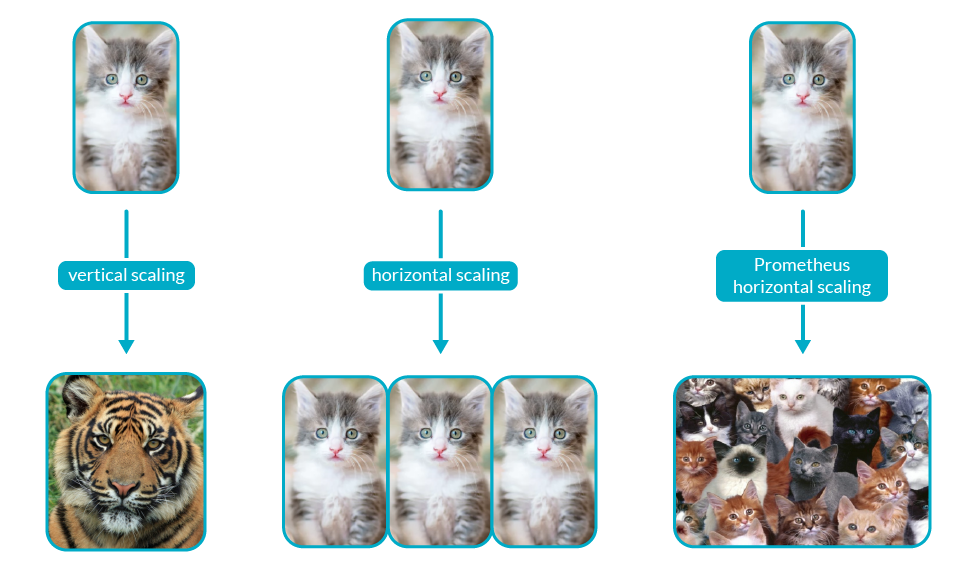
Global Prometheus Visibility: As you grow, you will want to see data not just from one cluster, but across the several ones that conform your infrastructure to see how your broader environment is performing.Horizontal Scaling: As your environment grows, so does the number of services in Kubernetes, metric cardinality, and the memory usage in Prometheus. By design, Prometheus does not scale horizontally. Once you hit the limit of vertical scaling, that's it.Long Term Storage: Prometheus can track millions of measurements in real-time. However, the longer you want to keep your data, the more resources you will consume. You may drop metrics sooner, but then you won't be able to evaluate monitoring data for trend analysis over weeks, months, or years.
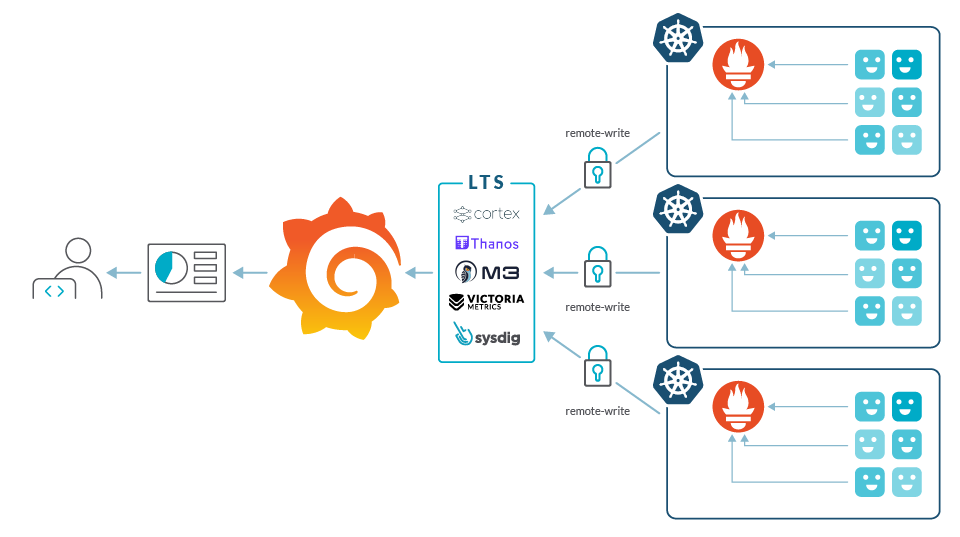
To deal with these scaling issues, you can try consolidating Grafana, deploying Thanos or Cortex, or use a commercially available solution like Sysdig. Also, a SaaS-based solution will certainly solve a few issues relating to scale since your SaaS software vendor should be able to accommodate growth more easily than you could on your own. We detail the potential issues with these solutions for handling scale in "Challenges using Prometheus at scale."
Conclusion
Prometheus, as one of the foundations of the cloud-native environment, has become the de-facto standard for visibility in Kubernetes environments. You will need exporters to monitor critical applications and cloud services. It's important to remember that not all exporters are the same, and monitoring solutions might not be ready for scale. I hope these tips will help you succeed with Prometheus monitoring using exporters by looking for well-maintained projects, understanding your metrics, and planning for growth ahead of time.Choosing the right tool is key. Sysdig enables you to follow these Prometheus exporters best practices, and with its guided onboarding you will be set in less than five minutes. Our full Prometheus compatibility, out-of-the-box dashboards, and long time retention help lower your MTTR while increasing performance and availability for your environment. Try it today!To see the Application and cloud service monitoring workflow in action, check out our webinar "So Many Metrics, So Little Time: 5 Prometheus Exporter Best Practices".