


Falco Feeds extends the power of Falco by giving open source-focused companies access to expert-written rules that are continuously updated as new threats are discovered.

This article will cover the most common challenges you might find when trying to use Prometheus at scale.
Prometheus is one of the foundations of the cloud-native environment. It has become the de-facto standard for visibility in Kubernetes environments, creating a new category called Prometheus monitoring. The Prometheus journey is usually tied to the Kubernetes journey and the different development stages, from proof of concept to production.
Prometheus first steps
Often, Prometheus comes hand in hand with the first Kubernetes cluster, which is during the development stage. After deploying some apps, you may realize that you need insight into the cluster and your old host-based toolset doesn't work. After an exhaustive research (first Google result), you discover Prometheus.
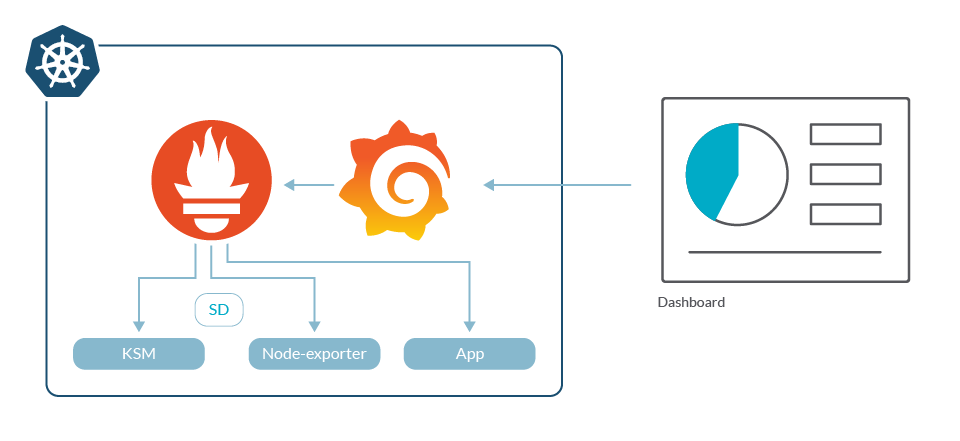
Prometheus is easy to begin after deploying the server, some basic exporters and Grafana, you can get metrics so you can start building dashboards and alerts.
Then, you dig deeper into Prometheus and discover some very good features:
- Service discovery to make configuration easier.
- Hundreds of exporters built by the open-source community.
- Instrumentation libraries to get custom metrics from your application.
- It is OSS, under the CNCF umbrella, being the second project to graduate after Kubernetes.
- Kubernetes is already instrumented and exposes Prometheus metrics in all of its services.
At this point, everything looks great. Kubernetes is your best friend, your apps scale smoothly and you can watch many things from your fancy dashboard. You are ready for the next step.
"Prometheus has become the de-facto standard for visibility in Kubernetes environments. Here are some challenges you’ll have to solve when it’s time to scale it to your production needs 📈."
Let's move forward to production
Your second Kubernetes cluster is here and you follow the same process; Prometheus, exporters and Grafana are swiftly deployed. The staging cluster is usually bigger than development, but Prometheus seems to cope with it well. There is only a small set of applications, and the number of dashboards and users is low so migration is easy too.
The first little problem arises. Now, you have two different Grafana installations and need to switch between them to see metrics from development and staging. At this moment, developers aren't too worried about this, but starts to itch. Everything checks out and production release is good to go.
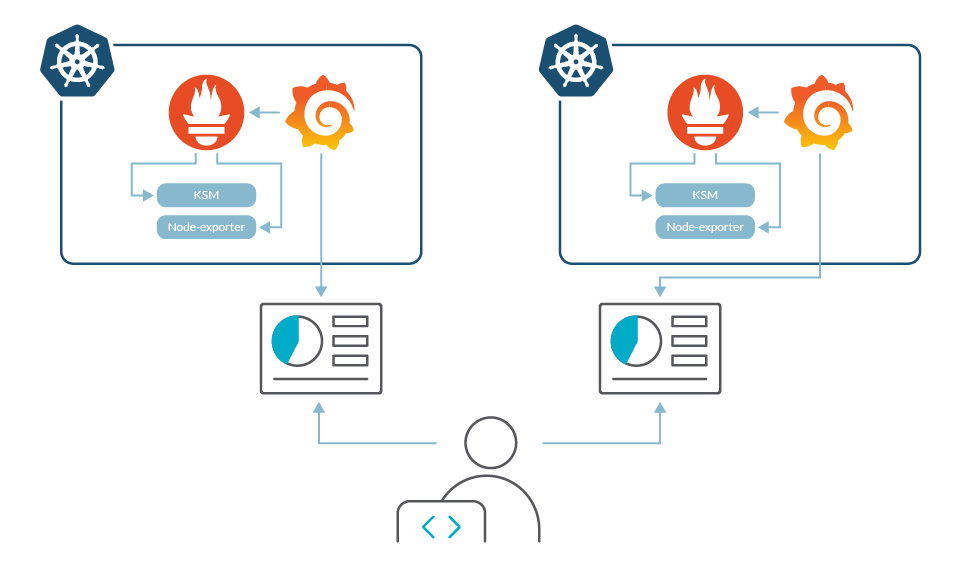
There it is. Your third cluster. Follow the same process again; deploy Prometheus, exporters and Grafana, and migrate dashboards and users. Users are not happy about having a third dashboard portal, but it is not a show stopper.
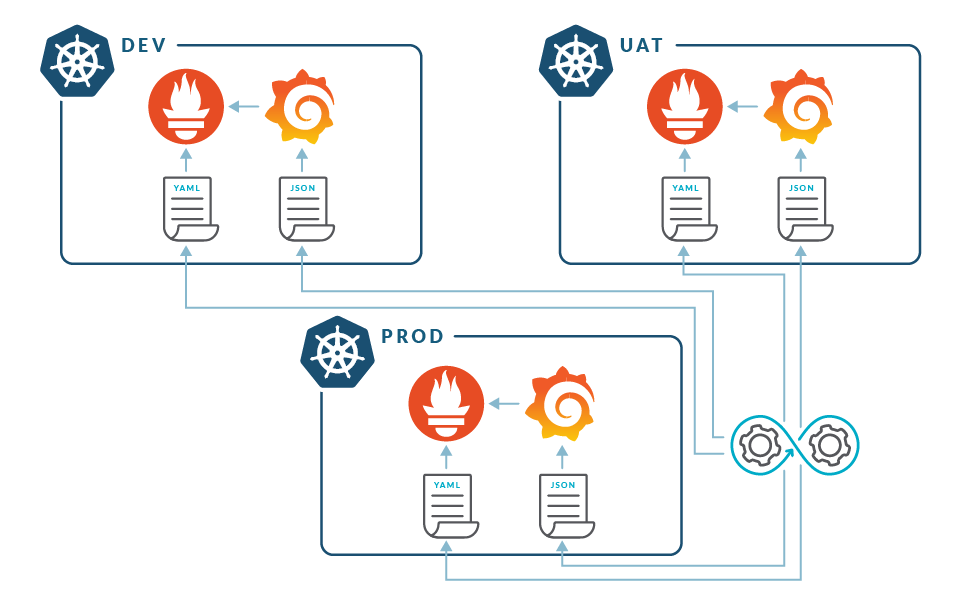
Results are so good that the company decides to migrate more applications to Kubernetes. New users, configurations, dashboards and alerts have to be added in each cluster one by one. Managing configuration in a consistent way starts to require some effort and organization.
As the applications grow in numbers, new requirements arise, and new clusters are created in order to host different applications, serve different regions and increase availability. Keeping different Prometheus and Grafana instances for each one becomes a challenge, and DevOps and development teams start to complain.
Keeping global visibility
The distributed model presents different challenges:
- It doesn't allow global visibility. Several production clusters would make this a new requirement.
- Operations can be cumbersome and time consuming.
- This model can complicate governance and regulatory compliance.
In addition to making access to different clusters easier, a centralized visualization tool allows you to visualize and correlate information from services across multiple clusters in the same dashboard.
At first glance, this can seem to be easy: I deploy a centralized Grafana and add the different Prometheus servers running in the clusters as datasources.
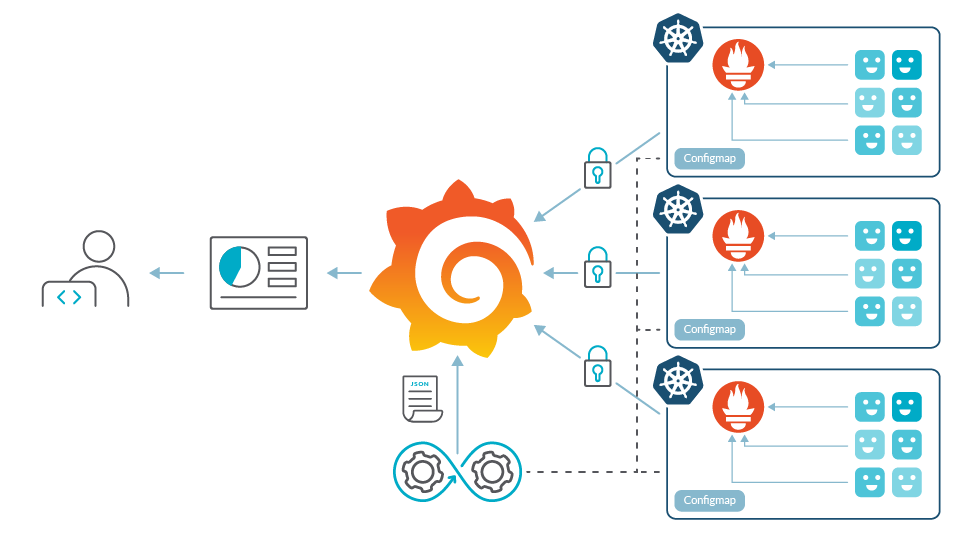
This has some hidden challenges:
- Security is not a feature included in Prometheus. As long as the communication between Prometheus and Grafana is intracluster, this is not an issue. However, as you get Grafana out of the cluster, you need to implement something on top of Prometheus to secure the connection and control access to the metrics. There are many solutions to this issue but they require some effort of implementation and maintenance (manage certificates, create ingress controllers, configure security in Grafana, etc.).
- If the clusters are dynamic or change, you often need to implement a way to automatically add datasources to Grafana every time you deploy a Prometheus in a cluster.
- This allows us to mix in a dashboard panels from different sources, but we still can't query services across different clusters and perform really global queries.
- Controlling who is accessing what data becomes more important, and an RBAC system may be required. Integration with identity services is most likely necessary in order to keep the user base updated, and this might become a compliance requirement.
All of these problems are not blockers, but they require an effort of architecture design, development and implementation. Maintenance of this entire structure also requires significant resources.
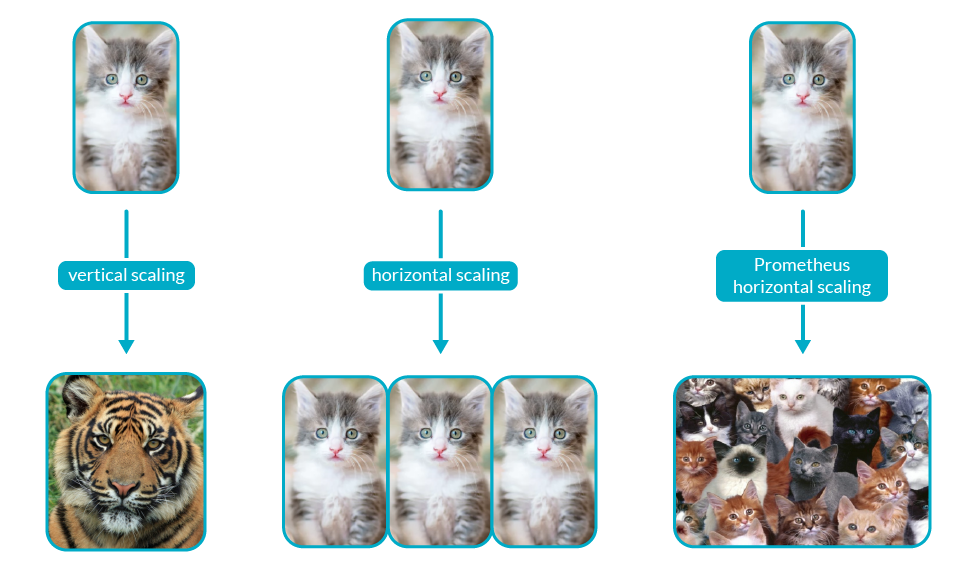
Prometheus horizontal scale
With some effort from your team, you have a decent centralized system and everything seems perfect, until a new problem arises. Developers understand the power of custom metrics with business information, and instrument the code to obtain them. While your organization grows, the number of services in Kubernetes increase and metrics usage rises. Clusters are upscaled and the services have more and more replicas.
Your Prometheus servers start dying and with some research, you clearly see a memory problem. Memory usage in Prometheus is directly proportional to the number of time series stored, and as your timeseries grow in numbers, you start to have OOM kills. You raise the resource quota limits but you can't do this ad infinitum. You will eventually reach the memory capacity of a node, and no pod can go beyond that. A Prometheus with millions of metrics can use more than 100GB of RAM, and that can be an issue running in Kubernetes. You must scale out to absorb capacity, but the short answer is that you can't. Prometheus is not designed to be scaled horizontally. Once you hit the limit of vertical scaling, you're done.
There are some workarounds for this issue, like sharding different metrics throughout several Prometheus servers, but it's a tricky process. It adds complexity to the setup and can make troubleshooting difficult.
We give up, let's try a long term storage solution
Many people have faced these same issues before. Given that Prometheus claims it's not a long-term metrics storage, the expected outcome was that somebody would eventually create that long-term storage for Prometheus metrics.
Currently, there are several open-source projects to provide long term storage (LTS). These community projects are ahead of the rest: Cortex, Thanos or M3.
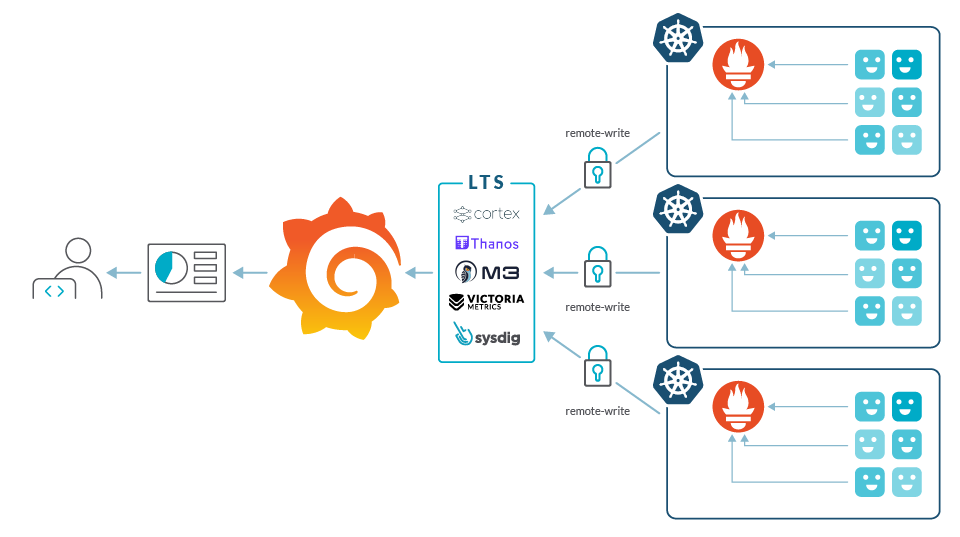
These services are not free of complications, however:
- Architecture is complex and can require a lot of effort to deploy, optimize and maintain the monitoring self-run service. There have been several improvements in this area, but still requires a good level of Prometheus understanding.
- Operation costs can be high. You can leverage managed databases like DynamoDB, but you still need to scale the rest of the monitoring services and the metrics throughput can be very high.
- You need to implement your own multi cluster strategy, creating labels or other mechanisms to be able to differentiate metrics.
- Implementation of multi-tenancy can vary in the different services with different levels of granularity.
What's next?
Prometheus has been a game changer in the monitoring landscape for cloud-native applications, like Kubernetes has been to container orchestration. However, even large tech companies find the challenges of scaling Prometheus in a DIY fashion daunting. Every full-time equivalent resource that is dedicated to maintaining this approach is one less developer that could be writing innovative code to transform your business.
To be an early adopter and explore new fields is exciting, but sometimes it's nice when you can just pay for a good service and avoid a path full of pain.
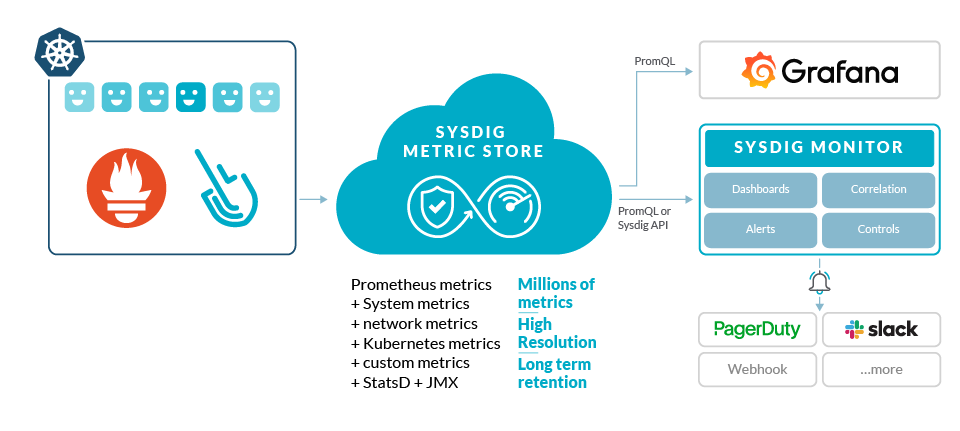
To try to relieve the pain that many of our customers are feeling, Sysdig has been working steadily to evolve our platform. We're hoping to become fully compatible with Prometheus while simultaneously improving our ability to scale to millions of time series and retain data for longer periods. With Sysdig, you can now take advantage of a supported platform that delivers a scalable, secure solution for Prometheus monitoring. At the same time, we're bringing that same joy of visibility to developers when they first discovered what Prometheus could do. Haven't tested Sysdig yet? Sign up for a free trial now!.