


Falco Feeds extends the power of Falco by giving open source-focused companies access to expert-written rules that are continuously updated as new threats are discovered.

Since Sysdig now offers Prometheus support in addition to our commercial monitoring product Sysdig Monitor, users have been looking for a better understanding of how Prometheus monitoring and Sysdig Monitor compare and contrast when it comes to Docker and Kubernetes monitoring. Are they enemies? Lovers? Twins separated at birth? Let's go there. While there are a couple commercial implementations of Prometheus, the vast majority of users are consuming or considering open source Prometheus. So in this blog post we'll compare vanilla, open source Prometheus with commercial Sysdig Monitor.
This is a pretty comprehensive blog post, so here's the TL;DR: Prometheus and Sysdig Monitor are very good friends. BFFs. Prometheus is awesome developer tooling and the premier metrics format for modern environments. We recommend using open source Prometheus for individual developers or small development teams that build their own tooling around their core software; for those are only looking for a small window of monitoring data; or for those who have standardized on only using Prometheus exporters.
Sysdig Monitor speaks native Prometheus metrics and fully understands exporters, but layers on more default metrics, enterprise class data management, scale, integrations, and support. We recommend Sysdig Monitor for more complex environments, typically where DevOps or Platform Ops is responsible for software in production; where there is a mix of custom metric types; there is a desire for troubleshooting as well as monitoring data; and there are requirements around long term data retention, management, and user access controls.
Each system has areas where it shines, and where it lacks. Both share a love of Kubernetes, Docker, and long walks on the beach at sunset. Swipe right to read more.
In order to see how we get to this conclusion let's compare:
- Instrumentation models
- Data types & data formats
- Scalability models
- Data analysis
- Management and security
- Troubleshooting
But first, let's understand what we're comparing.
What is Prometheus monitoring? It's not one thing, it's three!
Prometheus monitoring actually started as an open source, time series database project at SoundCloud. Prometheus is still that at its core… It can be used in all the ways a time series DB can be used, and isn't strictly limited to container monitoring.
To go with the time series DB's data model, Prometheus specified a metrics format heavily optimized for modern distributed systems. This is in fact the second thing that "is" Prometheus – a new metric format and a way to scrape that data out of applications. This format is being formalized into the OpenMetrics format, where developers from Prometheus, Sysdig, and other organizations are working towards a common standard.
Next, the community layered on tools for data querying, alerting, and visualization. When all of these pieces are combined with the time-series database and use the metrics format… then you have the Prometheus monitoring system.
What is Sysdig? It's not one thing, it's two!
Sysdig also started as open source, but in a totally different way. The Sysdig open source project is a troubleshooting tool that used a new instrumentation point to capture way more information than typical tools like htop, lsof and the like. Millions use it to troubleshoot Linux hosts but also Kubernetes and Docker.
Sysdig evolved this instrumentation into Sysdig Monitor, which is a complete system for monitoring, alerting, and troubleshooting containerized systems. Sysdig uses the same instrumentation to create Sysdig Secure, but covering Secure is out of the scope of this document. Sysdig Monitor was the first monitoring system that specifically focused on support for Docker and Kubernetes environments.
Note that Sysdig Monitor is a commercial tool, whereas Prometheus monitoring is open source. If you're a "build it" or a "buy it" zealot, then this makes your decision really easy!
#Prometheus #monitoring and @Sysdig Monitor: a technical comparison Click to tweet
Prometheus vs Sysdig: Instrumentation models
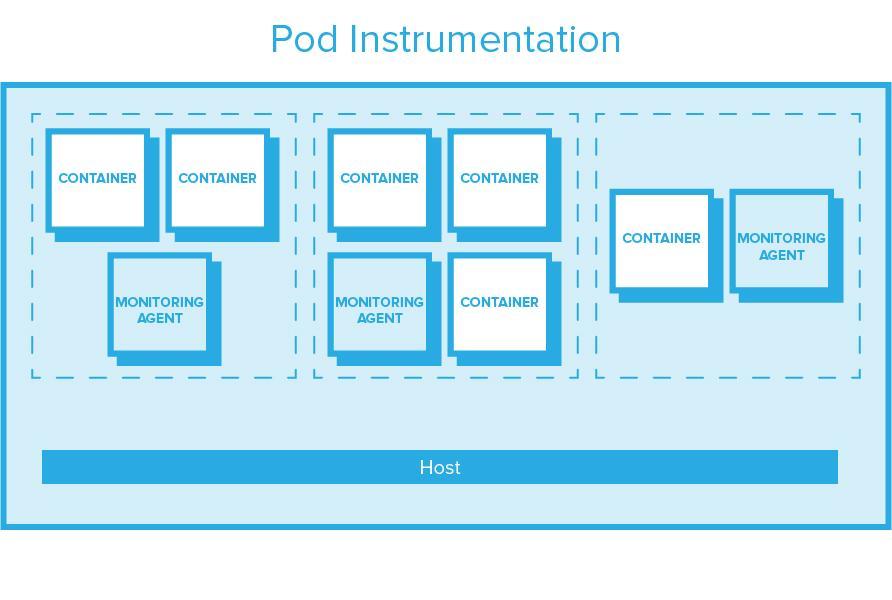
In static or virtual environments it was simple to get an agent running on a host and configure the agent based on the relevant applications. In containerized environments, however, this approach doesn't work:
- You can't place an agent within each container (without destroying a key value of containers).
- With applications coming and going, you can't manually configure agent plug-ins to collect relevant app-level metrics, and you certainly cannot depend on manual configuration for per-service monitoring policies.
- Containers themselves aren't that important – the services they make up matter more. You need additional real-time information (metadata) to make the container to service relationship.
With these new demands, the act of instrumenting your applications must be transparent, requiring as little ongoing human intervention as possible. Events or actions on the target system, infrastructure metrics, application metrics, service response times, custom metrics and resource/network utilization should be ingested without any intrusive effort from within the container. It certainly shouldn't require effort with the spin up of each additional container.
There are three possible approaches to achieving this. First is direct instrumentation of your code. Prometheus provides four official client libraries and about a dozen unofficial libraries for various languages. This makes it easy for developers to get started. Sysdig supports Prometheus metrics, StatsD, and JMX.
If you're either not writing the code (e.g., you're just deploying HAproxy) or you cannot instrument the code, exporters come into play. Exporters run as sidecars in Kubernetes pods. Prometheus exporters then can scrape available endpoints for metrics that are exposed by the application. The exporter can then be polled by Prometheus. For dynamic environments where the set of targets to scrape varies frequently, Prometheus can discover those targets automatically via service discovery.
The positive here is that this is something relatively easy to do in Kubernetes. There are downsides too, however: resource consumption can be high if you have many pods on a machine, and require a sidecar per pod – it's a bit like having a monitoring agent per process(!). The additional containers mean there are simply more chances for things to go wrong. Prometheus also requires that you explicitly configure pods to have exporters. While not difficult to do, it's another place for error, especially if you have multiple people making changes.
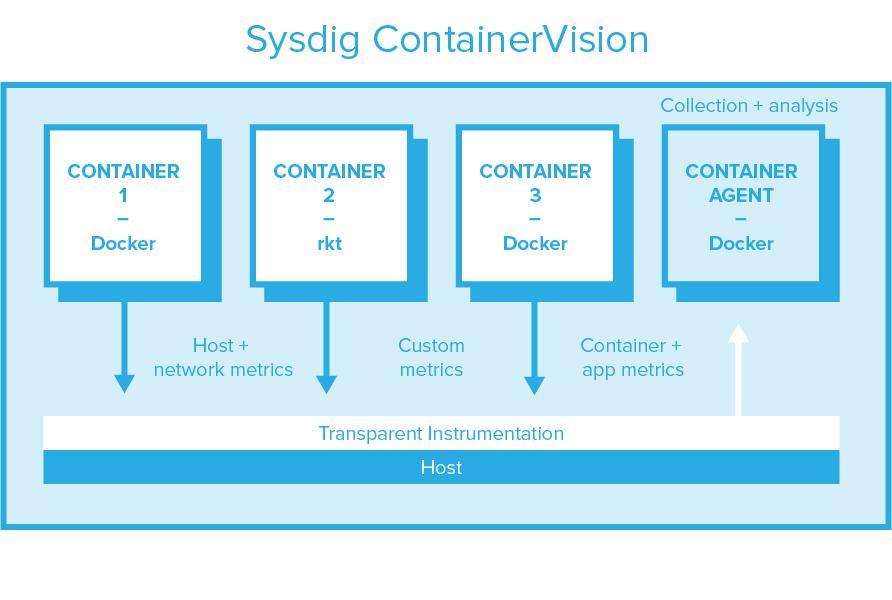
Sysdig Monitor is based on per-host, transparent instrumentation. This transparent instrumentation captures all application, container, exporter, and custom metrics (Prometheus, StatsD, and JMX) and host metrics with a single instrumentation point, and sends it to a container per host for processing & forward. Per-host agents produce more predictable resource consumption and require no modification to application code. Sysdig auto-discovers applications based on system calls, so no explicit config is usually required. Also – Sysdig's agent collects activity events for security enforcement. Sysdig's agent does currently require a privileged container and a kernel module. Stay tuned for some exciting developments that will change this – we can't tell you what they are just yet! Sysdig open sourced the kernel module as part of the Sysdig Linux and container visibility command-line tool.
Prometheus vs Sysdig: Data Types & Formats
Once you've instrumented the system, the next thing you're likely to care about is, "What data am I exactly getting within my monitoring system?" Let's break it down into a few categories to better understand what each system gives you.
Metrics
Metrics are the workhorse of a system like this, and so it's not surprising that both systems are good with them. Probably the most important distinctions come around consuming custom metrics, and consuming lower level host metrics.
Custom metrics
Prometheus only natively supports the Prometheus metrics format. StatsD support requires an additional exporter and the StatsD server, and requires a translation of StatsD tagging to Prometheus labels. JMX metrics require an additional exporter and do not support labels. For sure with Prometheus you can get the job done – the question will likely be how much complexity you are willing to endure in the process.
Sysdig supports Prometheus, StatsD, and JMX with parity. While we believe that the Prometheus metric format (or a derivative based on the OpenMetrics format) is likely the way of the future for most organizations, for most enterprises at scale, it's likely that their developers today use a mix of custom metrics formats. Sysdig allows you to collect these metrics with no exporters, automatically applies Kubernetes tagging to all formats, and can even collect these metrics without having your developers point the metrics to a collector or server. To understand how this process works through system calls, read about StatsD collection in Sysdig.
Metadata
Ah, metadata, how we love you. Call it labels, call it tags, call it what you like, it has radically changed how we store, manage, or slice-and-dice our data. There's a blog post on Kubernetes: "How container metadata changes your point of view" that I would encourage you to read. Both Prometheus monitoring and Sysdig Monitor embraced metadata from day one.
Briefly, here's what it's about: every time series is uniquely identified by its metric name and a set of key-value pairs, also known as labels. The key value pairs are metadata.
The metric name specifies the general feature of a system that is measured. Labels enable a dimensional data model in both products: any given combination of labels for the same metric name identifies a slice of that metric that you're interested in analyzing (For example, the metric http.response.time segmented by kubernetes.namespace = "prod" and kubernetes.deployment = "billing"). In a world where physical monitoring is radically different from monitoring the logical services that run on top, metadata helps you easily sort, filter, and aggregate your data in the way you need at any point in time.
As we'll show in the data analysis section, Prometheus monitoring and Sysdig Monitor have different models for accessing and massaging the data.
Events
Events provide important contextual data to your metrics. Events are verbose messages output by a range of systems that let you know that something occured at a particular point in time. When a metric spikes or falls through the floor, the first question you are likely to ask is, "Did something obvious happen in my environment to cause this?" Common examples of events that you might correlate with your metrics include: a code push, a Kubernetes CrashLoopBackOff, pod restarting, or a Docker kill.
Prometheus currently does not have a way to store this type of data. Sysdig uses Elasticsearch as part of its backend to store it. Sysdig automatically discovers Docker and Kubernetes events, but you can push any event (e.g., a Jenkins build) via the API. It's interesting to note that Prometheus has a reserved type of "string" in its query language – perhaps eventually events will be added to Prometheus as well.
Incident response records
As a form of data, this is unique to Sysdig Monitor. In fact, it's not just unique in relation to Prometheus, but to all monitoring systems that are out there. As a result – you might consider this out-of-scope for comparison, and that would be fair.
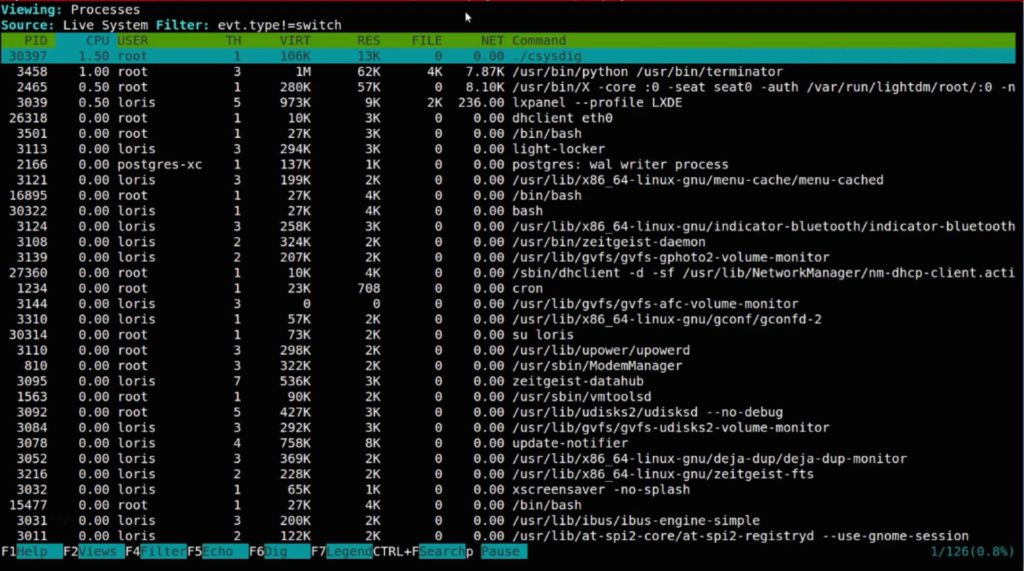
Sysdig's open source roots were focused on troubleshooting – not monitoring – and those roots are present in the monitoring system as well. Sysdig designed a workflow that would go from high level monitoring metrics and alerts => low level metrics => incident response records. In order to provide microsecond visibility to host, container, and application activities, Sysdig Monitor uses alert-based triggers to capture syscalls as incident records. Syscalls are useful for low-level troubleshooting, picking up where metrics leave off. For more information, see Sysdig vs Dtrace vs strace.
Syscalls give you microsecond visibility into everything going on in a host:
- Commands run.
- Process / thread activity.
- Files opened / written / deleted.
- Network traffic in / out.
- Visibility into actual payload.
- … and a bunch of other stuff.
Prometheus vs Sysdig: data analysis
PromQL
Prometheus provides a functional expression language that lets the user select, aggregate, and manipulate time series data in real time. The result of an expression can either be shown as a graph, viewed as tabular data in Prometheus's expression browser, or consumed by external systems via the HTTP API. Sysdig doesn't provide support today for a query language (PromQL or otherwise), so that's a definite element in favor of Prometheus.
Here's a quick example: select only those time series with the http_requests_total metric name that also have the job label set to prometheus and their group label set to canary:
Quote
http_requests_total{job="prometheus",group="canary"}With PromQL, as with most query languages, you have an incredible amount of flexibility. Create aggregations exactly how you need them. Build your own anomaly detection algorithms. Explore seasonality. Make data magic just as you want it. Here's a basic anomaly detection query from the Prometheus blog:
On the flip side, you need to learn a new DSL and build much of what your organization needs. As the person who deploys this system you're at risk of either having to teach everyone how to query it, or becoming the team's query jockey.
Sysdig provides basic calculations by default:
- 99th, 95th, and 50th percentiles.
- Average, Minimum, Maximum.
- Rate.
- "At least once".
- "For the entire time".
- Time-based single-metric anomaly detection.
- Group-based outlier detection.
But Sysdig doesn't provide the full flexibility as a query language might for manipulation. Sysdig's plan is to simply adopt PromQL as it is becoming quite common.
As opposed to Prometheus, Sysdig defaulted to a GUI & API approach to analyzing data. For example, here's a step through breaking down the rate of requests by pod. You can see the drop-down menus up top that let you choose scopes (container, pod, deployment, etc), and aggregations (sum, max, min, etc).
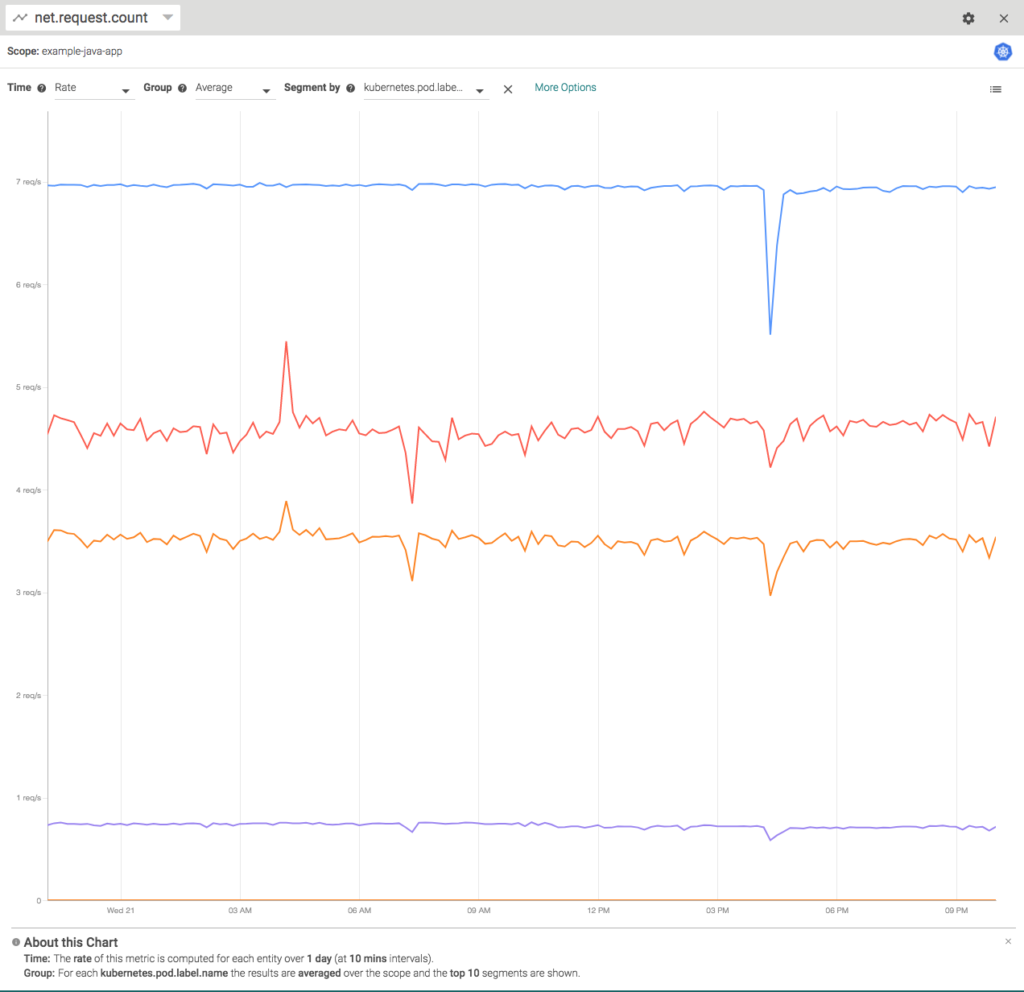
Both Sysdig and Prometheus provide Grafana support for basic dashboarding. For those familiar with Grafana this is a good starting point. Note that if you use Grafana with Prometheus, you'll still need to use the query language to customize these views. Grafana provides a text interface to the underlying PromQL.
As mentioned, Sysdig also provides its own UI for exploring and dashboarding. Its explore interface is like a distributed htop environment. Because Sysdig captures networking data by default, you can perform interesting visualizations like mapping out the communication paths of all your Kubernetes services like so:
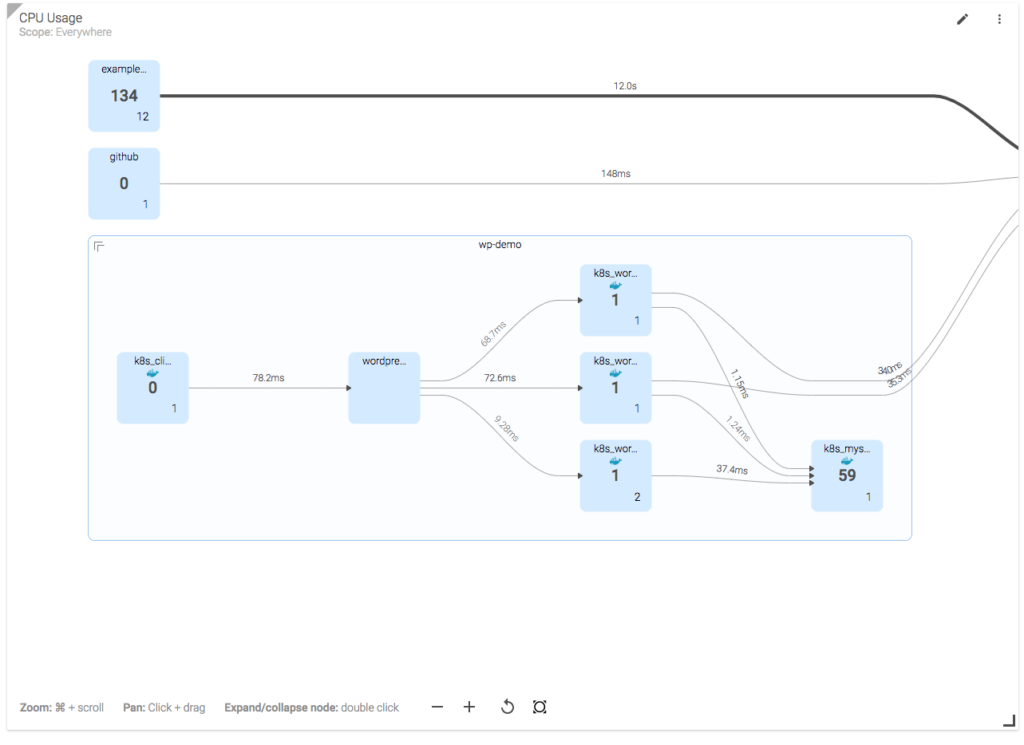
This topology map shows a number of Kubernetes namespaces, with a "drill down" into the deployments in the wp-demo. The lines between objects represent communication pathways, with the numbers on the line representing request time.
Prometheus vs Sysdig: alerting
Prometheus has a separate component called AlertManager as its alerting mechanism. It has a pretty rich feature set that includes alert grouping, inhibition, and silencing. Alerts are built directly off PromQL queries, meaning it is really easy to backtest an alert precisely before pushing it live.
On the downside, AlertManager manages everything through a configuration file. That's actually really nice for version control, but not as convenient for quick changes and easy reference. It may present challenges if you are trying to manage different levels of access within your organization.
Similar to data analysis, Sysdig has a GUI interface for managing alerts. Sysdig can alert both off events as well as metrics, which is a major difference from Prometheus. Alerts can use boolean logic to create more complex evaluations. Sysdig provides visual previews of alerts. Sysdig also has built-in anomaly detection and outlier detection.
One downside to Sysdig's approach here is that it doesn't leverage your existing version control system to manage alerts. That can sometimes make it difficult to track the changes in how your expecting your system to behave through the lens of alerts, although this can be automated via the API.
Prometheus vs Sysdig: scalability, durability, and reliability
Prometheus: vertical scalability
Prometheus includes a local on-disk time series database, but also optionally integrates with remote storage systems for long term storage. A limitation of the local storage is that it is not clustered or replicated. Thus, it is not arbitrarily scalable or durable in the face of disk or node outages and should be treated as an ephemeral sliding window of recent data. However, if your durability requirements are not strict, you may still succeed in storing up to years of data in the local storage. Prometheus suggests that you can emulate long-term storage by having Prometheus federating at larger intervals from your short-term Prometheus. Compression ratios may suffer here, limiting your actual long term storage.
On average, Prometheus uses only around 1-2 bytes per sample, which is incredibly efficient.
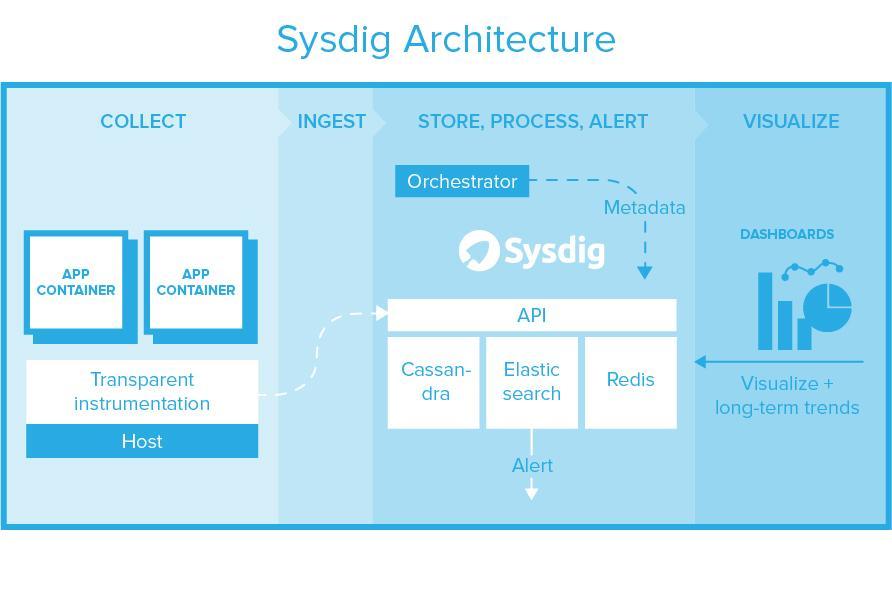
Sysdig: horizontal scalability
Scaling any type of database is hard, so Sysdig chose the path more travelled. Sysdig consists of horizontally scalable clusters of Cassandra (metrics), ElasticSearch (events), and Redis (intra-service brokering). Building on these components gives high reliability and scale to store years of data for long term trending and analysis. All scale up, performance tuning, backup, and recovery of these underlying systems can be used to protect, manage, and optimize Sysdig. All data is accessible by a REST API. This entire backend can be used via Sysdig's cloud service or deployed as software in a private cloud for greater security and isolation.
This design allows you to avoid running one system for monitoring or security and another system for long term analysis, data retention, or compliance. The underlying components themselves all possess high availability mechanisms, so part of the benefit of this design is that HA comes "for free" in the design. Of course you have to pay for the additional storage fees of replication.
There is another downside to consider to Sysdig's approach: while the components are well understood, scalable, and have HA, the cost is that at low-scale Sysdig is much more resource intensive than Prometheus. This doesn't matter if you're using Sysdig Monitor's SaaS service, but it should be a consideration if you are using Sysdig as on-premise software.
Prometheus vs Sysdig: management
Prometheus and Sysdig have significantly different approaches to management of data and access.
Sysdig starts from the premise that there is typically a platform operations team and developer teams, each of whom need different access to data not only for security reasons, but also for sanity reasons: Too. Much. Data. Sysdig uses the concept of Teams to scope down data, dashboards and alerts only to that which an individual needs to address their own services. Platform teams can see all data.
Teams can then be integrated with LDAP or other access management systems like SAML or OpenID, making it simpler to audit access and meet compliance requirements.
Prometheus looks more like a component of your Kubernetes deployment. Given its vertical scalability model, the expectation is that, at scale, you may have many Prometheus backends that would provide security via isolation – developers would log into the system that has the right data for them. Prometheus further inherits management elements available to them via Kubernetes (RBAC for example). Platform operations teams would either let developers manage their own systems or be responsible for managing an array of Prometheus backends.
Conclusion
When you compare Prometheus monitoring vs Sysdig Monitor, we don't believe there is one right answer for everyone. Your decision is going to depend on your:
- Monitoring requirements.
- Desire to build and operate a solution versus buy one.
- Requirements around user access, data management, retention, and scale.
We think both Prometheus monitoring and Sysdig Monitor fit well in different organizations. If you want to get down into your own blow-by-blow comparison of tooling, we suggest you use this 60-point monitoring scorecard to do your own analysis. And, you can always get a Sysdig Monitor free trial to compare against your Prometheus environment. Happy comparing!