


Falco Feeds extends the power of Falco by giving open source-focused companies access to expert-written rules that are continuously updated as new threats are discovered.

Welcome to another monthly update on what’s new from Sysdig. Our team continues to work hard to bring great new features to all of our customers, automatically and for free! Outside of building awesome new features and functions this month, we also had a lot of fun running cards against containers for a cause once again. If you missed it, feel free to catch-up on YouTube!
Kubernetes-native network security
A big release for us this month was creating and validating native Kubernetes network policies within Sysdig Secure!
This allows Sysdig users to generate a native Kubernetes network policy that they can use to protect their workloads. This doesn’t introduce any additional firewalls or other overheads, it simply uses the functionality that already exists in Kubernetes. We’ve designed this to make applying security easier, while maintaining the Kubernetes mantra of being agnostic and avoiding lock-in.
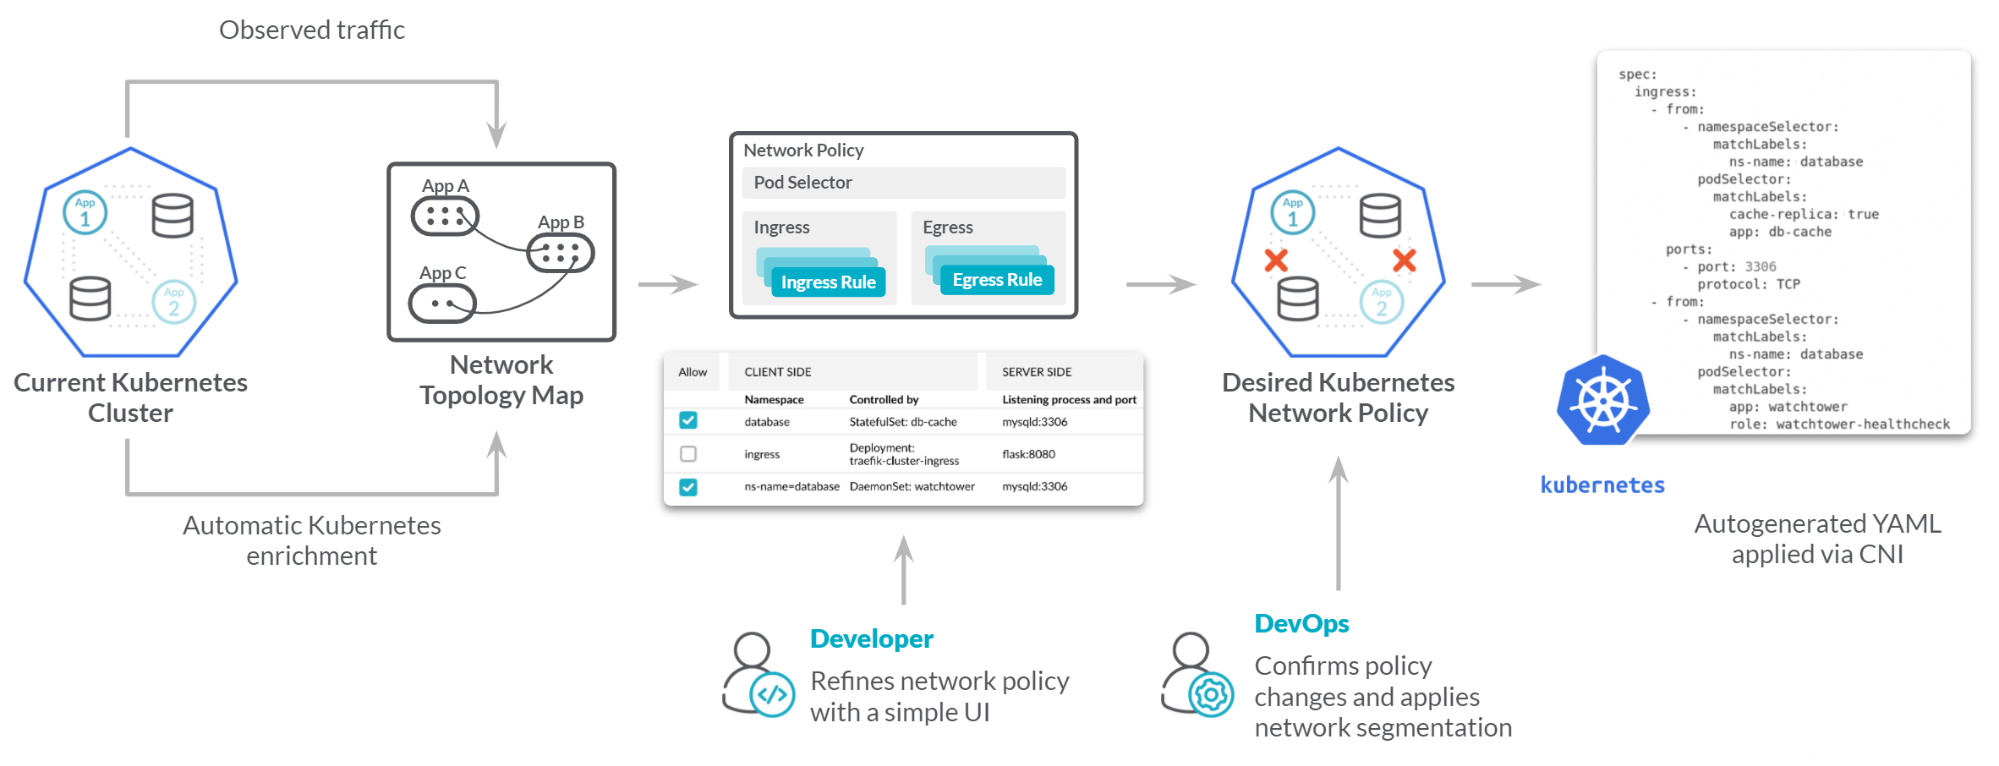
High level diagram of how zero trust network security security works
A highlight of the top benefits all our customers get from this new feature:
- Use native Kubernetes functions.
- Keep existing skills investment.
- No additional overhead (use network features that already exist).
- Validate before enforcement
- Visualize what impact changes will have.
- Flexibility over what changes will be made.
- Also model new application changes against existing rules.
- Help teams collaborate
- Bring security into the conversation.
- Give them the microservice context of the applications.
- Allow developers to embrace policy-as-code.
We’d love to get some feedback on the network policies feature; we’ll gradually be rolling this out as a beta feature for customers looking to test. This is an opportunity for you to help shape the future of Sysdig and give your operational feedback.
Other product updates
As always, please check out our own Release Notes for more details on product updates, and ping your local Sysdig contact if you have any questions about anything covered here.
Sysdig Secure
Kubernetes network policies
This is a really exciting new release for us, and as we previously noted, this brings some significant benefits to our customers. This feature includes several key components, which we’ll detail below:
- The Sysdig platform will analyze a running application and allow the generation of a specific Kubernetes native network policy.
- The Sysdig platform will help you visualize the network connections so the user can validate and check the connections.
- The generated policy can be modified if it’s required to be a 100% fit for all of the required use-cases. Some of the observed traffic may be undesirable after all!
Today, this is released as a beta feature and we’re looking for user feedback. If you’d like to give this a try, please reach out to your Sysdig representative. This feature requires Sysdig Agent 10.6 or newer
Choose the entity
Select the relevant cluster Kubernetes cluster, then the Namespace, and then the type of object you want to analyze (Service, Deployment, DaemonSet, StatefulSet, or Job). Once you have done that, you will get a list of entities that are within that scope. Select the one you want to start using for KNP modeling.
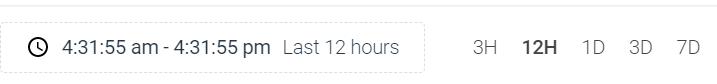
Set the observed time period
You don’t need to tell Sysdig to start observing the network traffic, we are already collecting all of that good information. That’s one of the many advantages of having monitoring capabilities natively in the same product! You just select the time period that you want to use to observe the traffic across.
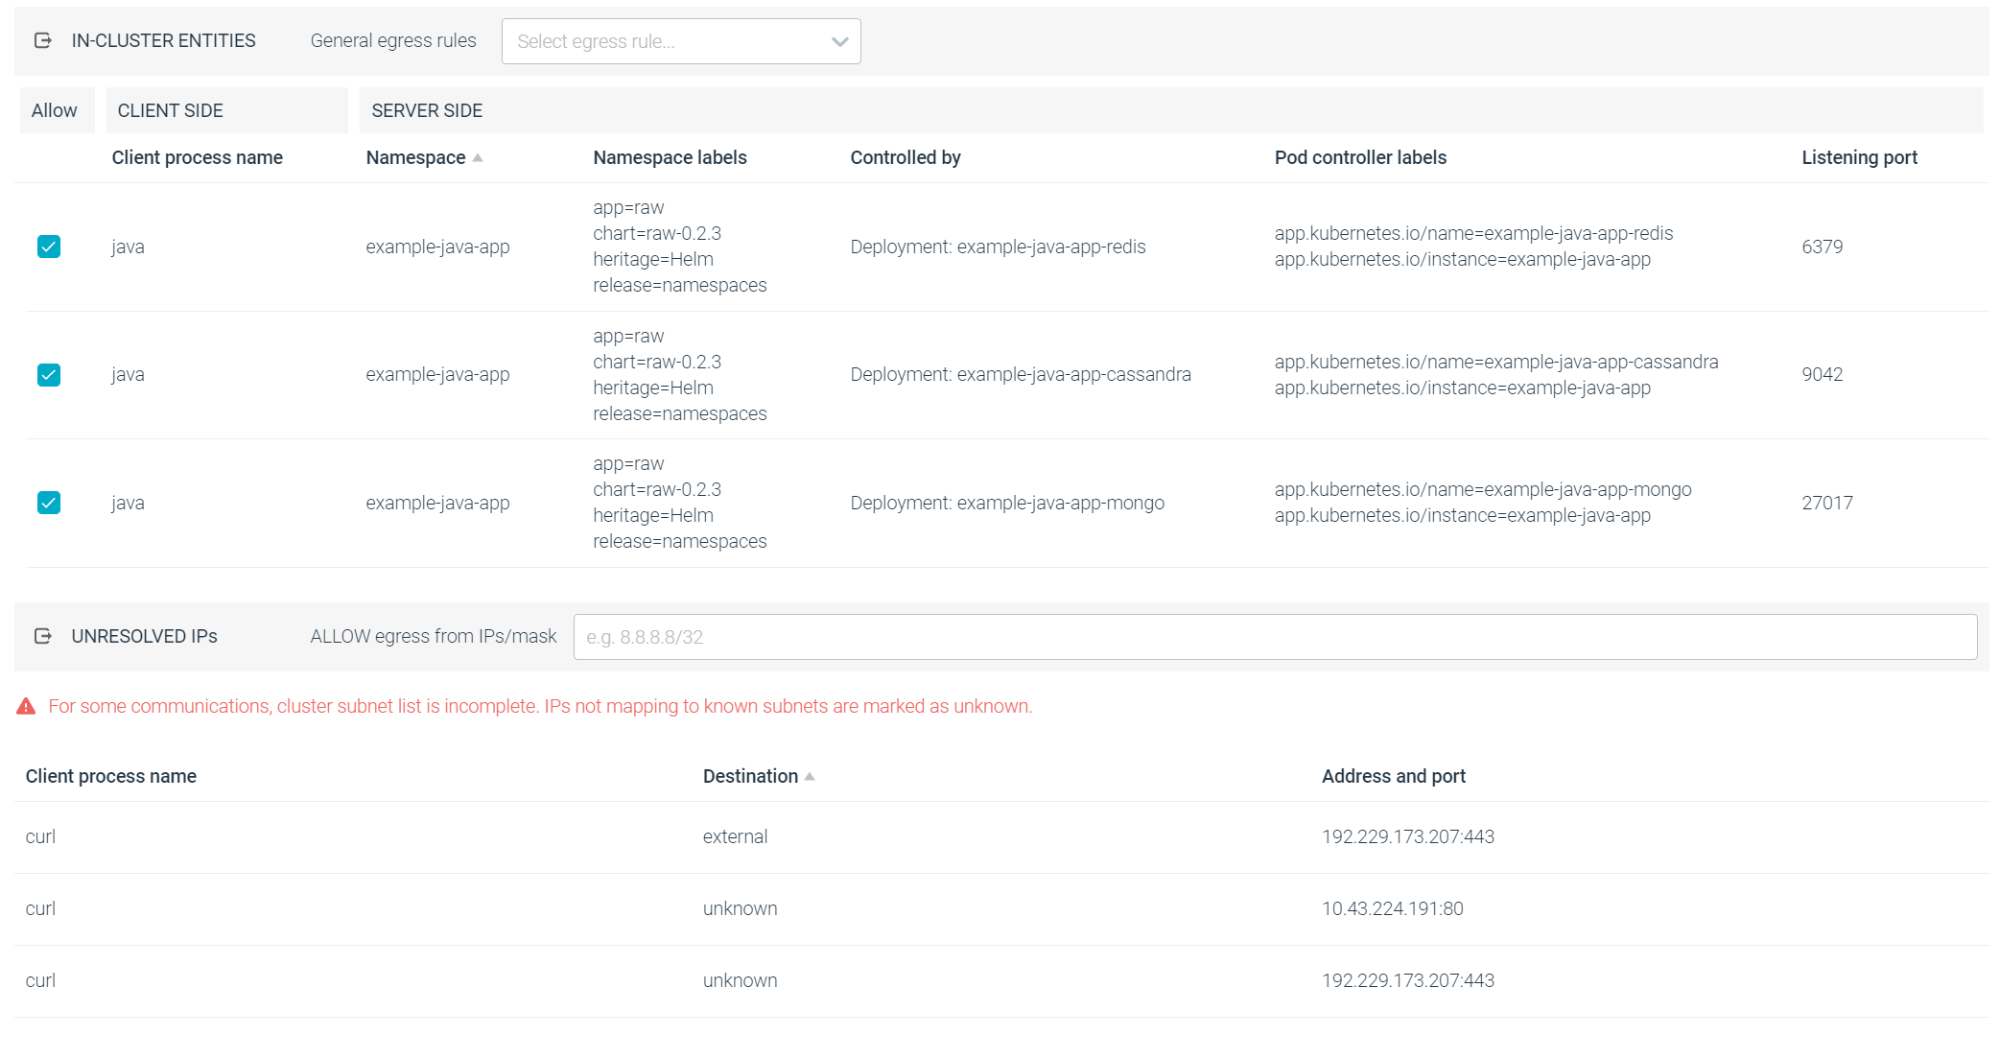
Ingress & Egress
This shows the observed traffic that has entered into (ingress) and was initiated outbound from (egress) this particular object. This is separated to show both in-cluster network communication and unresolved IPs (i.e. external traffic). To simplify the rule creation, similar traffic is ‘collapsed’ together where it can be.
For in-cluster entities, you can choose from the top drop-down box to block all, allow all, or only allow connections inside the namespace. Alternatively, you can use the checkboxes to specifically allow certain observed network connections.
For unresolved IPs, you would create a subnet mask to create rules to cover the different entities. In the below example, you might choose 192.229.173.0/24, 10.43.0.0/16
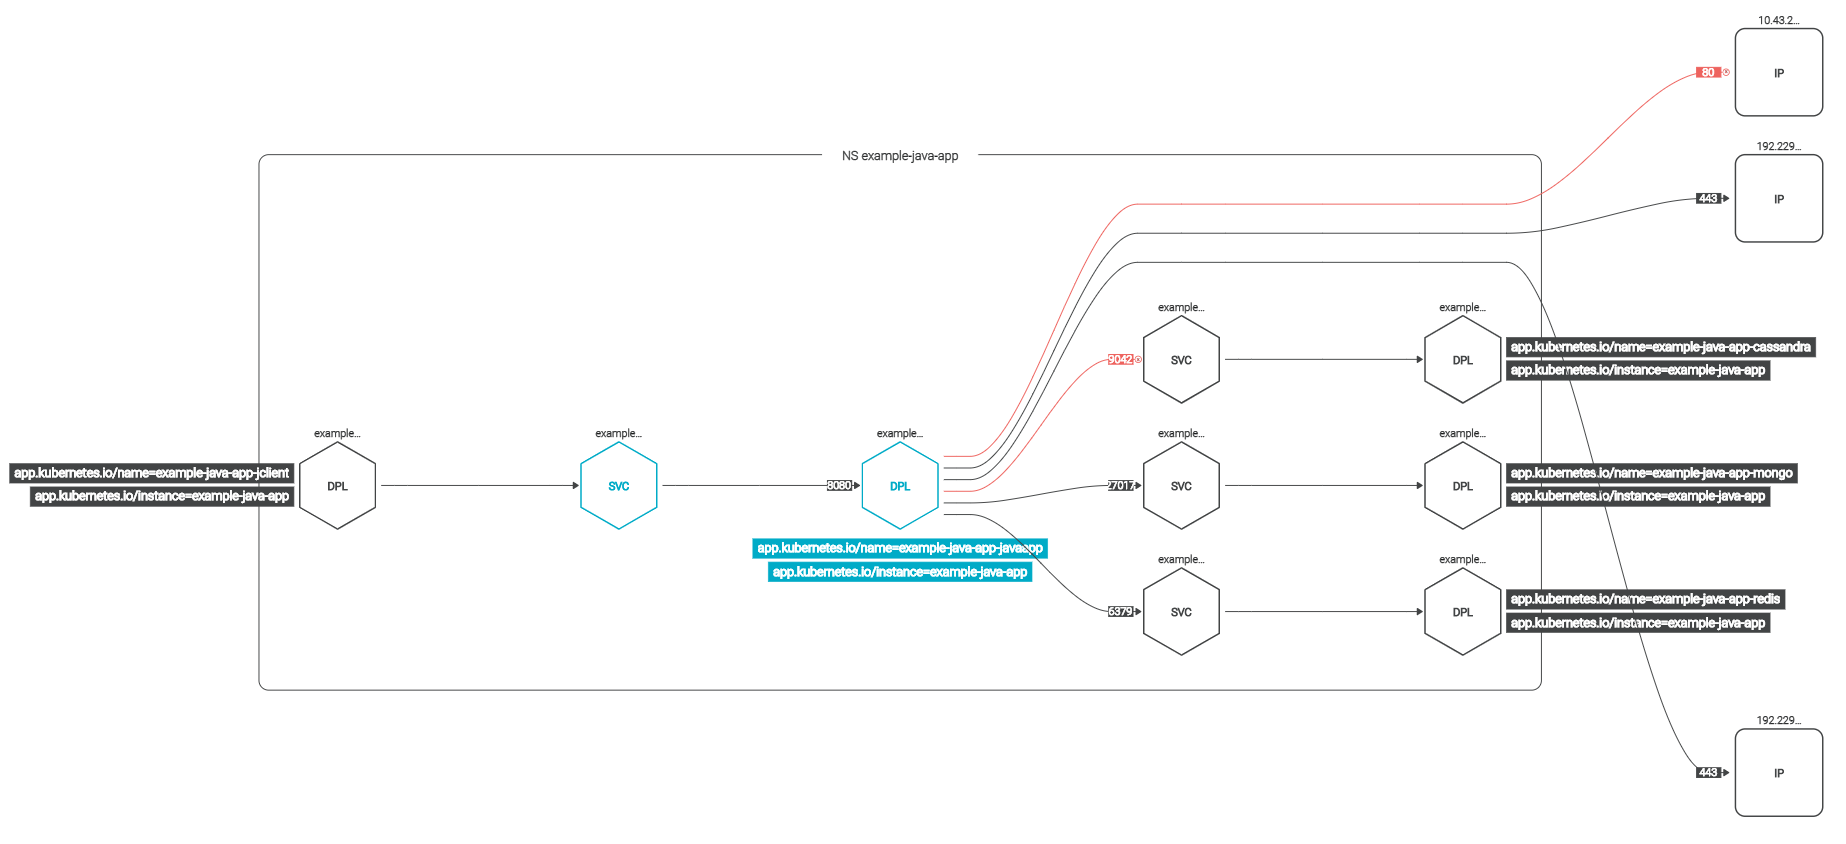
Topology
The topology view has two really useful purposes. It will initially help you visualize the traffic in the environment. While the Ingress & Egress pages have more detail in a tabular format, it’s often easier to simply visualize the network flows. The topology view will also automatically update as you modify the settings on the Ingress & Egress tabs to show what connections would be affected. The following screenshot shows that we have selected several connections to no longer be allowed, highlighted in red. This is a great way of validating a network policy before using it.
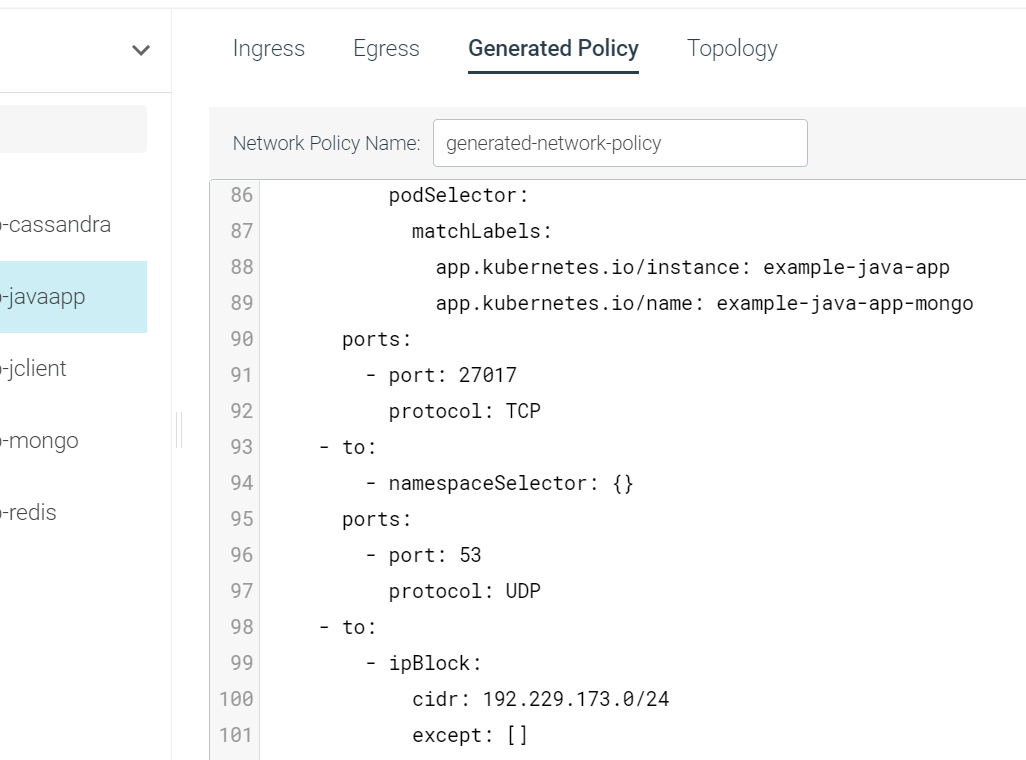
Generated policy
The Generated Policy tab gives you a dynamically created Kubernetes Network Policy based on what you have selected and configured on the Ingress & Egress tabs. You would then be able to copy this into your Kubernetes clusters, or if you want make some minor changes first. You have complete control here, and you end up with a fully native network policy. The great thing is that by using the native functionality in Kubernetes, Sysdig is completely out of band and non-disruptive if you have teams already using and setting network policies themselves.
How customers are using this feature
We have been working closely with several customers in developing this feature, and the overwhelming feedback is that the major benefit is in handling the security natively.
No one wants yet another firewall. Not only are we hearing that can have a huge impact on performance, but we also hear that it has a major impact on reliability. Customers told us they wanted to leverage the native functionality already available.
Our customers are using this to really tighten the network security of their Kubernetes clusters, and move more to a zero trust security design. We’ve heard from a few customers that this has given them greater assurances of some open source applications because they can define the egress rules, which not only blocks external traffic, but also really controls the intra-cluster communications.
Update to scan results
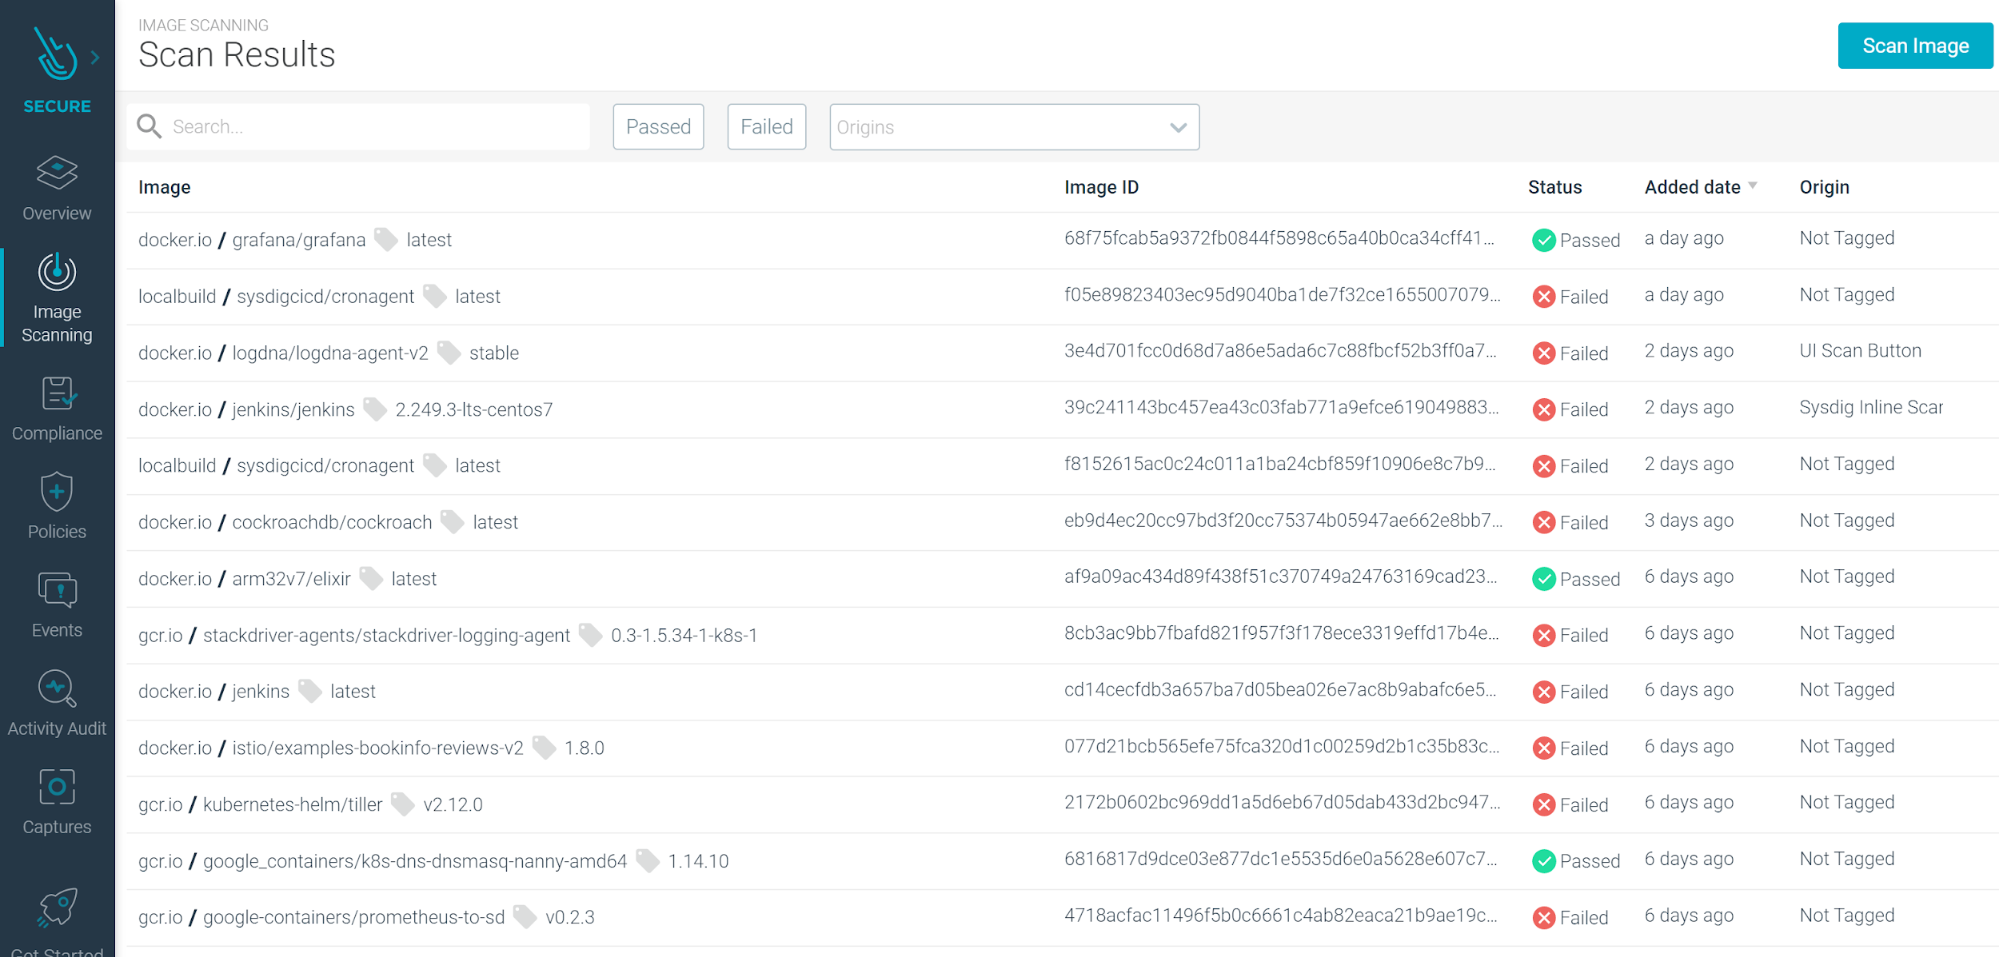
We’re always looking for ways to improve the user experience, and this came from a few discussions with customers. We heard that users wanted to be able to quickly see things like the image source, how an image was scanned, and then easily filter as they scale and start protecting hundreds and thousands of container images. The UI for the list of scanned images has been updated to include several functionality and design improvements:
- Status column (Passed or Failed) is now filterable.
- Image Origin (Inline Scanner, Node image analyzer, etc.) is now visible, filterable, and has a multi-select option.
- Image registry is now visible on the table.
- Ability to sort by date-added (default) or image name.
- Flexible free-text search: filter by registry/repo:tag, repo:tag, repo, etc.
See also: Review Scan Results.
How customers are using this feature
We hear from our customers that this feature is a great way to get a quick overview of what has been scanned, and how it has been scanned. With the various methods of image scanning within the Sysdig platform, our customers have said it is sometimes unclear how their users are using and integrating with Sysdig. This update to scan results is a great way to audit that, and also to validate that everything is indeed being scanned in the most optimal way.
A few of our customers also have tight controls around which container image repositories their teams are allowed to use, so this is a great way to get a quick overview to ensure images are coming from the right places and that their deployment rules are set up correctly.
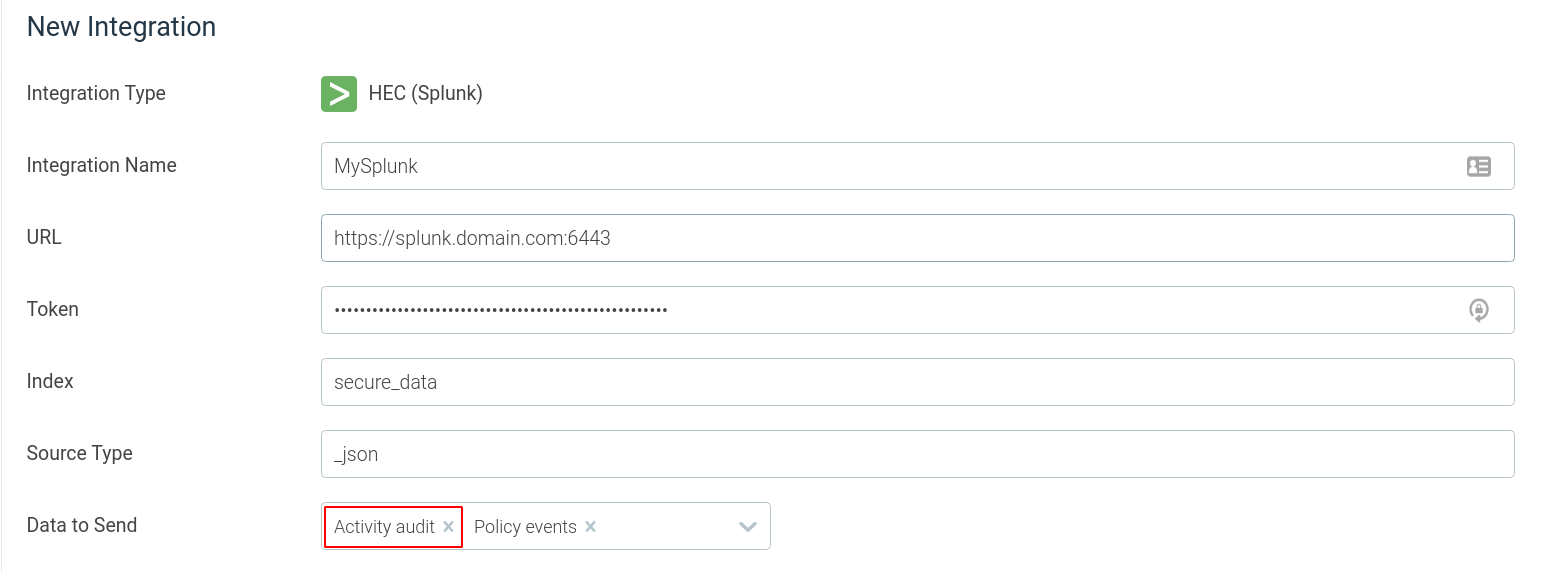
Forwarding activity audit information
The Sysdig Secure Event Forwarder has added support to forward Activity Audit data to external platforms. As we’ve covered before, the Activity Audit is really important for a number of compliance requirements that demand full audit logs. The Sysdig activity audit collates the activity within a container (which will be identified against the container user) against authenticated actions requested via the Kubernetes-API. This gives much more detailed audit records than what would be available normally.
How customers are using this feature
Many of our customers are using this feture to get the Sysdig activity audit into their SIEM. They are using this for compliance purposes, but it’s also a great way to then correlate user activity and actions across different systems. Our customers are using this to record and show more complete activity across all of their systems.
Benchmarks support upgraded
kube-bench was upgraded to v1.6, which includes various feature coverage for the below benchmark areas. Using the Kubernetes benchmark, we now provide customer-selected benchmark checks for GKE and EKS (rather than just the Kubernetes default).
- Kubernetes Benchmark 1.6: Control Plane, Node, etcd, Policies.
- Google Kubernetes Engine (GKE) Benchmark 1.0: Control plane, Node, etcd, Policies, Managed services.
- Amazon Elastic Kubernetes Service (EKS) Benchmark 1.0: Control plane, Node, Policies, Managed services.
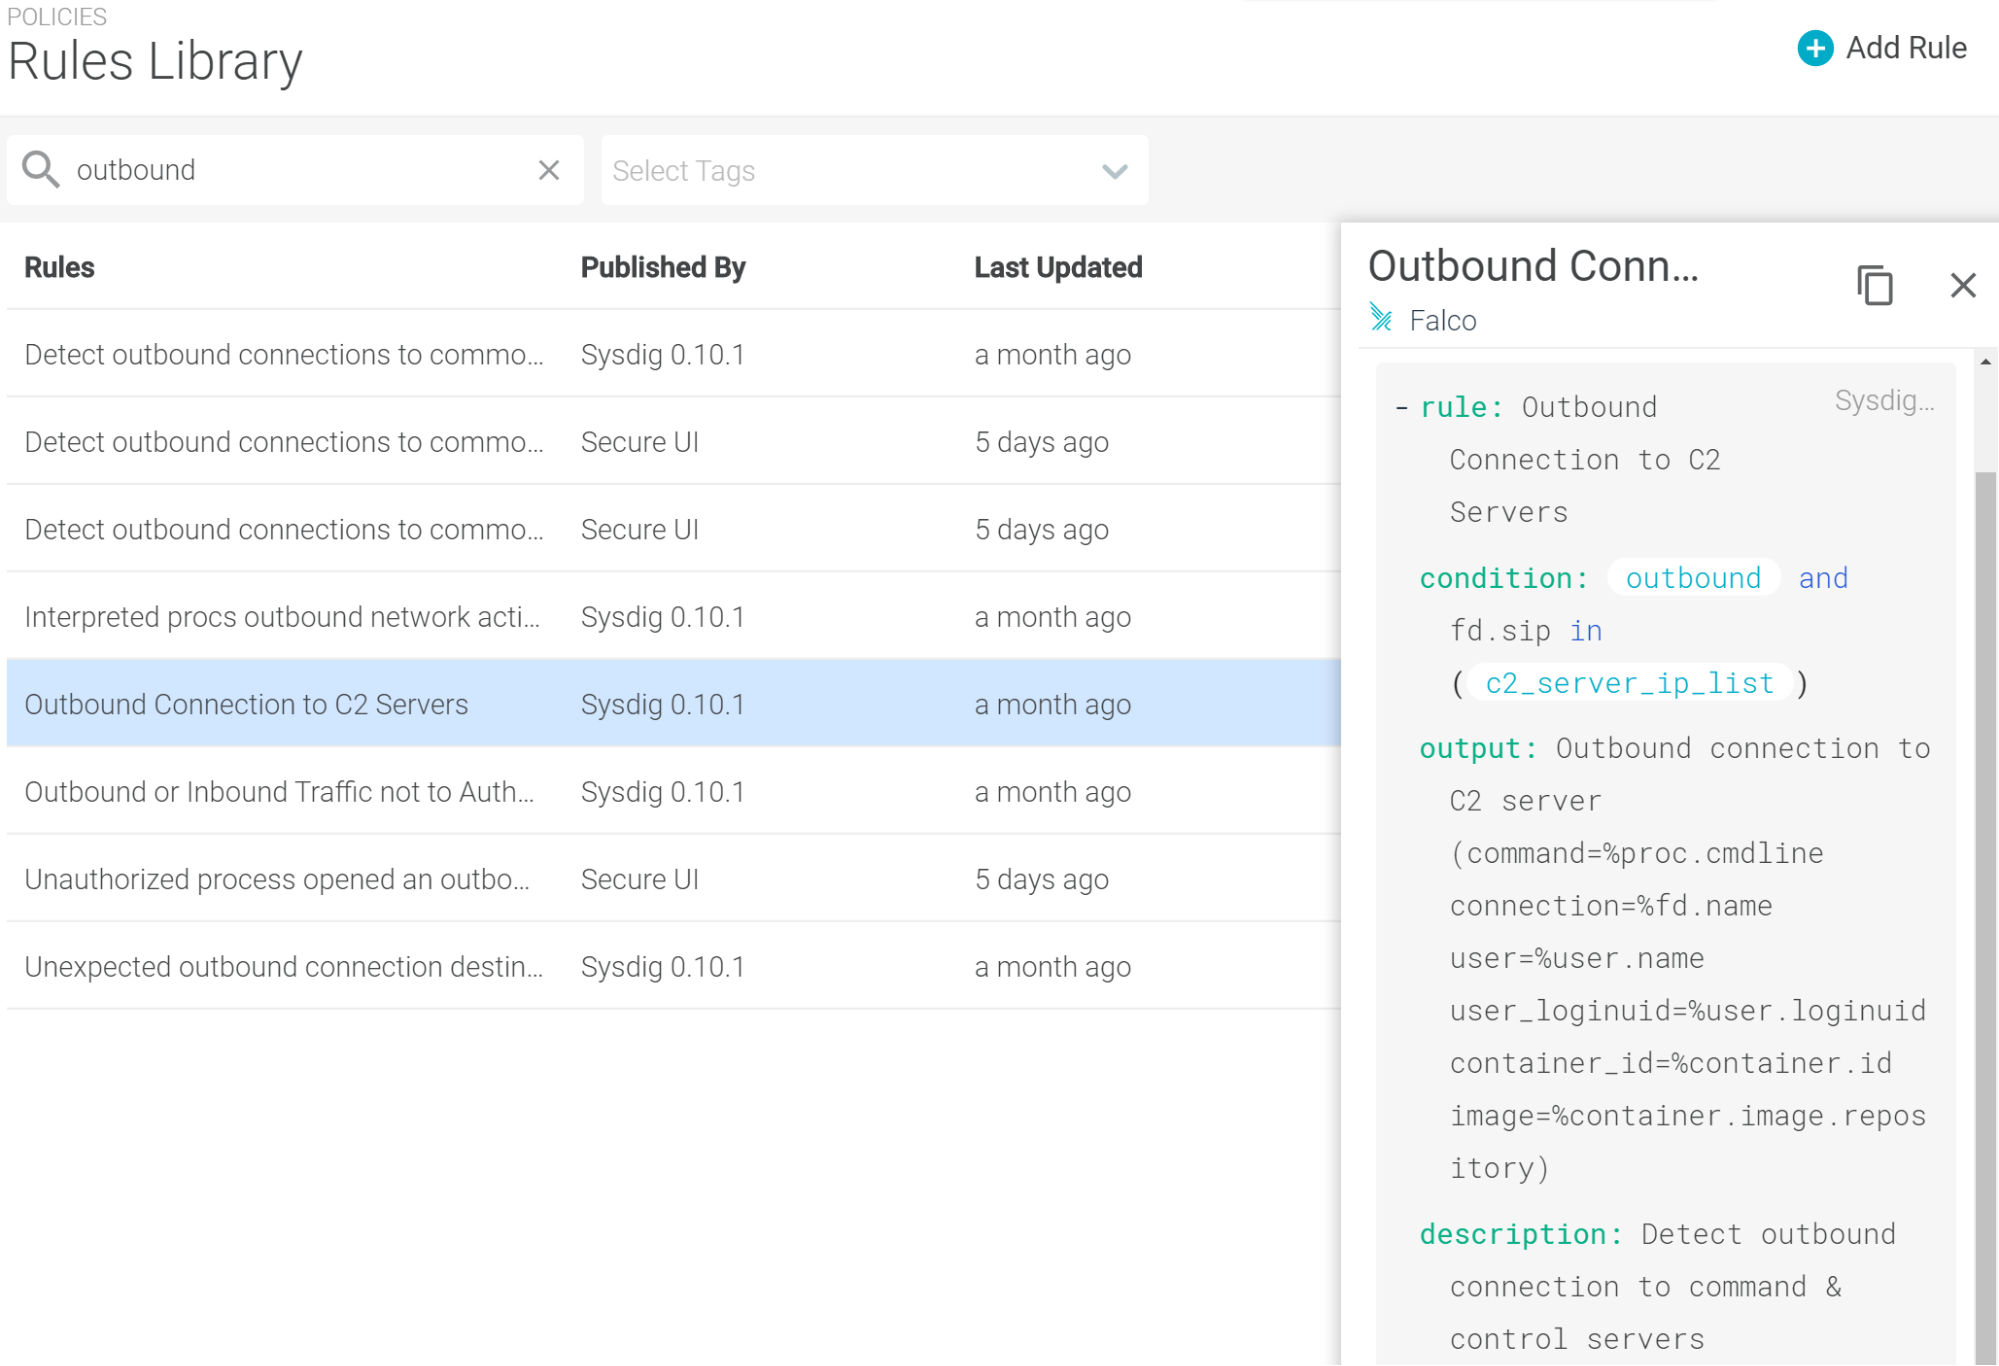
Falco rules updates
The latest version of the Falco rules is ‘Sysdig 0.10.1’.
- Add
CSRFtoken protection.
Rule changes
- Add a new rule, Outbound Connection to C2 (Command and Control) Servers, to the Disallowed Network Activity policy.
Shortly, we’ll also be releasing a large number of rules for CloudTrail support. Actually, too many rules to include all the details here. As always, to make this easy to use, we’ve tagged the different rules so you can quickly sort through and work out which tags are relevant to you. As expected, many of the policies are mapped to the common control requirements in compliance standards like PCI, CIS, the different NIST policies, and the MITRE ATT&CK framework, of course.
The high level MITRE tags are as follows:
- Initial Access
- Exploit public facing applications.
- Valid accounts.
- Persistence
- Redundant access.
- Create an account.
- Resource hijacking.
- Defence Evasion
- Disabling security controls.
- Indicator removal on host.
- Indicator removal from tools.
- Credential Access
- Brute force.
- Steal application access token.
- Discovery
- File and directory discovery.
- Collection
- Data from cloud storage objects.
- Exfiltration
- Transfer data to cloud account.
- Impact
- Store data manipulation.
- Data destruction.
- Account access removal.
- Service stop.
Sysdig Monitor
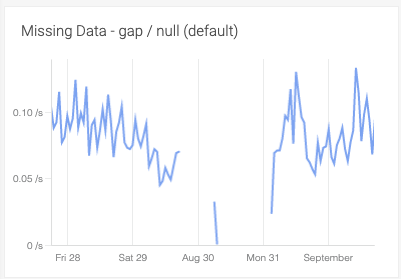
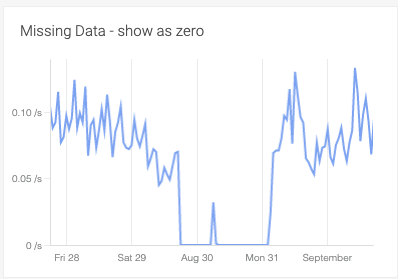
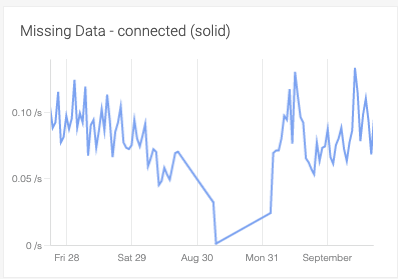
Visualizing missing data in dashboards
Dashboards now show null or missing data values as gaps instead of zero. Optionally, missing data can be displayed as a dotted or solid line in both Form-based and PromQL panels. StatsD metrics will continue to show null values as zero unless overridden by the settings.
For more information, see Display Missing Data.
How customers are using this feature
This is useful when you have sporadic metrics, such as batch jobs. We’re seeing our customers use this for visualizing and reporting during the actual processing time of these intermittent jobs.
Explore workflow enhancements
The Explore interface has been improved to allow faster troubleshooting. You are now launched directly into the drill-down view when you navigate to Explore. You will still be able to group and navigate your infrastructure by using the hierarchical scope tree.

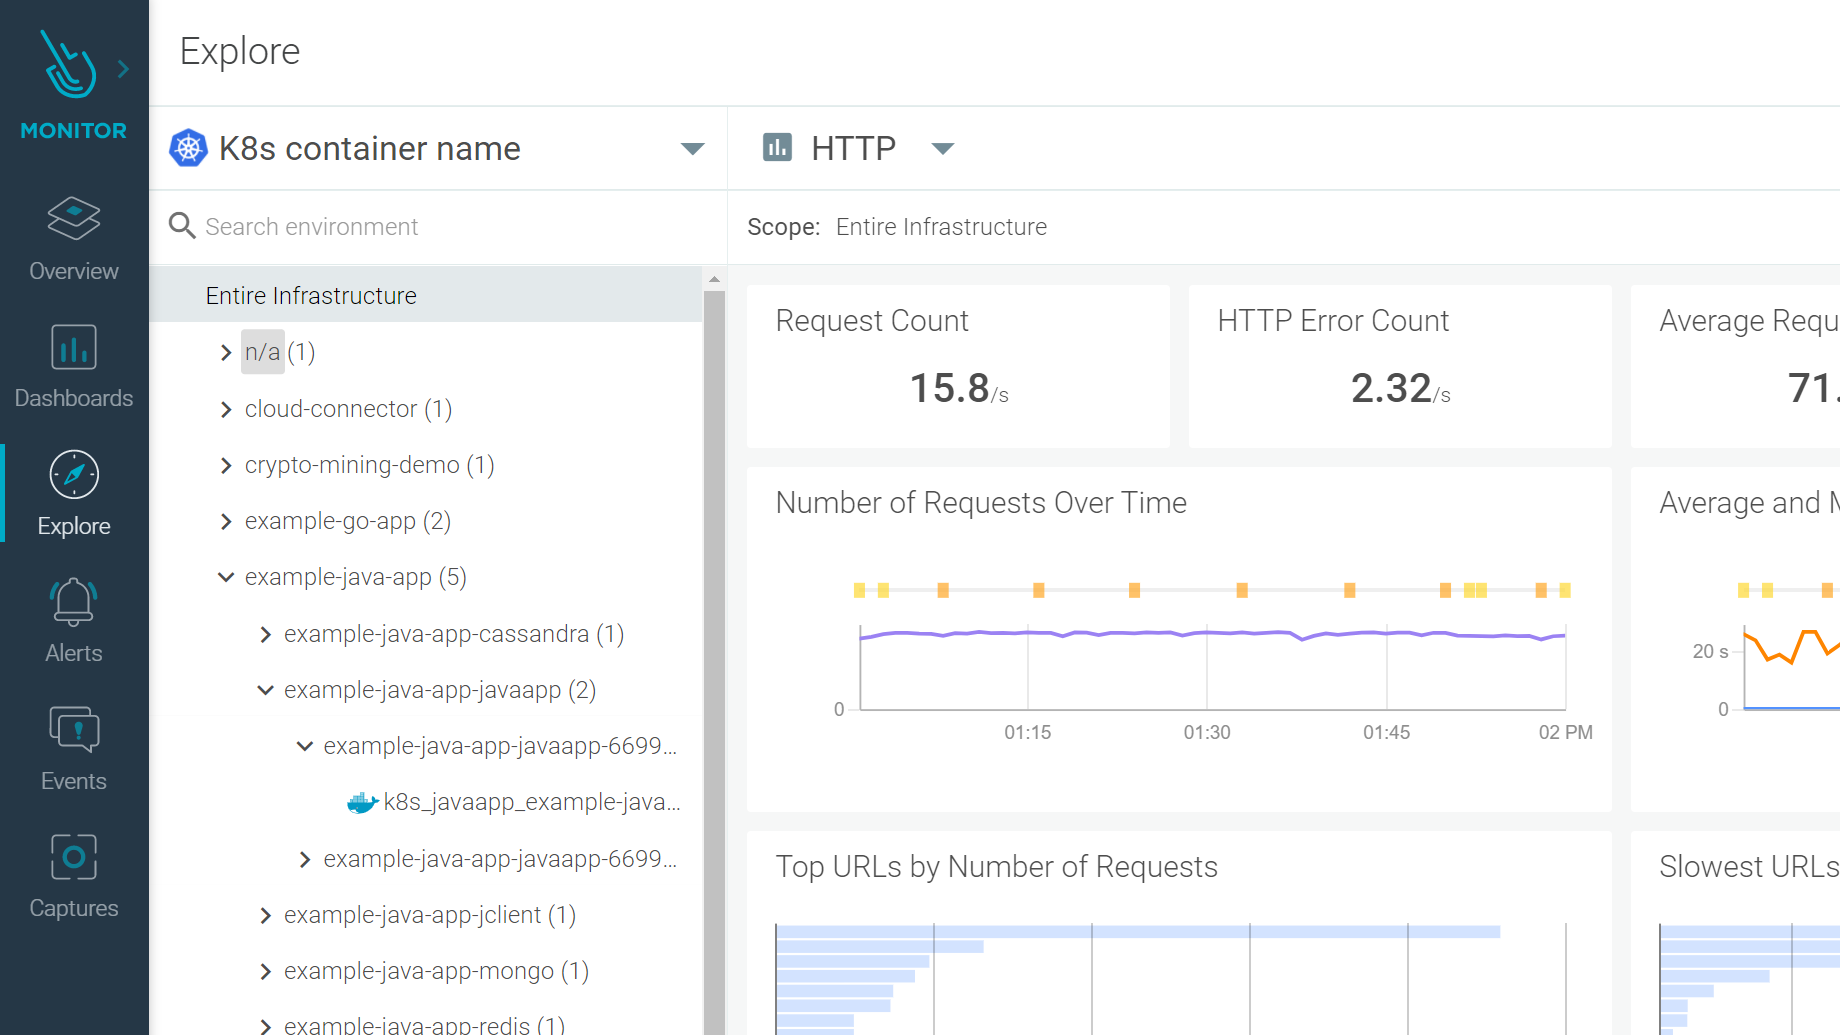
The new Grouping editor helps you create and manage your infrastructure groupings.
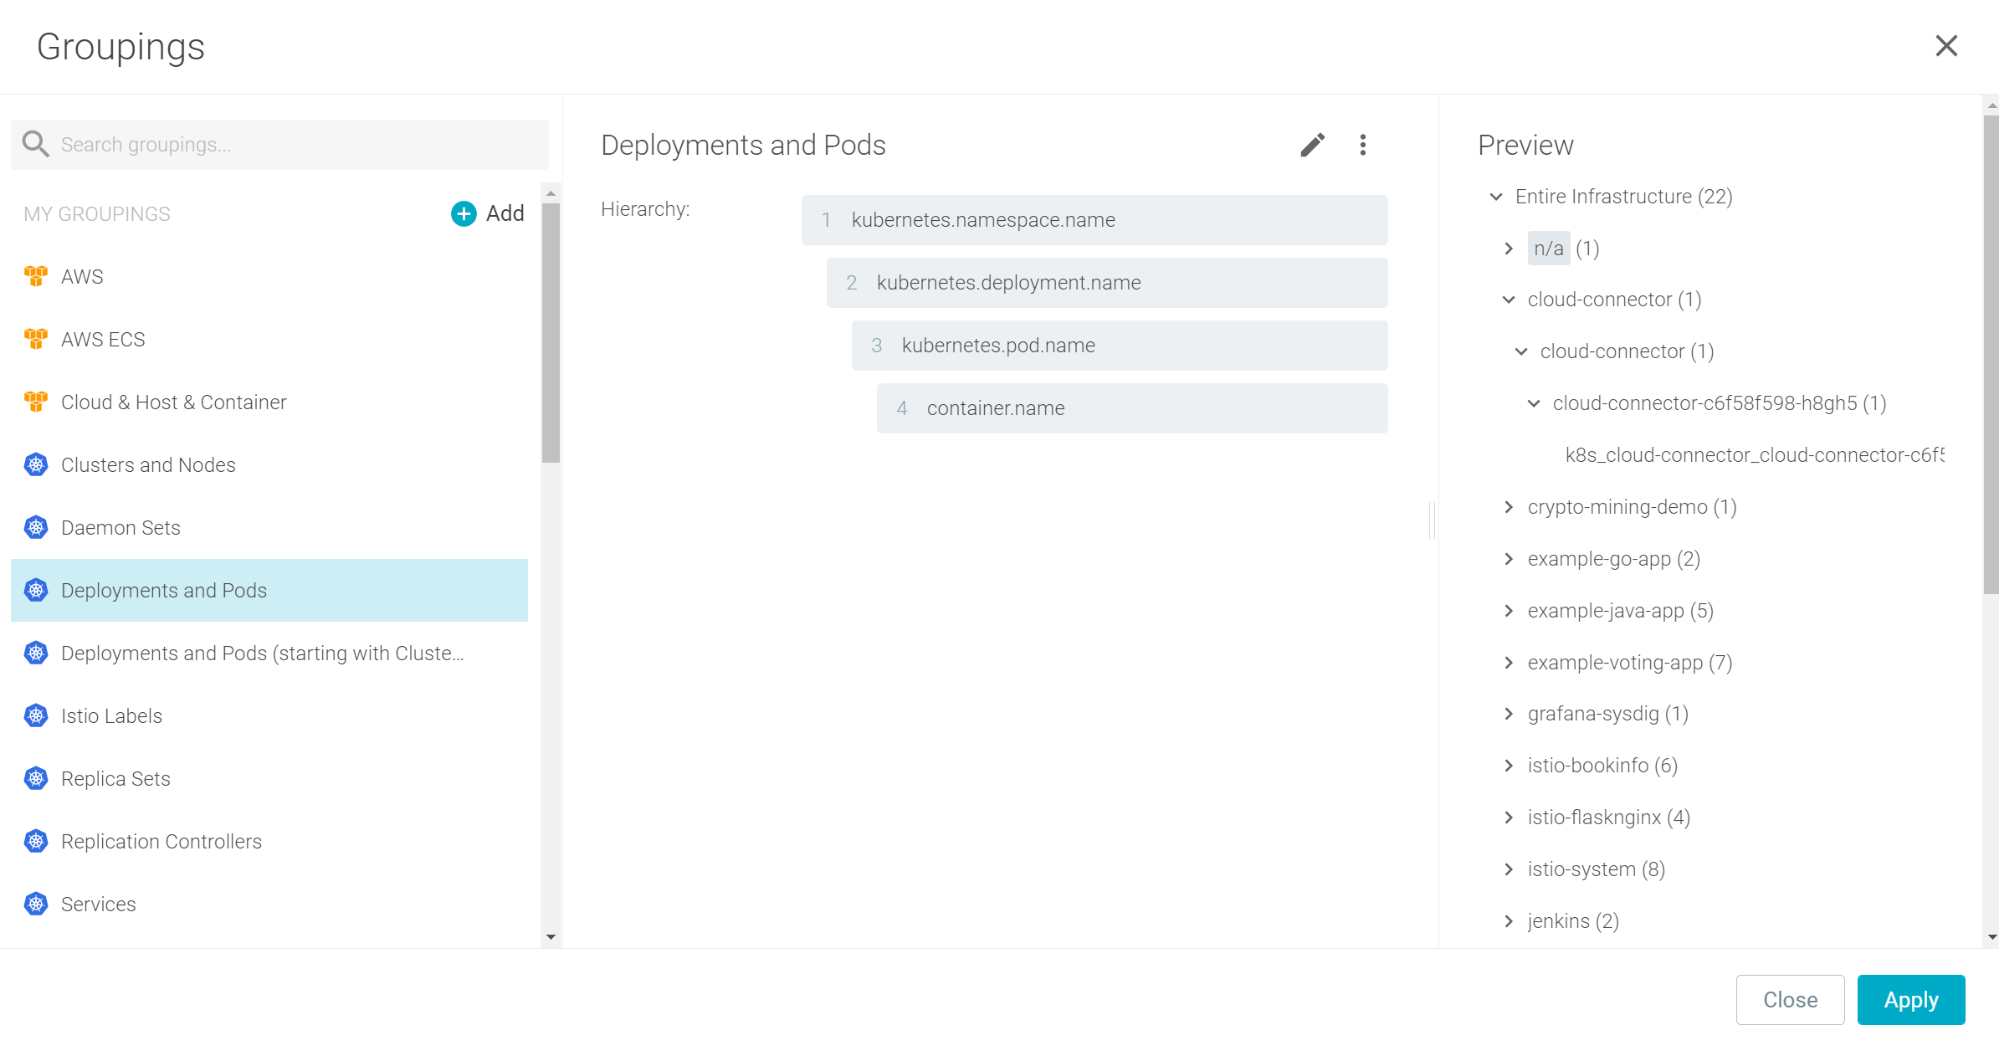
For more information, see Explore Interface.
Transfer dashboard ownership
Administrators now have the ability to transfer dashboard ownership to another user. For more information, see Transfer Dashboard Ownership.
Enhancements for navigating dashboards
You can now pin the dashboard menu to the sidebar in the Sysdig Monitor UI. Pinning makes it easier to navigate and browse different Dashboards. In addition, the Dashboard interface has been enhanced to retain your preference for open or closed categories to help you locate the desired items faster.
Sysdig agents
Sysdig Agent
The latest Sysdig Agent release is 10.6.0. Below is a diff of updates since 10.5.1, which we covered in our last update. As a reminder from the notice last month, there are some important fixes in agent release 10.5 and newer, so we highly recommend upgrading to the latest version if you are running an older release. If you aren’t using :latest, simply edit your daemonset to tag the version you want to upgrade to, reapply the daemonset, and restart the pods.
New features & enhancements
- Python 2.7 has been removed from the agent and agent-slim containers (the Sysdig agent when installed as a service continues to support Python 2.7, so long as the host has Python 2.7). Please be aware that this is a breaking change if you have explicitly defined the
python_binaryconfiguration option to point to/usr/bin/python2.7. To prevent breaking the setup, do one of the following:- Remove the
python_binaryconfiguration option. - Set
python_binaryto/usr/bin/python3.
- Remove the
- kube-bench has been updated. For details of what is included, please see the Secure section.
- Configuring Prometheus Metric Expiration Time – Configuring metric expiration time is supported by
promscrape.v2for Prometheus metrics gathered by using Prometheus service discovery. - Support for Scoping Policies by Kubernetes Cluster Name – Add support for scoping policies by
kubernetes.cluster.name. The cluster name must still be manually configured by using the configuration option,k8s_cluster_name: <CLUSTER NAME>. - Improved Prometheus Service Discovery – Made Kubernetes node matching more reliable for Prometheus Service Discovery by comparing IP addresses as opposed to node names in the default configuration.
Fixes
- CVE Fixes – Addressed a known vulnerability in the
jackson-databindpackage version 2.9.10.6 by upgrading to version 2.11.3 in agent containers. - Reduce Severity of NoClassDefFoundError Log from Error to Info – Changed the java
NoClassDefFoundErrorclass from Error to Info to reduce spamming the logs at the Error level. This happens commonly when the agent attempts to read metrics from a java v11 application which was not started with thecom.sun.management.jmxremoteoption. - StatsD Metrics No Longer Show Larger Than Expected Values – Fixed a problem that caused StatsD metrics to be double the expected value.
- Remove Warning Logs – Removed warning logs about ambiguous source labels when using the Prometheus service discovery with multi-container pods.
- Memory Leak No Longer Occurs in the Agent – Fixed an issue that could potentially cause a slow increase in the agent’s memory usage over time when the
thin_cointerface_enabledconfiguration option is enabled.
Helm Chart
The Helm Chart 1.10.4 has been released to support Agent 10.6.
This also includes a previous update:
- Add a nodeSelector value to schedule the Agent.
Check all of our charts.
Node image analyzer
Versions 0.1.5 and 0.1.6 were released this month with the following updates:
- Enabled proxy support.
- Fixes an issue that prevented the analyzer from starting when trying to use a proxy with OCP 4 and containerd based deployments.
- Improvement that makes it possible to scan tagless images on the environment (scanned images that were tagless will now show up in the Scan Results page with a special tag, which is the truncated digest. For previous on-premises setups, this may however just show as “latest” or “null”).
- Upgraded dependencies to keep up with latest functionality and security fixes.
Node image analyzer can be installed as part of the Sysdig Agent install.
Inline scanning engine
A new version of the Sysdig inline scanner script has been released.
Major improvements:
- The inline analysis container doesn’t need to spawn any additional containers
- This removes the requirement for the Docker client, docker-in-docker, etc.
- This enables usage in environments where docker-in-docker is not feasible or hard to instrument (e.g., Tekton).
- Additional analysis workflows and formats:
- Added support to analyze a docker archive.
- A .tar.gz file containing the image, i.e. the output from a “docker save”.
- Added support to analyze OCI images (both and directory and archive).
- Uncompressed or compressed OCI image format.
- Added support to retrieve an image from the container storage (CRI-O and others).
- Examples provided here.
- Added support to analyze a docker archive.
Additional improvements:
- Faster image ingestion.
- More verbose logs available for troubleshooting and diagnosis.
- Machine-readable JSON output via –format JSON command.
To upgrade an earlier Sysdig Inline Scanning version to 2.0, you need to take into account the new invocation parameters, which are not backwards compatible.
Sysdig Inline scanner can be used stand-alone or as a step inside a CI/CD pipeline (Jenkins, Tekton, CircleCI, etc.). In the upcoming weeks, we will update the different integrations to provide out-of-the-box support for the 2.0 version.
SDK, CLI and tools
Sysdig CLI
v0.6.6 was released and includes the following updates:
Features
- Add support for events v2 and maintain compatibility with v1 via new endpoint
- Allow filtering events v2 by time
- Define event list limit as integer
- Display the event source correctly
- Correct range for severity
- Update event documentation
- Use same theme than other SysdigLabs projects
Documentation fixes
- Remove description from site in the docs
- Events documentation
Python SDK
v0.14.4 was released and includes the following updates:
get_dashboardsnow can retrieve the full information of all the dashboards.- The previous version of the
get_dashboardsmethod was only able to retrieve partial information from the dashboards. The current one allows you to disable the “light” mode.
- The previous version of the
- Deprecate
list_whitelisted_cvesmethod. The method has been replaced by:list_vulnerability_exception_bundlesto retrieve the exception bundles.get_vulnerability_exception_bundleto retrieve all the info from an exception bundle.
- Allow filtering events v2 by time.
Terraform provider
v0.5.4 was released. Below is a diff from v0.5.0, which was covered in our last update:
sysdig_secure_policynow supports killing the container.- Allow severity values 1, 2, 3, and 5 in Policies.
- Allow minimal configuration while appending to Falco rule.
- Add support for appending rules.
- Added GH Code Scan action.
- Updated documentation with new resources in the main webpage.
Falco VS code extension
This isn’t limited to our commercial products, but it’s an exciting new tool nonetheless. I know many of our commercial customers will make use of this when writing or modifying their own Falco runtime rules.
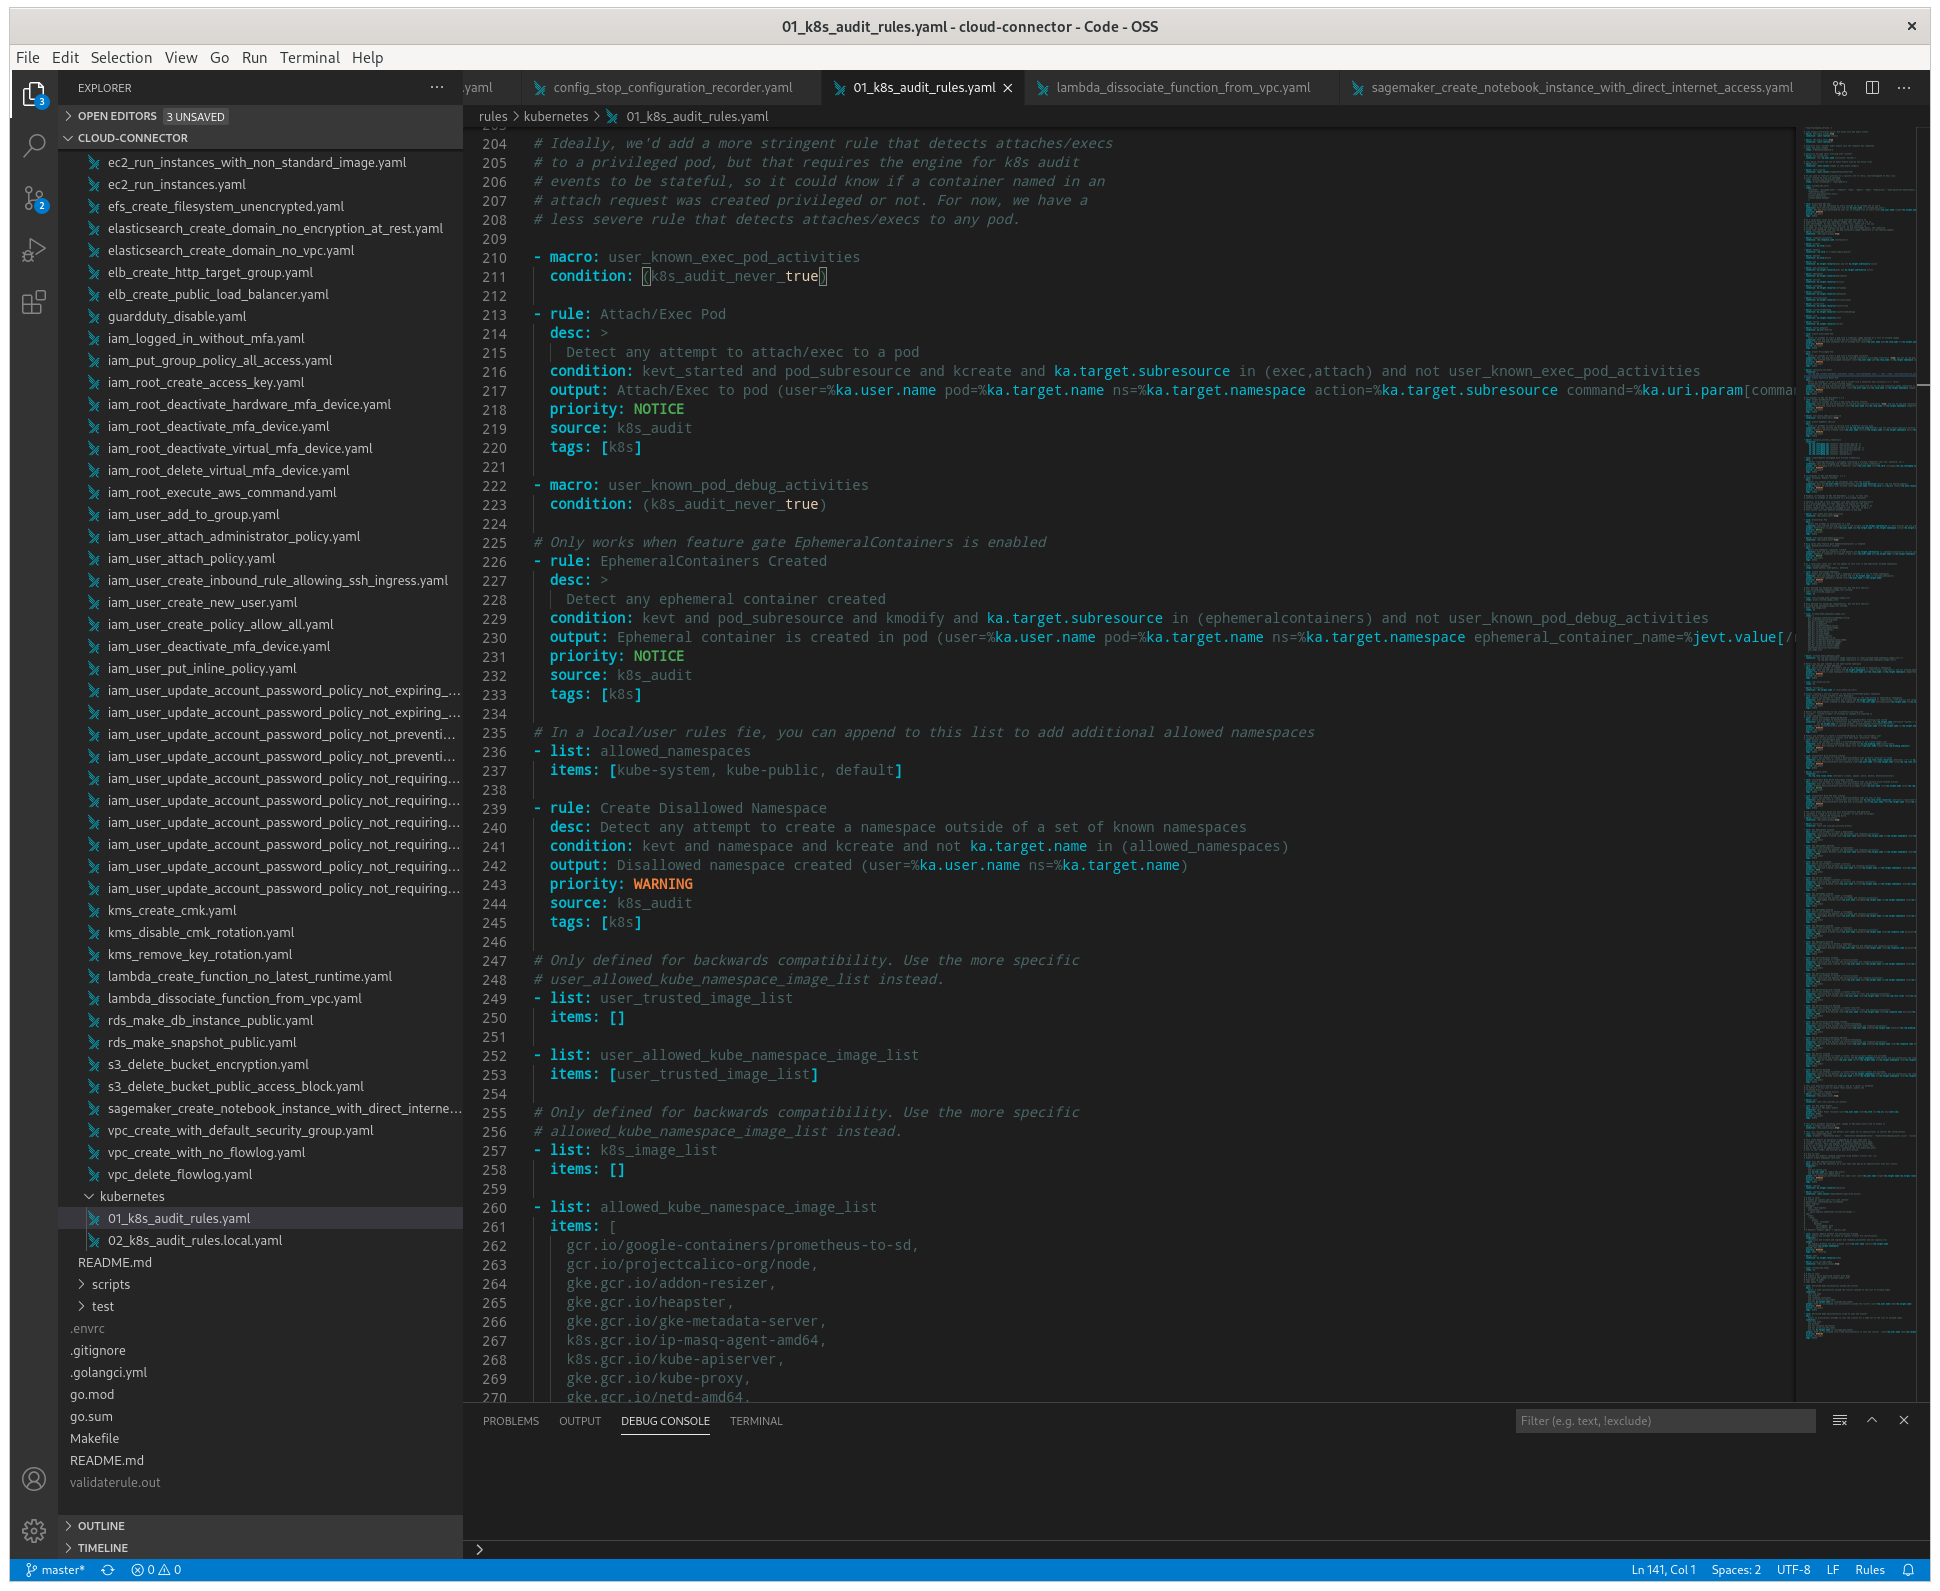
The first release includes:
- Intellisense / Autocompletion for jevt.* and ka.* fields.
- Snippets for new rules, macros, and lists.
- Syntax highlighting for fields in rules (e.g., critical rules appears in red color, warn appears in orange, etc.).
- Rule validation using a VSCode command.
- File icon with Falco logo on rules.
Sysdig cloud connector
Last month, we announced the release of CloudTrail support in runtime security. To enable the ingestion of these events, we need a connector, which we forgot to feature last month (my sincerest apologies!).
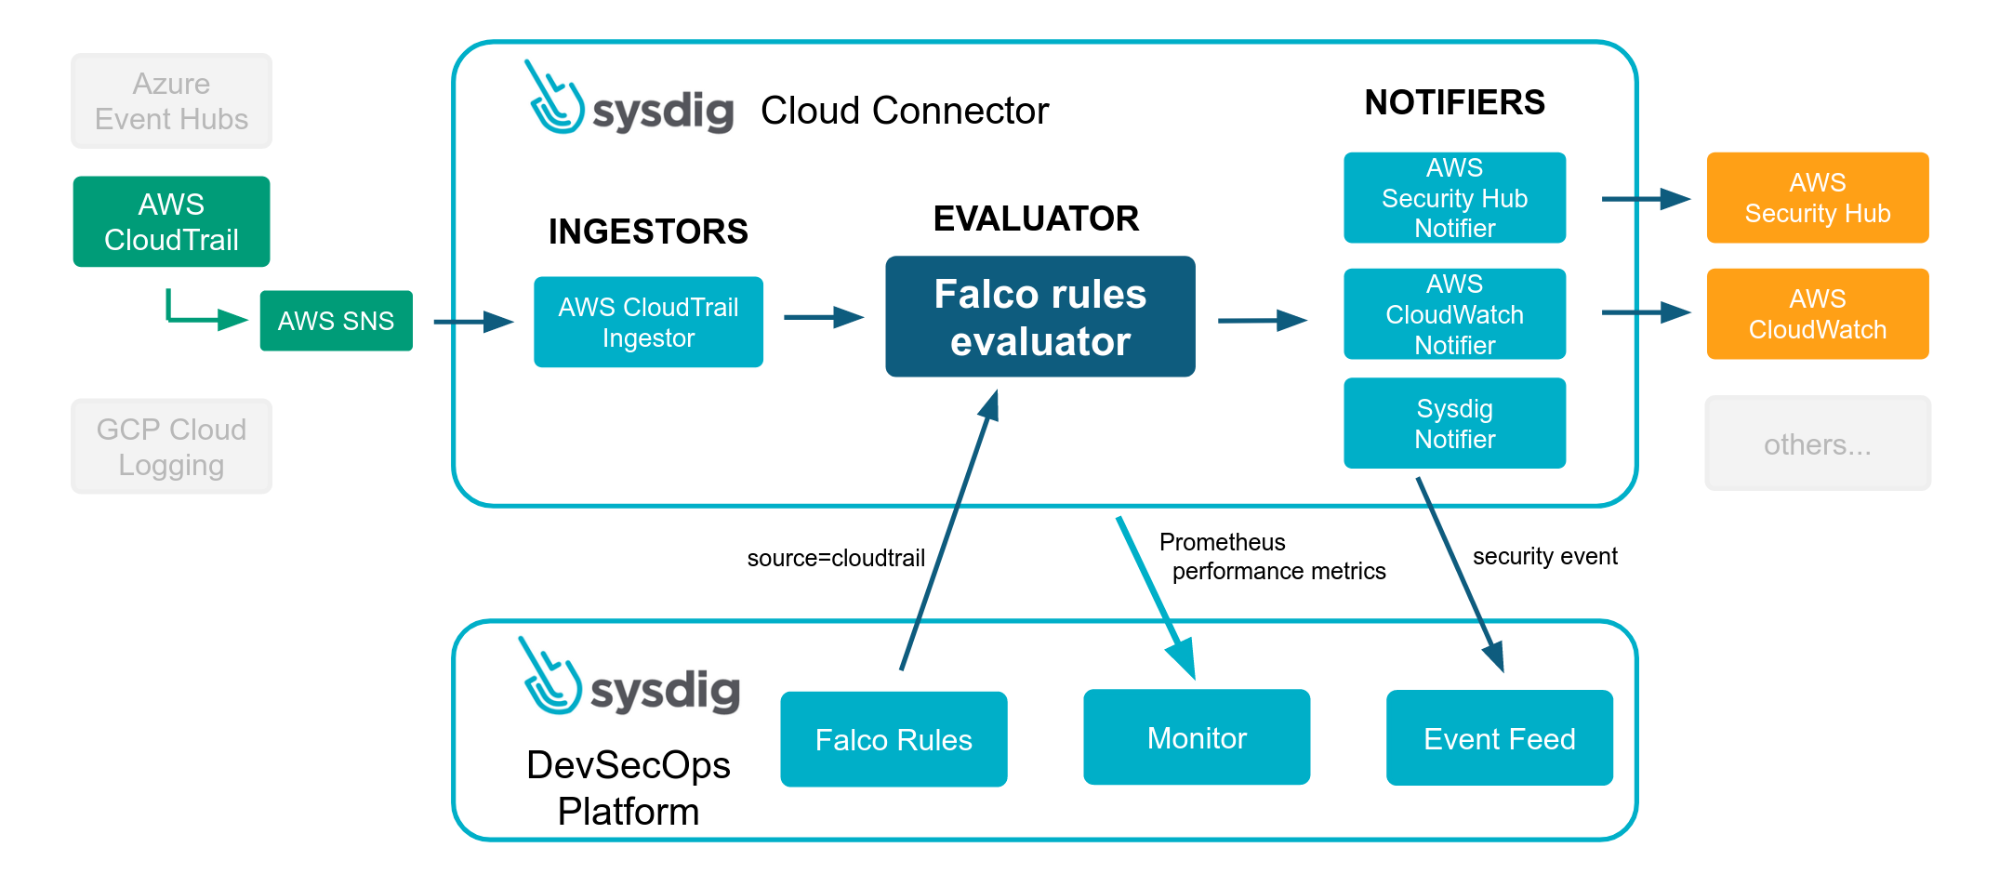
v0.3.0 was released this month and includes the following new rules:
- Add a git rule provider.
- Add S3 rule provider.
- Add K8s audit log support.
- Add EKS ingestor.
- Allow loading rules from more than one rule provider.
- Allow to have more than one ingestor of the same type.
- Add new rules for CMK, GuardDuty, Lambda, RDS, SageMaker, and S3.
- Add new rules for IAM, EBS, DMS, and detecting SSH traffic.
- Add new rules for CMK, GuardDuty, Lambda, RDS, SageMaker, S3, and IAM.
- Add new rules for IAM, CloudTrail, and ElasticSearch.
- Added EFS encryption rule.
- Added VPC Flowlog rules.
- Add rules for Autoscaling.
- Add EBS encryption rule.
- Add rules for Lambda functions.
- Implement a CloudTrail SQS ingestor.
- Enrich EKS events.
- Added tags for NIST, AWS CIS, PCI, and FSBP.
- Manage cloud-connector configuration using an s3 bucket.
- Release a new CSIRT set of rules for AWS.
- Tag new rules with Mitre Att&ck tactic / technique sections.
- Allow to enable / disable rules when combining sources of new rules (s3, git, etc.).
PromCat resources
Just a reminder, PromCat.io is a curated set of Prometheus exporters that Sysdig will provide full support for to our customers. It is publicly available, so everyone can still make use of it, although we won’t be able to offer the official support that our customers receive.
The following new Prometheus exporters have been added to the website:
- HAProxy ingress router for OpenShift.
We also made the following enhancements:
- Added authentication documentation in MongoDB.
- Several upgrades in UX.
- Fixed wrong version in installation instruction.
- Improved documentation for Istio, Kubernetes, and OpenShift exporters.
- Fixed Sysdig Windows dashboard.
- Fixed bug in alert in AWS SQS.
Deprecation notices
- None to announce this month!
New website resources
Blogs
- Understanding and mitigating CVE-2020-8566: Ceph cluster admin credentials leaks in kube-controller-manager log
- SOC 2 compliance for containers and Kubernetes security
- How to monitor coreDNS
- How to monitor Kubernetes control plane
- NIST 800-53 compliance for containers and Kubernetes
- Understanding and mitigating CVE-2020-8563: vSphere credentials leak in the cloud-controller-manager log
- How to monitor kube-proxy
- K3s + Sysdig: Deploying and securing your cluster… in less than 8 minutes!
- Sysdig extends image scanning to Google Cloud’s Artifact Registry
- Container security on IBM Cloud
- Kubernetes-native network security with Sysdig
- Securing Kubernetes clusters with Sysdig and Red Hat Advanced Cluster Management
- Zoom into Kinsing
Webinars
- Cards Against Containers for a Holiday Cause
- Zero Trust Network Security for Containers and Kubernetes
- Solving Kubernetes security issues using Red Hat OpenShift & Sysdig
- NIST 800-53 Compliance in Containers & Kubernetes
- Sysdig: Governance Risk and Compliance in a Cloud Native world – How to Monitor & Secure your Containers
- So Many Metrics, So Little Time: 5 Prometheus Exporter Best Practices
- Exploring Kubernetes 1.19: Highlights & hands-on demos from Alex Ellis
- AWS Partner Roundtable: Episode 1
- Simplify Kubernetes security and operations with IBM and Sysdig
Case studies