


Falco Feeds extends the power of Falco by giving open source-focused companies access to expert-written rules that are continuously updated as new threats are discovered.

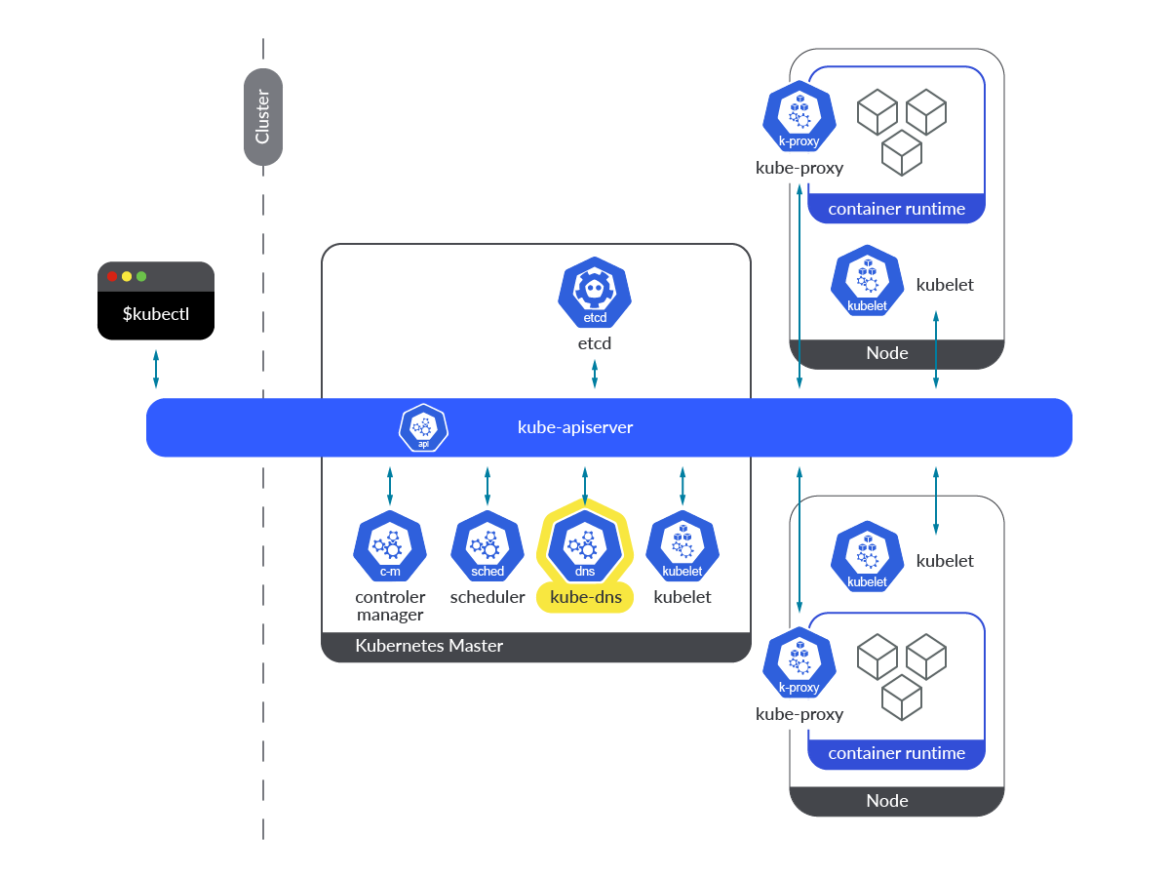
CoreDNS is a DNS add-on for Kubernetes environments. It is one of the components running in the control plane nodes, and having it fully operational and responsive is key for the proper functioning of Kubernetes clusters. Learning how to monitor CoreDNS, and what its most important metrics are, is a must for operations teams.
At some point in your career, you may have heard: Why is it always DNS?
Well, it is simple. DNS is one of the most sensitive and important services in every architecture. Applications, microservices, services, hosts… Nowadays, everything is interconnected, and this doesn't necessarily mean internal services. It can also be applied to external services. DNS is responsible for resolving the domain names and for facilitating IPs of either internal or external services, and Pods. Maintaining the Pods DNS records is a critical task, especially when it comes to ephemeral Pods, where IP addresses can change at any moment without warning.
But what happens when DNS is unresponsive or down? You are in serious trouble.
If you are running your workloads in Kubernetes, and you don't know how to monitor CoreDNS, keep reading and discover how to use Prometheus to scrape CoreDNS metrics, which of these you should check, and what they mean.
In this article, we will cover the following topics:
- What is the Kubernetes CoreDNS?
- How to monitor CoreDNS in Kubernetes?
- Monitoring the Kubernetes CoreDNS: Which metrics should you check?
- Conclusion
What is the Kubernetes CoreDNS?
Starting in Kubernetes 1.11, and just after reaching General Availability (GA) for DNS-based service discovery, CoreDNS was introduced as an alternative to the kube-dns add-on, which had been the de facto DNS engine for Kubernetes clusters so far. As its name suggests, CoreDNS is a DNS service written in Go, widely adopted because of its flexibility.
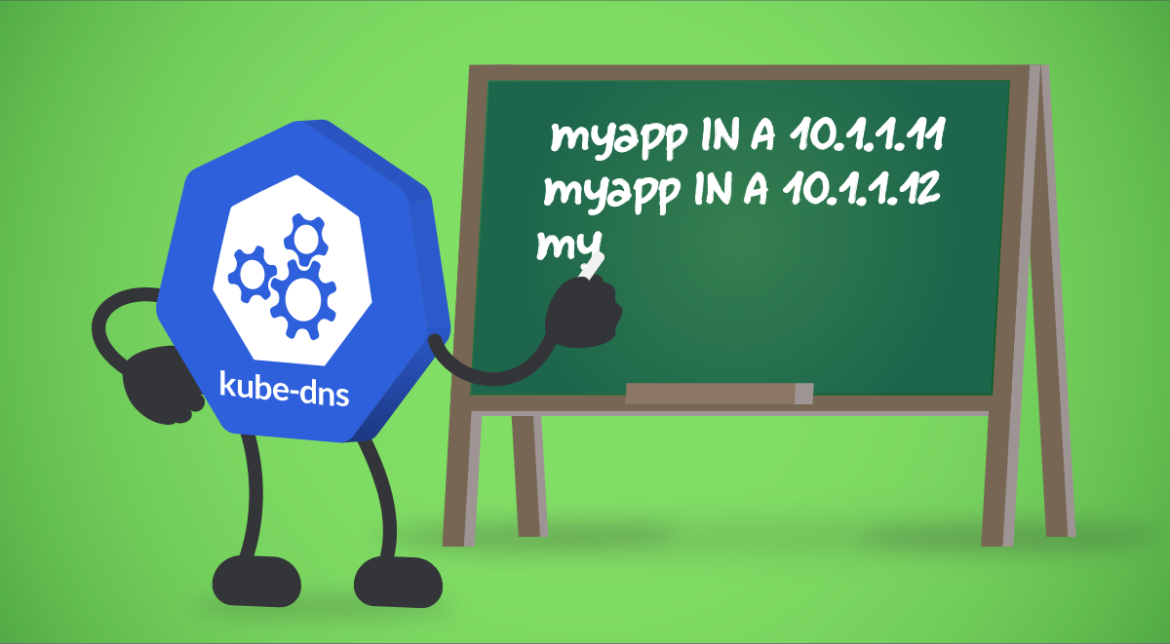
When it comes to the kube-dns add-on, it provides the whole DNS functionality in the form of three different containers within a single pod: kubedns, dnsmasq, and sidecar. Let's take a look at these three containers:
kubedns: It's a SkyDNS implementation for Kubernetes. It is responsible for DNS resolution within the Kubernetes cluster. It watches the Kubernetes API and serves the appropriate DNS records.dnsmasq: It provides a DNS caching mechanism for SkyDNS resolution requests.sidecar: This container exports metrics and performs healthchecks on the DNS service.
Let's now talk about CoreDNS!
CoreDNS came to solve some of the problems that kube-dns brought at that time. Dnsmasq introduced some security vulnerabilities issues that led to the need for Kubernetes security patches in the past. In addition, CoreDNS provides all its functionality in a single container instead of the three needed in kube-dns, resolving some other issues with stub domains for external services in kube-dns.
CoreDNS exposes its metrics endpoint on the 9153 port, and it is accessible either from a Pod in the SDN network or from the host node network.
You already know what CoreDNS is and the problems that have already been solved. It's time to dig deeper into how to get CoreDNS metrics, and how to configure a Prometheus instance to start scraping its metrics. Let's get started!
How to monitor CoreDNS in Kubernetes?
As you have just seen in the previous section, CoreDNS is already instrumented and exposes its own /metrics endpoint on the port 9153 in every CoreDNS Pod. Accessing this /metrics endpoint is easy – just run curl and start pulling the CoreDNS metrics right away!
Getting access to the endpoint manually
Once you know which are the endpoints or the IPs where CoreDNS is running, try to access the 9153 port.
You can also access the /metrics endpoint through the CoreDNS Kubernetes service exposed by default in your Kubernetes cluster.
How to configure Prometheus to scrape CoreDNS metrics
Prometheus provides a set of roles to start discovering targets and scrape metrics from multiple sources like Pods, Kubernetes nodes, and Kubernetes services, among others. When it comes to scraping metrics from the CoreDNS service embedded in your Kubernetes cluster, you only need to configure your prometheus.yml file with the proper configuration. This time, the endpoints role is the one you should use to discover this target.
Edit the ConfigMap that includes the prometheus.yml config file.
Then, add this configuration snippet under the scrape_configs section.
At this point, after redeploying the Prometheus Pod, you should be able to see the CoreDNS metrics endpoints available in the Prometheus console (go to Status -> Targets).
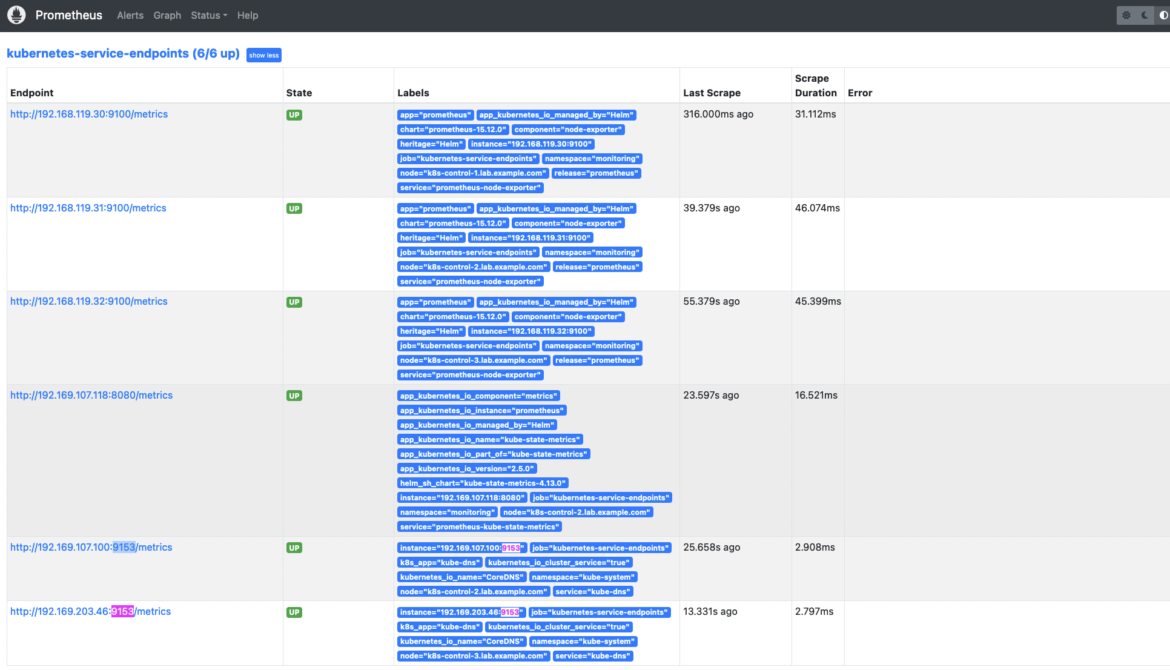
The CoreDNS metrics are available from now on, and accessible from the Prometheus console.
Top CoreDNS metrics: Which ones should you check?
Disclaimer: CoreDNS metrics might differ between Kubernetes versions and platforms. Here, we used Kubernetes 1.25 and CoreDNS 1.9.3. You can check the metrics available for your version in the CoreDNS repo.
First of all, let's talk about the availability. The number of CoreDNS replicas running in your cluster may vary, so it is always a good idea to monitor just in case there is any variation that might affect availability and performance.
- Number of CoreDNS replicas: If you want to monitor the number of CoreDNS replicas running on your Kubernetes environment, you can do that by counting the
coredns_build_info metric. This metric provides information about the CoreDNS build running on such Pods.count(coredns_build_info)
From now on, let's follow the Four Golden Signals approach. In this section, you'll learn how to monitor CoreDNS from that perspective, measuring errors, Latency, Traffic, and Saturation.
Errors
Being able to measure the number of errors in your CoreDNS service is key to getting a better understanding of the health of your Kubernetes cluster, your applications, and services. If any application or internal Kubernetes component gets unexpected error responses from the DNS service, you can run into serious trouble. Watch out for SERVFAIL and REFUSED errors. These could mean problems when resolving names for your Kubernetes internal components and applications.
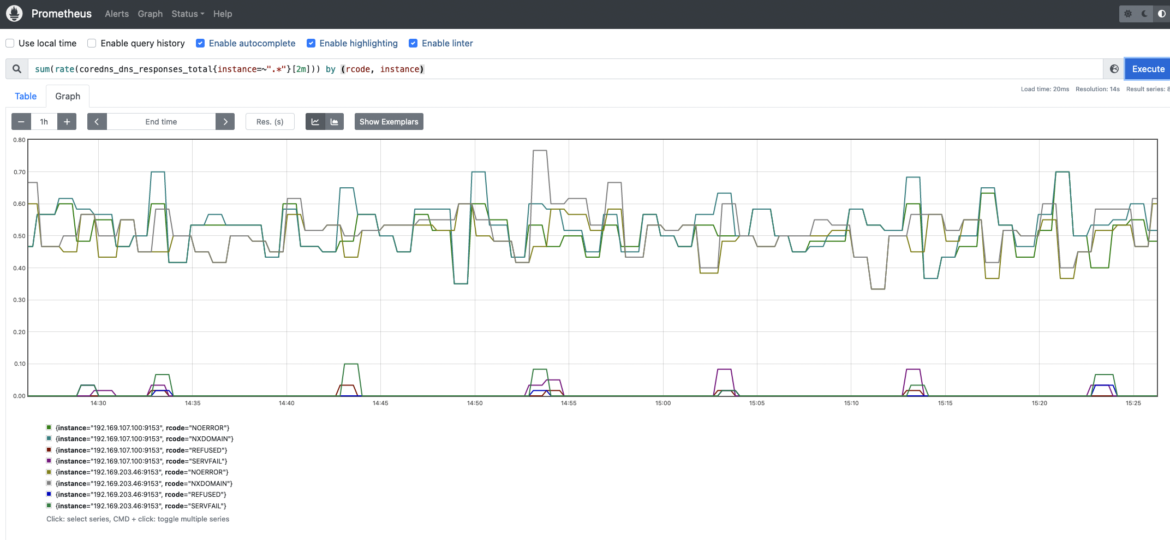
coredns_dns_responses_total: This counter provides information about the number of CoreDNS response codes, namespaces, and CoreDNS instances. You may want to get the rate for each response code. It is always a useful way to measure the error rate in your CoreDNS instances.
sum(rate(coredns_dns_responses_total{instance=~".*"}[2m])) by (rcode, instance)
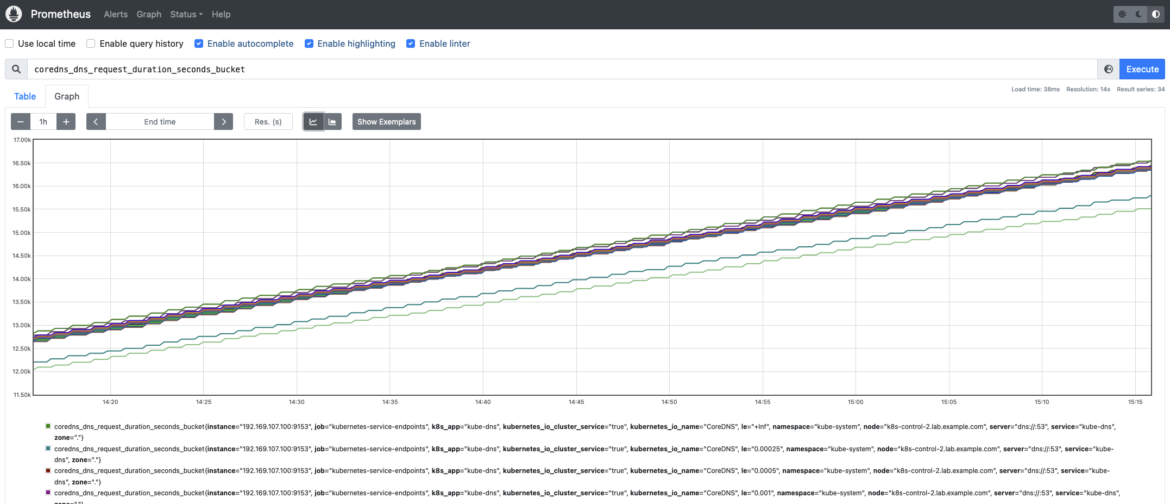
Latency
Measuring latency is key to ensure the DNS service performance is optimal for a proper operation in Kubernetes. If latency is high or is increasing over time, it may indicate a load issue. If CoreDNS instances are overloaded, you may experience issues with DNS name resolution and expect delays, or even outages, in your applications and Kubernetes internal services.
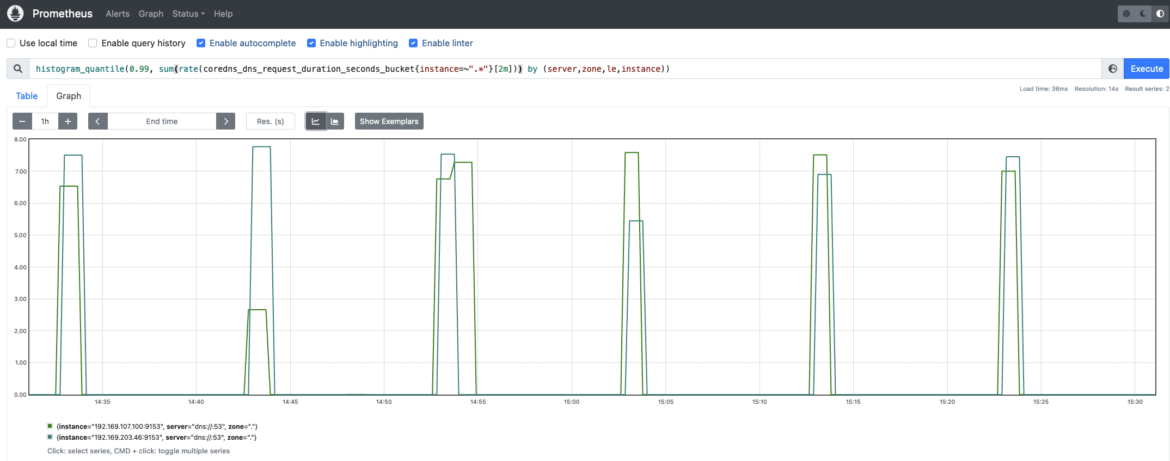
coredns_dns_request_duration_seconds_bucket: CoreDNS requests duration in seconds. You may want to calculate the 99th percentile to see how latencies are distributed among CoreDNS instances.
histogram_quantile(0.99, sum(rate(coredns_dns_request_duration_seconds_bucket{instance=~".*"}[2m])) by (server,zone,le,instance))
Traffic
The amount of traffic or requests the CoreDNS service is handling. Monitoring traffic in CoreDNS is really important and worth checking on a regular basis. Observing whether there is any spike in traffic volume or any trend change is key to guaranteeing a good performance and avoiding problems.
coredns_dns_requests_total: DNS requests counter per zone, protocol, and family. You may want to measure and monitor the rate of CoreDNS requests by type (A, AAAA). "A" stands for ipv4 queries, while "AAAA" are ipv6 queries.

Saturation
You can easily monitor the CoreDNS saturation by using your system resource consumption metrics, like CPU, memory, and network usage for CoreDNS Pods.
Others
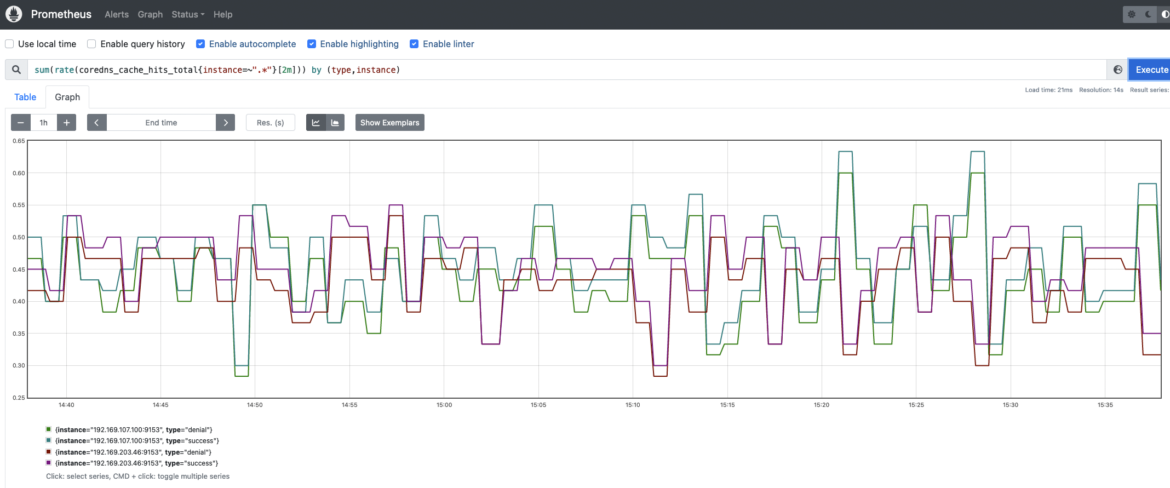
CoreDNS implements a caching mechanism that allows DNS service to cache records for up to 3600s. This cache can significantly reduce the CoreDNS load and improve performance.
coredns_cache_hits_total: A cache hits counter. You may want to monitor the cache hit rate by running the following query. Thanks to this PromQL query you can easily monitor denial and success rates for CoreDNS cache hits.
Conclusion
Along with kube-dns, CoreDNS is one of the choices available to implement the DNS service in your Kubernetes environments. DNS is mandatory for a proper functioning of Kubernetes clusters, and CoreDNS has been the preferred choice for many people because of its flexibility and the number of issues it solves compared to kube-dns.
If you want to ensure your Kubernetes infrastructure is healthy and working properly, you must permanently check your DNS service. It is key to ensure a proper operation in every application, operating system, IT architecture, or cloud environment.
In this article, you have learned how to pull the CoreDNS metrics and how to configure your own Prometheus instance to scrape metrics from the CoreDNS endpoints. Thanks to the key metrics for CoreDNS, you can easily start monitoring your own CoreDNS in any Kubernetes environment.
Monitor Kubernetes CoreDNS and troubleshoot issues up to 10x faster
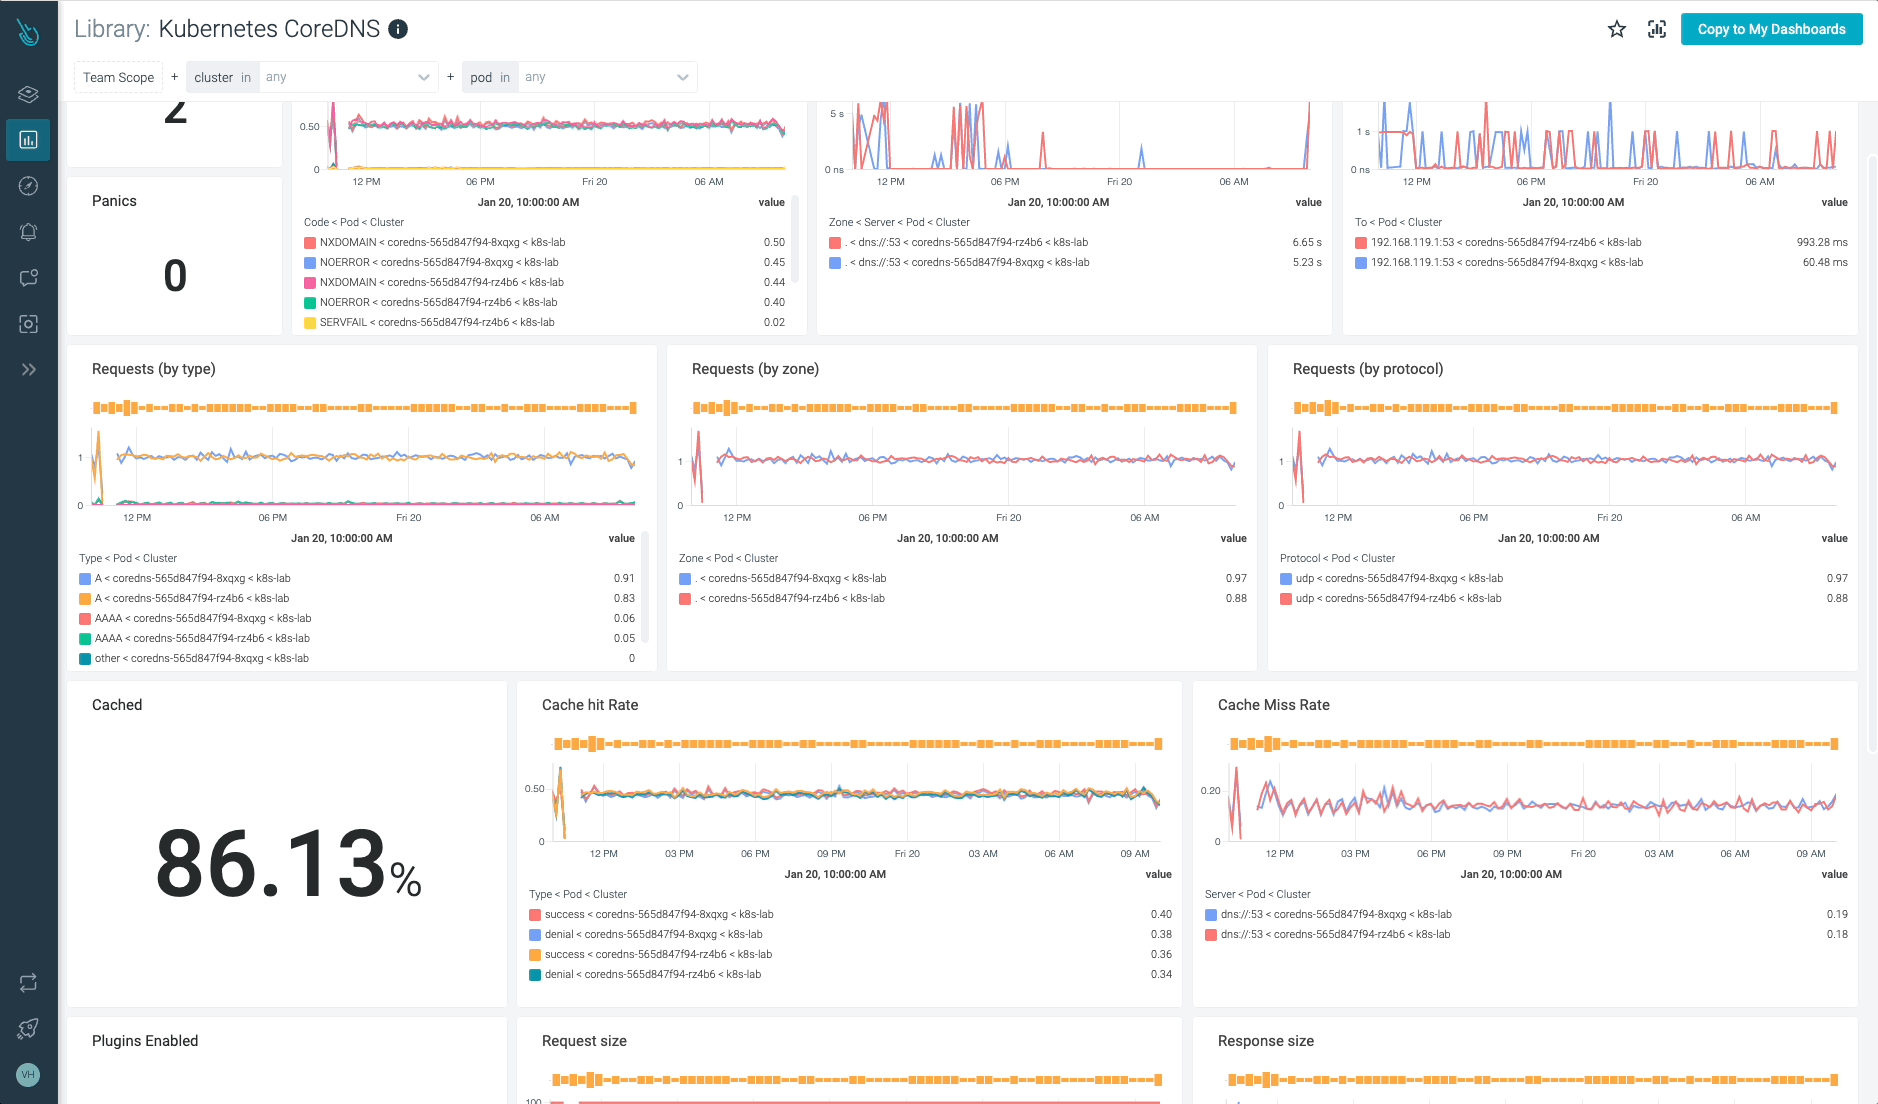
Sysdig can help you monitor and troubleshoot problems with CoreDNS and other parts of the Kubernetes control plane with the out-of-the-box dashboards included in Sysdig Monitor, and no Prometheus server instrumentation is required! Advisor, a tool integrated in Sysdig Monitor, accelerates troubleshooting of your Kubernetes clusters and its workloads by up to 10x.
Sign up for a 30-day trial account and try it yourself!