


Falco Feeds extends the power of Falco by giving open source-focused companies access to expert-written rules that are continuously updated as new threats are discovered.

Look out for these Kubernetes monitoring best practices when evaluating a Kubernetes monitoring solution. It will be easier to make sense of them if your tools are Kubernetes native.
Let's face it. Running containers in Kubernetes brings a number of advantages in terms of automation, segmentation, and efficiency. However, the ability to monitor performance and availability in an ever-changing infrastructure like Kubernetes can be a challenge. A way to address this early is by adopting a Secure DevOps workflow.
Secure DevOps, also known as DevSecOps, brings security and monitoring throughout the application lifecycle, from development through production. This sets you up to deliver applications that are secure, stable, and high performance. This workflow plugs into your existing toolchain and provides a single source of truth across DevOps, developer, and security teams to maximize efficiency and provide visibility for troubleshooting and optimization.
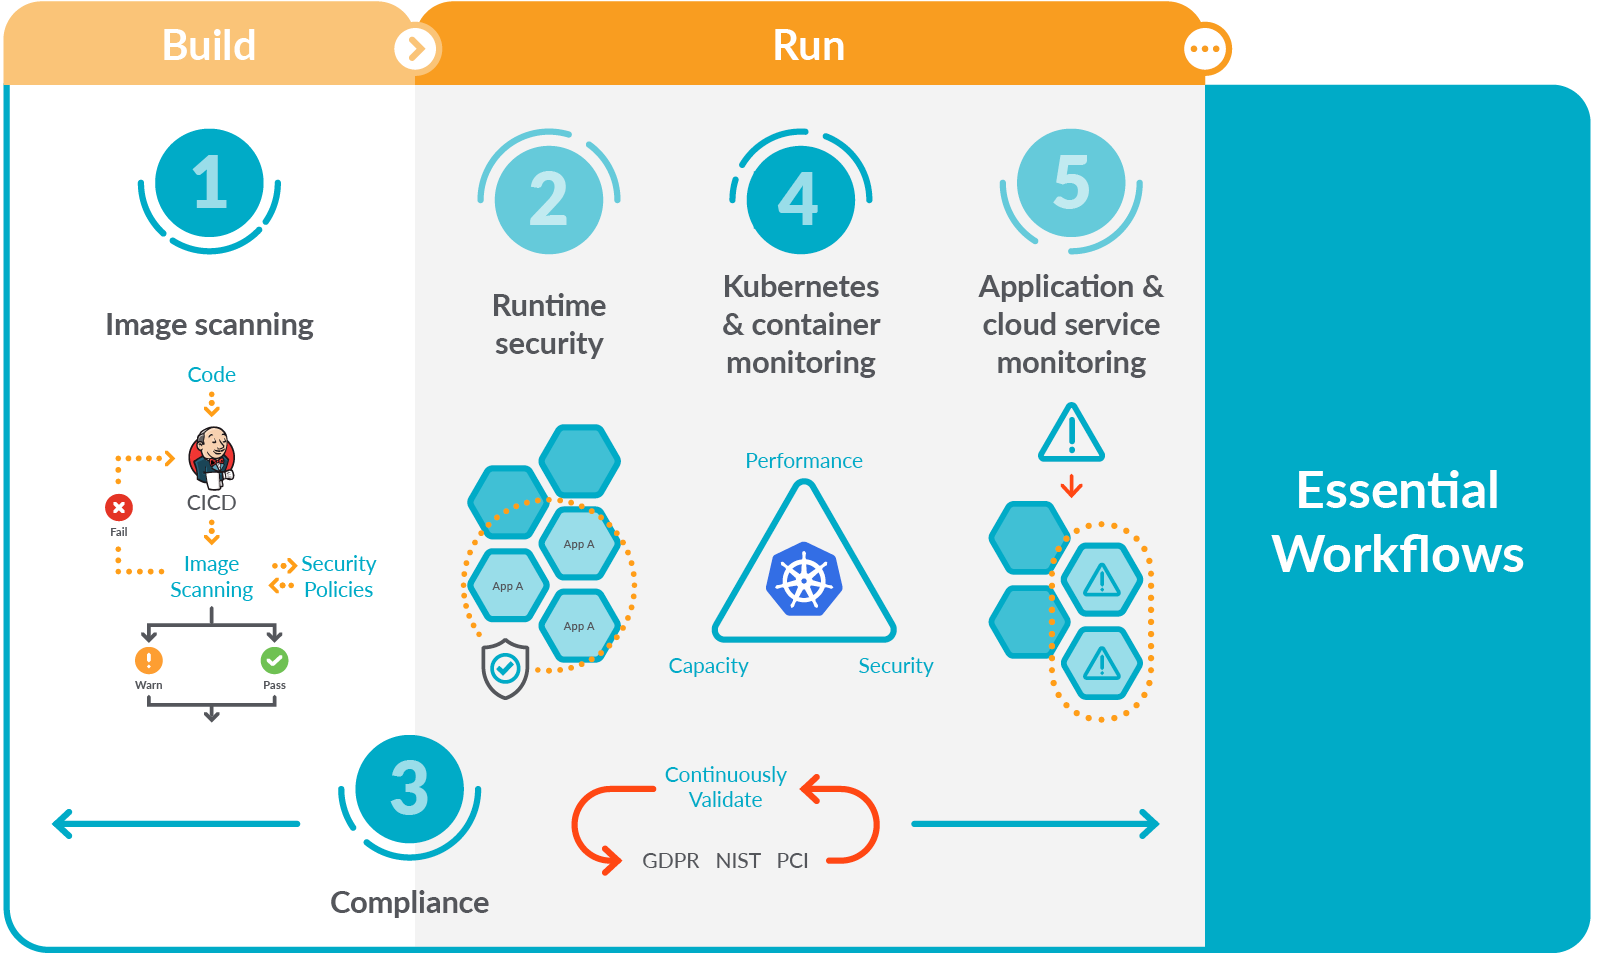
The Kubernetes and container monitoring piece of this puzzle is essential. As I said earlier, Kubernetes is challenging to monitor, which complicates our ability to understand what is going on in cloud-native application environments. By extension, it also complicates troubleshooting. Fortunately, you can succeed with the right tools and by following Kubernetes monitoring best practices.
How is Kubernetes monitoring different?
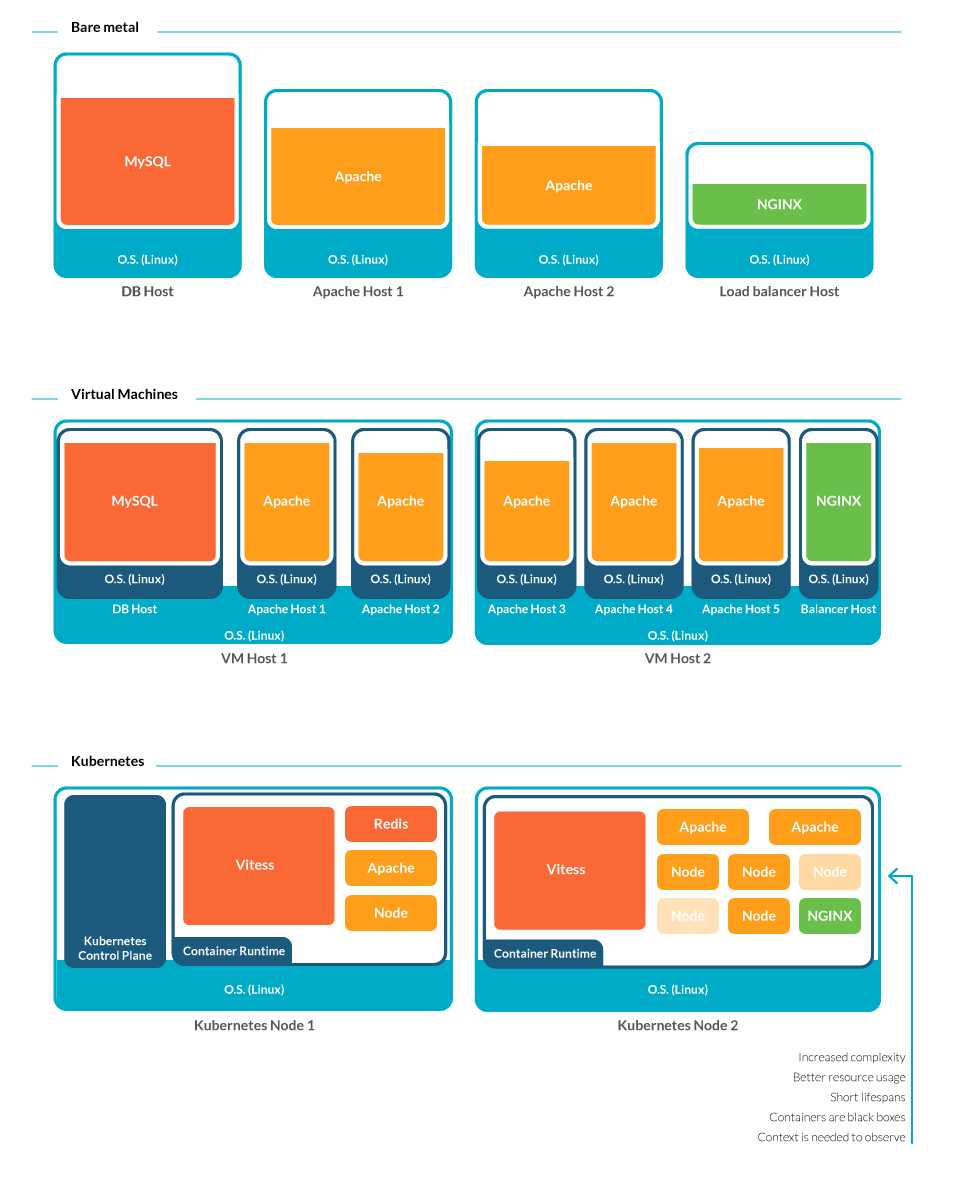
Gone are the days where someone could walk down a row of servers to physically inspect them. Virtual machines also makes troubleshooting more complex, as sometimes you don't know which server your VM is running in. Now, containers are going a step further.
Containers may only live for a few minutes at a time since they get deployed and re-deployed adjusting to usage demand. How can you troubleshoot what is long gone?
Containers are also black boxes. As they run in sandboxes, isolated from each other, it isn't trivial to attach to their processes and gather metrics.
In addition, containers multiply like rabbits. You may have 100x or even 1000x more entities to monitor than you would in a traditional scenario. And to make things worse, they now spread among several hosts. Without the proper context, how can you relate a failing process to the right application and team?
Having this in mind, it looks like the fog surrounding infrastructure is thicker than ever.
But worry not. Kubernetes and containers are mature enough that there are monitoring solutions ready for the challenge. Below is our list of seven Kubernetes monitoring best practices to successfully monitor Kubernetes. We also included some tips to know if a monitoring solution will enable you to follow these practices and provide actionable insights.
1. Don't stay at the surface, dig for deep system visibility
Containers are only required to include a minimal operating system with just the minimum binaries, libraries, and other elements for it to run. This has the benefit of making them highly portable, but more difficult to monitor.
This, paired with their sandboxing, creates an additional layer of abstraction compared to bare metal servers and VMs, and makes containers act as black boxes.
In order to know what is going on across the entire host, the Kubernetes monitoring best practice is to look for deep visibility. This means not only gathering information about resources like CPU, memory, network, and storage, but also granular data at the kernel level about the processes that are running, how they are interacting with the system (file access, ports opened or closed, etc.), and the metadata that describes their relationship to the real world.
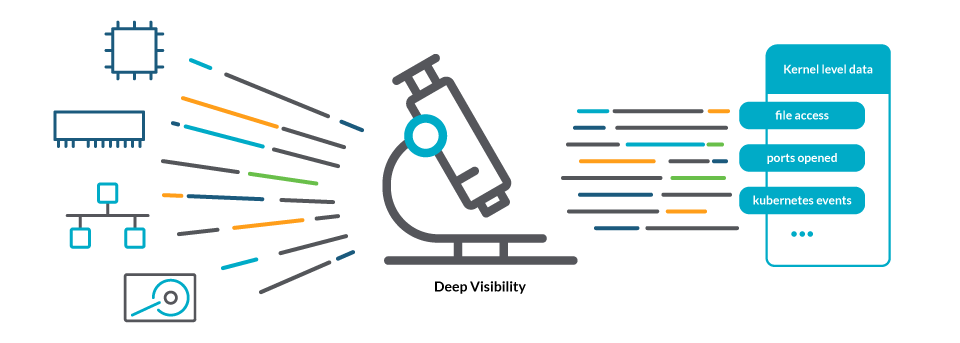
An example of the necessity of the deep system-level visibility would be trying to troubleshoot a CrashLoopBackOff status. Many tools can report a container in a CrashLoopBackOff status, but the root of this problem is often found by looking at the details of what the container is trying to do as it starts up. Only by having greater visibility into the syscalls, can you determine the root cause and take corrective action.
2. Evaluate the instrumenting strategy
There are several instrumenting strategies you can follow in order to gather metrics and events from a system. It is considered a Kubernetes monitoring best practice to evaluate which is the proper one for your system before committing to a monitoring solution.
One of the most common strategies is to wrap or inject your containers with an instrumentation library or run an agent in a sidecar. Theoretically, this doesn't require any change in your applications or installing any kind of agent (the agent is in the library or sidecar), which can come handy in serverless scenarios where you don't have access to the cluster node host.
However, in Kubernetes environments, this strategy introduces several issues. These libraries end up loaded once for each of your running containers, which can significantly increase RAM usage. As container density per node increases, this can add up and become a huge problem.
As these libraries execute on a user space, like the container, the amount of data they can collect is limited to what the container can see. Also, as they are placing themselves between your apps and the system, some edge cases can cause behaviors that are difficult to debug.
Due to all of the issues above, more and more monitoring solutions are moving to eBPF probes. Those are programs running as modules of the Linux kernel, where they can listen to all of the system calls. This allows you to capture all of the information necessary to enable troubleshooting, root cause analysis, and ensure performance in a Kubernetes environment.
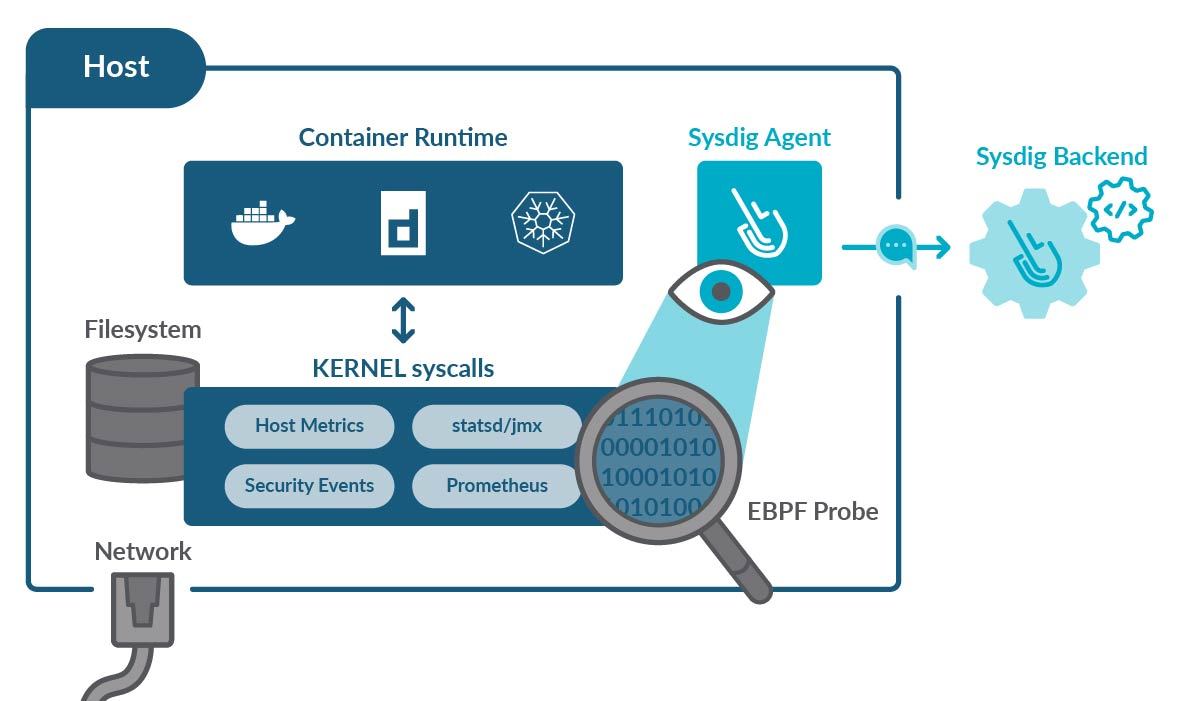
Then, a different process running on user space can combine the probe information with other sources (Prometheus metrics, JMX, logs, etc.) and report back to your monitoring backend.
When coded properly, eBPF probes won't use too much RAM and will only have a minor impact on the CPU. And, since they are mere observers, they won't interfere at all with your processes.
3. Go beyond metrics by capturing historical system data
One of the biggest differences between traditional system architecture and container architecture is that containers are ephemeral. Unlike bare metal or VM architecture which remains mostly static, containers can be deployed in different locations and can be easily redeployed when changes are necessary or new features are ready to roll out.
This is a big advantage for cloud-native environments that need to move fast in order to stay competitive. But this also presents a big challenge when a problem occurs. How do you know what went wrong when a container only lasts for five minutes or is moved to another node in the cluster?
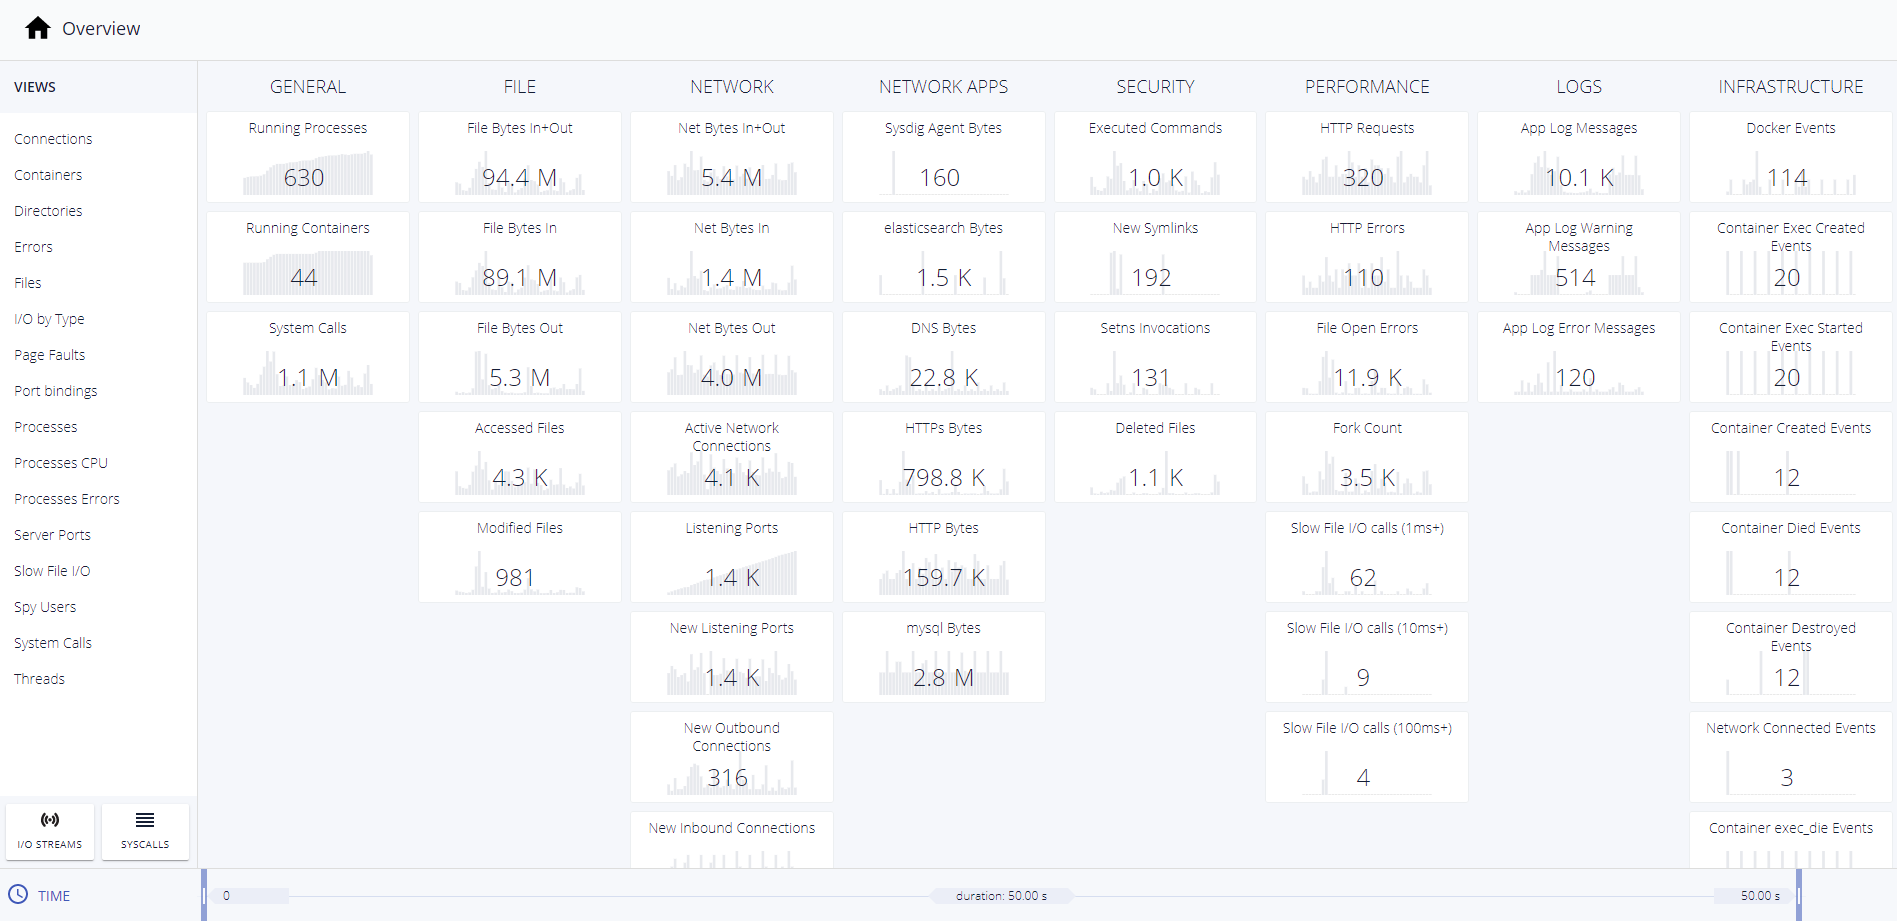
Metrics and log data can only help so much in these cases, and performance issues easily hide under the covers in such dynamic environments. That's why it's a Kubernetes monitoring best practice to capture all host activity around an event.
Even a short window of time, like fifty seconds, can yield an abundance of information when you know you had an important event. A capture of process, network, file, log, cpu, memory, and container activity can be saved and viewed after the container is long gone for trend analysis, helping identify the root cause.
4. Inspect the Kubernetes control plane
The Kubernetes control plane is the brain of your Kubernetes cluster. It manages all of your cluster resources, can schedule new pods, and can read all of the secrets stored in the cluster. Not monitoring the Kubernetes control plane is like being unaware of an engine in your car. You need to know when to add gas, charge the battery, change the oil, etc.
The Kubernetes control plane services a similar, vital function for your environment.
The main components of the control plane are:
- The API Server
- Kubelet
- The controller manager
- etcd
- kube-proxy
- kube-dns
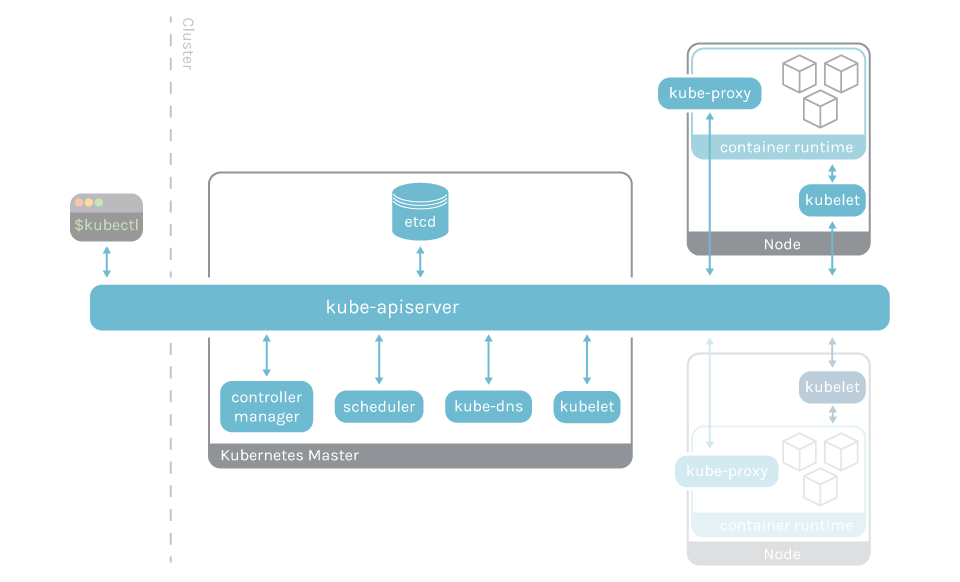
Monitoring the Kubernetes control plane will let you detect and troubleshoot latency and cluster errors, and validate the service performance. Just like you have a dashboard in your car, you should have a dashboard for the elements of the Kubernetes control plane.
For example, monitoring the Kubernetes API server provides visibility in all of the communication between the cluster components.
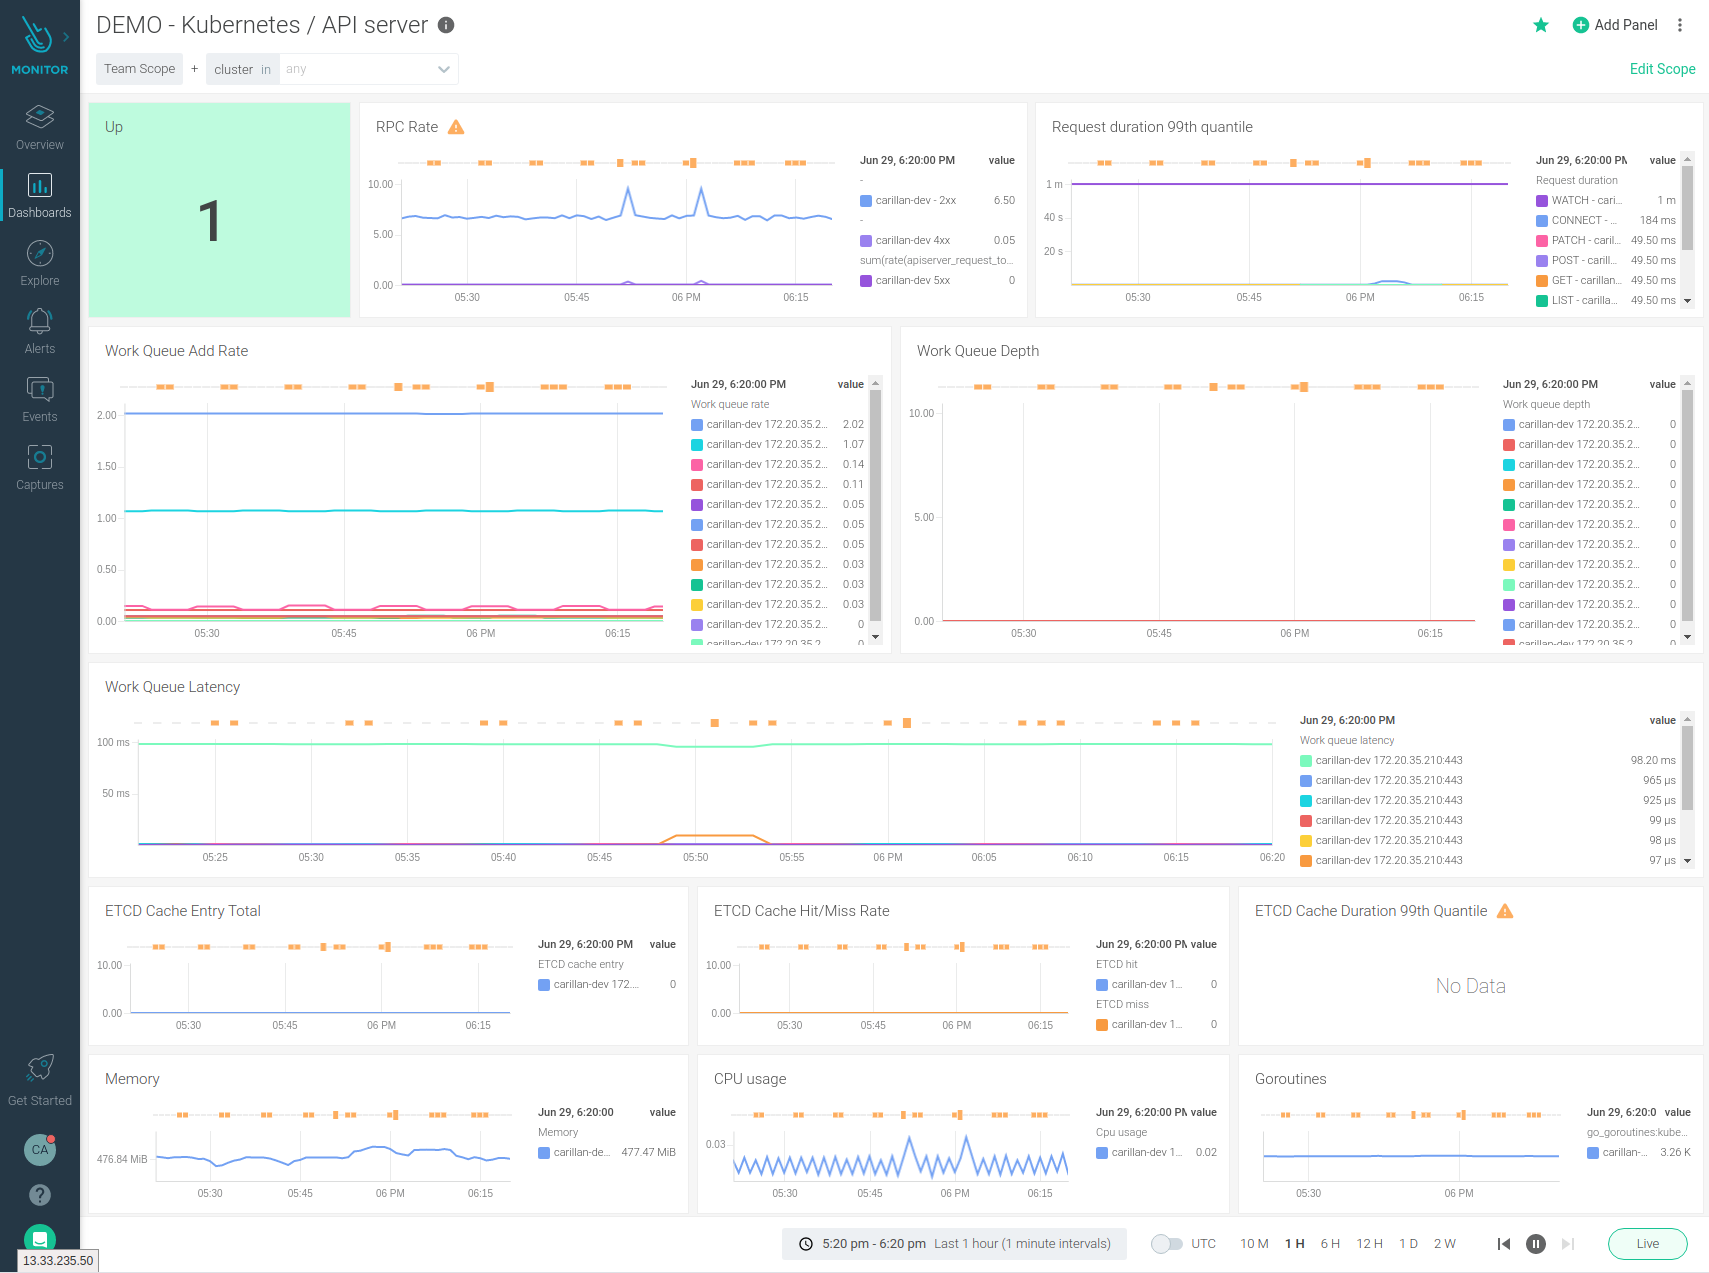
You can find much more detail about monitoring the Kubernetes control plane in our Kubernetes Monitoring Guide.
5. Embed context by correlating metrics and events
There are two types of time series data that are typically collected when monitoring infrastructure, services, and applications: metrics and events.
Metrics are samples taken evenly distributed across time and can be used to monitor the state of your system as well as for forecasting and averaging.
Events on the other side are punctual records of something noteworthy happening, and thus are unpredictable.
The number of entities in your environment increases as you move toward using more containers, also increasing the number of metrics and events in your time series.
When troubleshooting a problem, having millions of metrics and events to look at makes pinpointing a problem like finding a needle in a haystack. If your monitoring tool is able to correlate metrics and events, it will greatly help you separate the signal from the noise, pointing you in the right direction.
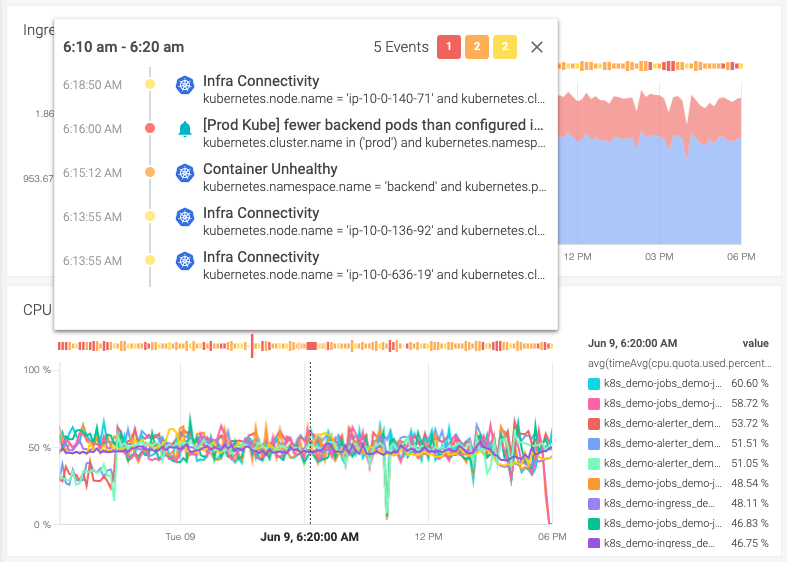
For example, a metric can show that a cluster node is using memory beyond its allocation. With just that information, you could start investigating your containers, fishing for strange memory usage. This may take some time, depending on how many containers are running on that cluster node.
Let's say that at the same time, you had an event for a container that was killed. This extra information lets you narrow your investigation scope. Most likely, that container's limits and requests are misconfigured. At first glance, you already have a theory of the root problem.
But to reach that point, you need to see these two pieces of information side-by-side. That mix of context and information is what you needed to connect the dots, take corrective action, and lower your MTTR. That's why correlating metrics and events is a Kubernetes monitoring best practice.
Look for monitoring solutions that overlay events on top of metrics in dashboards.
6. Look for Out-of-the-box dashboards and alerts
Almost every monitoring tool has some sort of dashboard functionality these days. Dashboards can be a great way to visualize your data, but only if you have an idea of what you should be looking at.
For those that are new to Kubernetes or Prometheus, the learning curve with dashboards and alerts can be steep. "You don't know what you don't know" is the old saying that applies best here. This is why it is a Kubernetes monitoring best practice not just to have dashboards as a feature of your monitoring product, but also to have some dashboards that are provided for you as an easy way to get you started.
Alerts can also be challenging to wrap your head around when learning a new tool. If you set your alerts with a low threshold, your support teams will develop "alert fatigue." On the other end of the spectrum, if your alerts are not triggering at the right time, you may miss important information about a condition that could be affecting your end-users.
Having good examples built into your monitoring tool of choice can save you time in the setup and tuning process. It can also be a good learning tool, helping you discover things you should be monitoring that you hadn't thought of before.
There are online repositories of monitoring integrations, dashboards, and alerts that can complement your monitoring tool. Just make sure those resources are tested and maintained, like in PromCat, to avoid wasting your time.
There are some dashboard and alert extra features you can look for in a monitoring solution. For example:
- Included explanations of the metrics on the dashboards.
- Being able to customize those dashboards.
- Being able to set the right scope in alerts, to notify on production events while avoiding an alert storm from a test environment.
7: Choose a SaaS-based monitoring solution
Choosing a SaaS-based scanning service over an on-prem solution has many benefits:
On-demand and scalable resources: You can start with a few time series at first and grow as your container applications scale without worrying about backend data management.
Fast implementation: You can install the agents and get your monitoring up and running in minutes, unlike on-premises applications that require more time to install and setup.
Easy upgrades and maintenance: The SaaS provider handles patches and rolls out new feature updates that don't require you to manually upgrade.
No infrastructure or staff costs: You avoid paying for in-house hardware and software licenses with perpetual ownership. You also don't need on-site to maintain and support the application.
Conclusion
Kubernetes and containers have changed the monitoring paradigm, rendering traditional monitoring strategies useless. Containers multiply the number of entities to monitor while being short-lived and opaque.
However, by following Kubernetes monitoring best practices you can obtain deep visibility to ensure your system availability and performance, and also get the proper context to help you quickly troubleshoot any incident.
Choosing the right tool is key. Sysdig enables you to follow these Kubernetes monitoring best practices, and with its guided onboarding you will be set in less than five minutes. Our out-of-the-box visibility and correlation of container, service, and application metadata will help lower your MTTR while increasing performance and availability for your environment. Try it today!
To see the Kubernetes and container monitoring workflow in action, check out our webinar The Five Kubernetes Monitoring Must-Haves.