


Falco Feeds extends the power of Falco by giving open source-focused companies access to expert-written rules that are continuously updated as new threats are discovered.

The fourth annual Sysdig Container Security and Usage Report looks at how global Sysdig customers of all sizes and industries are using and securing container environments. By examining how and when organizations are implementing security in the development lifecycle, we have been able to uncover some interesting data points in this year's report.
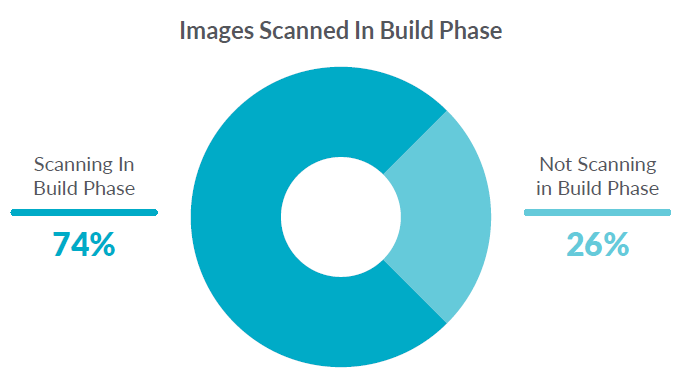
For example, we can see that 74% of organizations are scanning container images in the build process. This indicates that container security is shifting left.
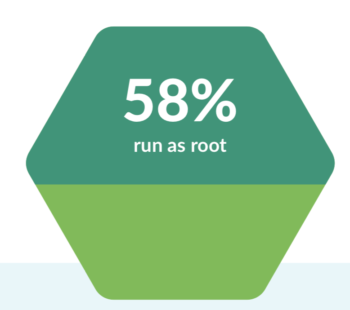
However, if we look at the runtime scanning data, we see that the majority of images are still overly permissive with 58% of containers running as root. This indicates that while shifting left is a good start and might help catch vulnerabilities sooner, there is still a need for runtime scanning to detect when configuration errors occur.
We also see a dramatic increase of 300% in the adoption of Falco, as users turn to open source solutions to address their security concerns.
This report also digs deeper into the usage of metrics, popular alerts, container density trends, and Kubernetes usage patterns.
Sysdig's view into the data
Because our software monitors both container security and container usage, we have a unique view of how people are using Kubernetes, registries, alerts, and applications in container environments. This real-world, real-time data provides insight into the usage of millions of containers that a subset of our customers are running every day and nearly one billion unique containers from the past year. The report includes a detailed look at security risks, container usage, and services deployed.
Let's take a look at some of this year's highlights.
Security is shifting left yet leaving doors open
DevOps teams are "shifting left" with the goal of starting to consider important implications earlier in the development lifecycle. Security is key among these concerns. In our analysis, we looked at the number of organizations that are scanning their images as part of the build phase in their CI/CD pipeline, and those that are not.
74% of our customers are scanning pre-deployment. This is a good sign because scanning in the build phase helps teams address potential security risks with images before they make it into production.
While teams understand the need to scan for vulnerabilities, they may not be scanning for common configuration mistakes.
What we see is that 58% of images are running as root, allowing for privileged containers that can be compromised. This seemed high, so we asked our customers. It turns out that in practice, even if risky configurations are detected at runtime, teams don't stop containers so they can continue deploying quickly.
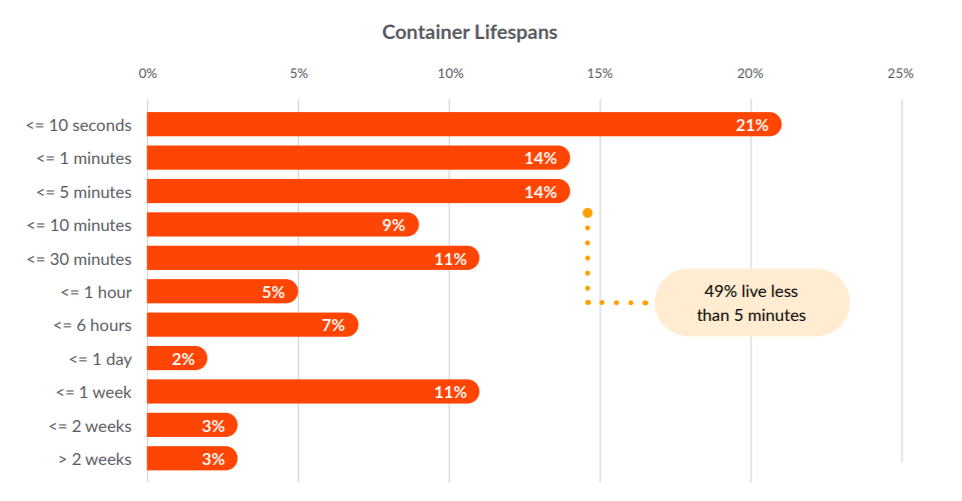
When comparing container lifespans year-over-year, we see a similar pattern in which a majority of containers are alive for less than a week. In fact, our newest data sample shows that 49% of these containers live less than five minutes, and 21% of them live less than 10 seconds!
This presents a significant challenge for auditing security problems, since many monitoring tools can't provide detailed information in such a small time sample.
Shifts in runtimes and registries
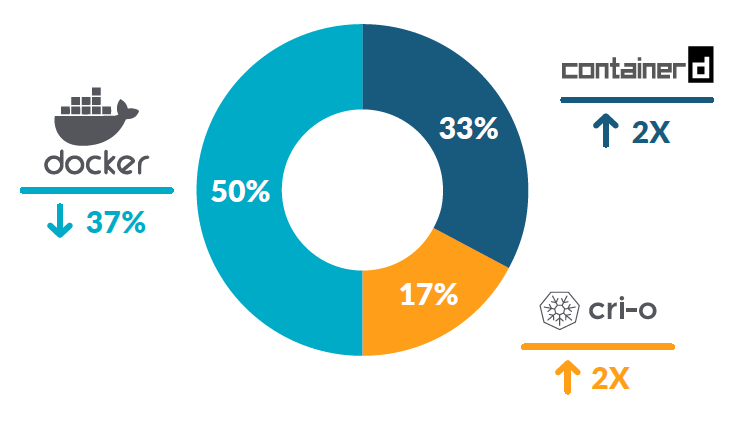
Over the past year, we have seen 200% growth for both containerd and CRI-O. Compare that to Docker, which came in at 79% growth last year but is down to 50% this year. It is also notable that the Kubernetes project announced it will be officially deprecating the use of Docker later in 2021.
Choosing which container runtime to use may seem a little unclear given the emergence of several options. However, because of open standards, concerns about making the wrong choice and lock-in have evaporated. To make it even easier, popular platforms like OpenShift, GKE, and IKS support using multiple container runtimes in parallel and have typically designed in a runtime of choice, removing the need to spend any cycles of development on deciding which one to use.
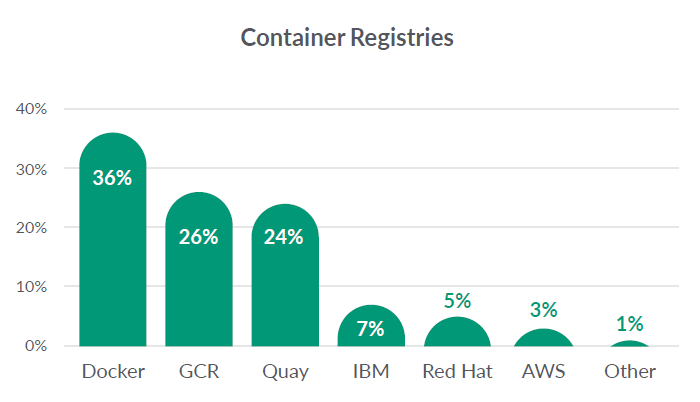
Container registries provide repositories for hosting and managing container images. Docker registries are used by 36% of our customers. This measure includes both private hosted and public repositories.
Registry solutions hosted by cloud providers are increasingly popular. Similar to the past few years, the Google Cloud Registry is once again the top public cloud repository, used by 26% of our Sysdig users. However, Quay has picked up some growth from last year, increasing from 14% to 24%.
Organizations are turning to open source
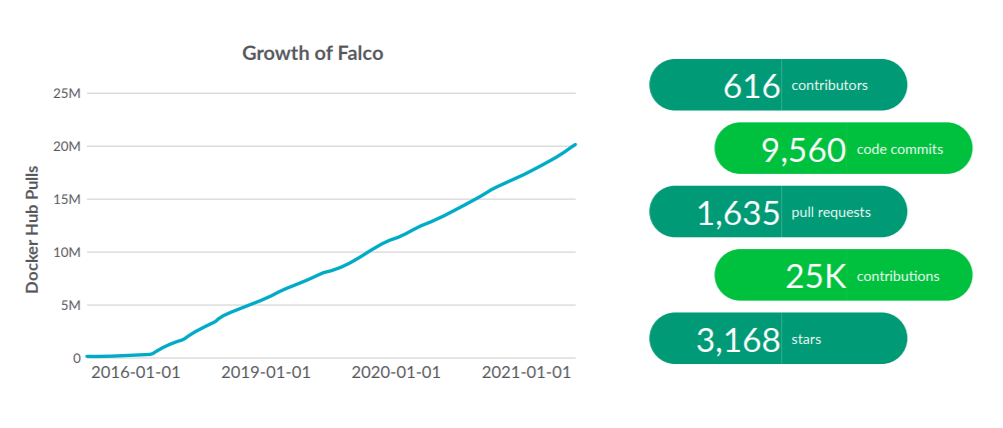
Once known vulnerabilities have been addressed in the build phase of the container lifecycle, teams need to set policies that will detect anomalous behavior and trigger security alerts at run time to help with undocumented threats. Runtime security for Kubernetes is something organizations are just starting to address with open source solutions like Falco, the CNCF open-source project contributed by Sysdig.
We found that Falco is quickly gaining momentum and interest, with over 20 million Docker Hub pulls. That represents a 300% growth compared to last year's 252% increase. Falco enables the definition of runtime policies that detect security violations and generate alerts. Once users adopt Falco, they appreciate how Sysdig Secure builds on it to automate rule creation and tuning.
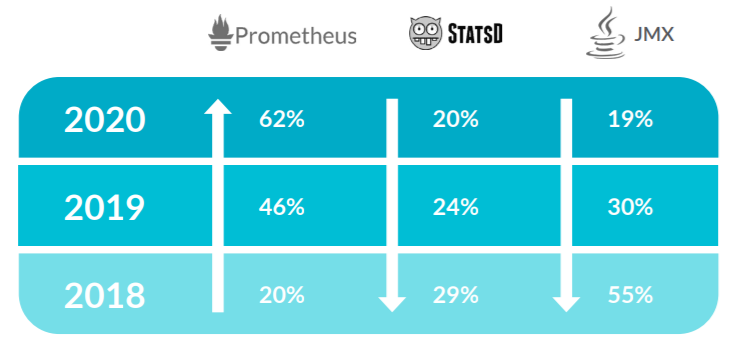
Custom metric solutions give developers and DevOps teams a way to instrument code to collect unique metrics. This approach has become a popular way to monitor applications in production cloud environments.
Of the three mainstay solutions, JMX, StatsD, and Prometheus, it was Prometheus that gained for the second year in a row. Year-over-year, Prometheus metric use increased to 62% across our customers, compared to 46% last year.
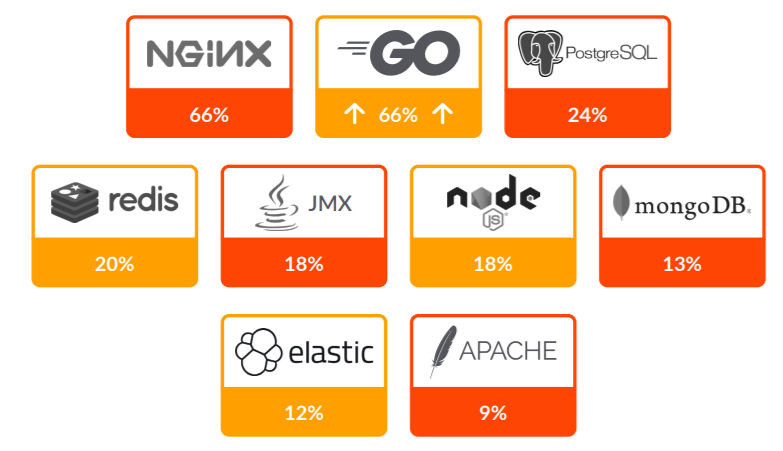
Open source has changed the face of enterprise computing. It powers innovation across not just infrastructure, but application development in particular. Sysdig's ability to auto-discover the processes inside containers gives us instant insight into the solutions that make up the cloud-native services that our customers run in production.
Last year, both Node.js and Go (aka golang) overtook the use of Java. This year, Go has shot up in usage from 14% to 66%. Below are the top 10 open source (non-container related) technologies deployed by Sysdig customers:
Conclusion
Container security is a growing concern for companies, as indicated by the effort put into shifting left and the astounding adoption of Falco since our last usage report. However, organizations need to remain vigilant in their efforts to examine runtime activity to be able to detect configuration errors and attacks. The key insights from our fourth annual report highlight big changes taking place in the container ecosystem and the need for enterprises to take steps to adapt, including:
- To keep ahead of runtime risks, cloud teams must act now to integrate security into DevOps.
- Real-time visibility that provides detailed audit and forensics records for short-lived containers is critical to secure operations.
- Organizations should invest in Kubernetes-native tools to simplify operating at scale.
- As Prometheus extends its lead as the standard for cloud-native application metrics, users must learn how to leverage reliably and at scale.
Download the full Sysdig 2021 container security and usage report now for all the details. Also, check out our recent cloud native and security reports.