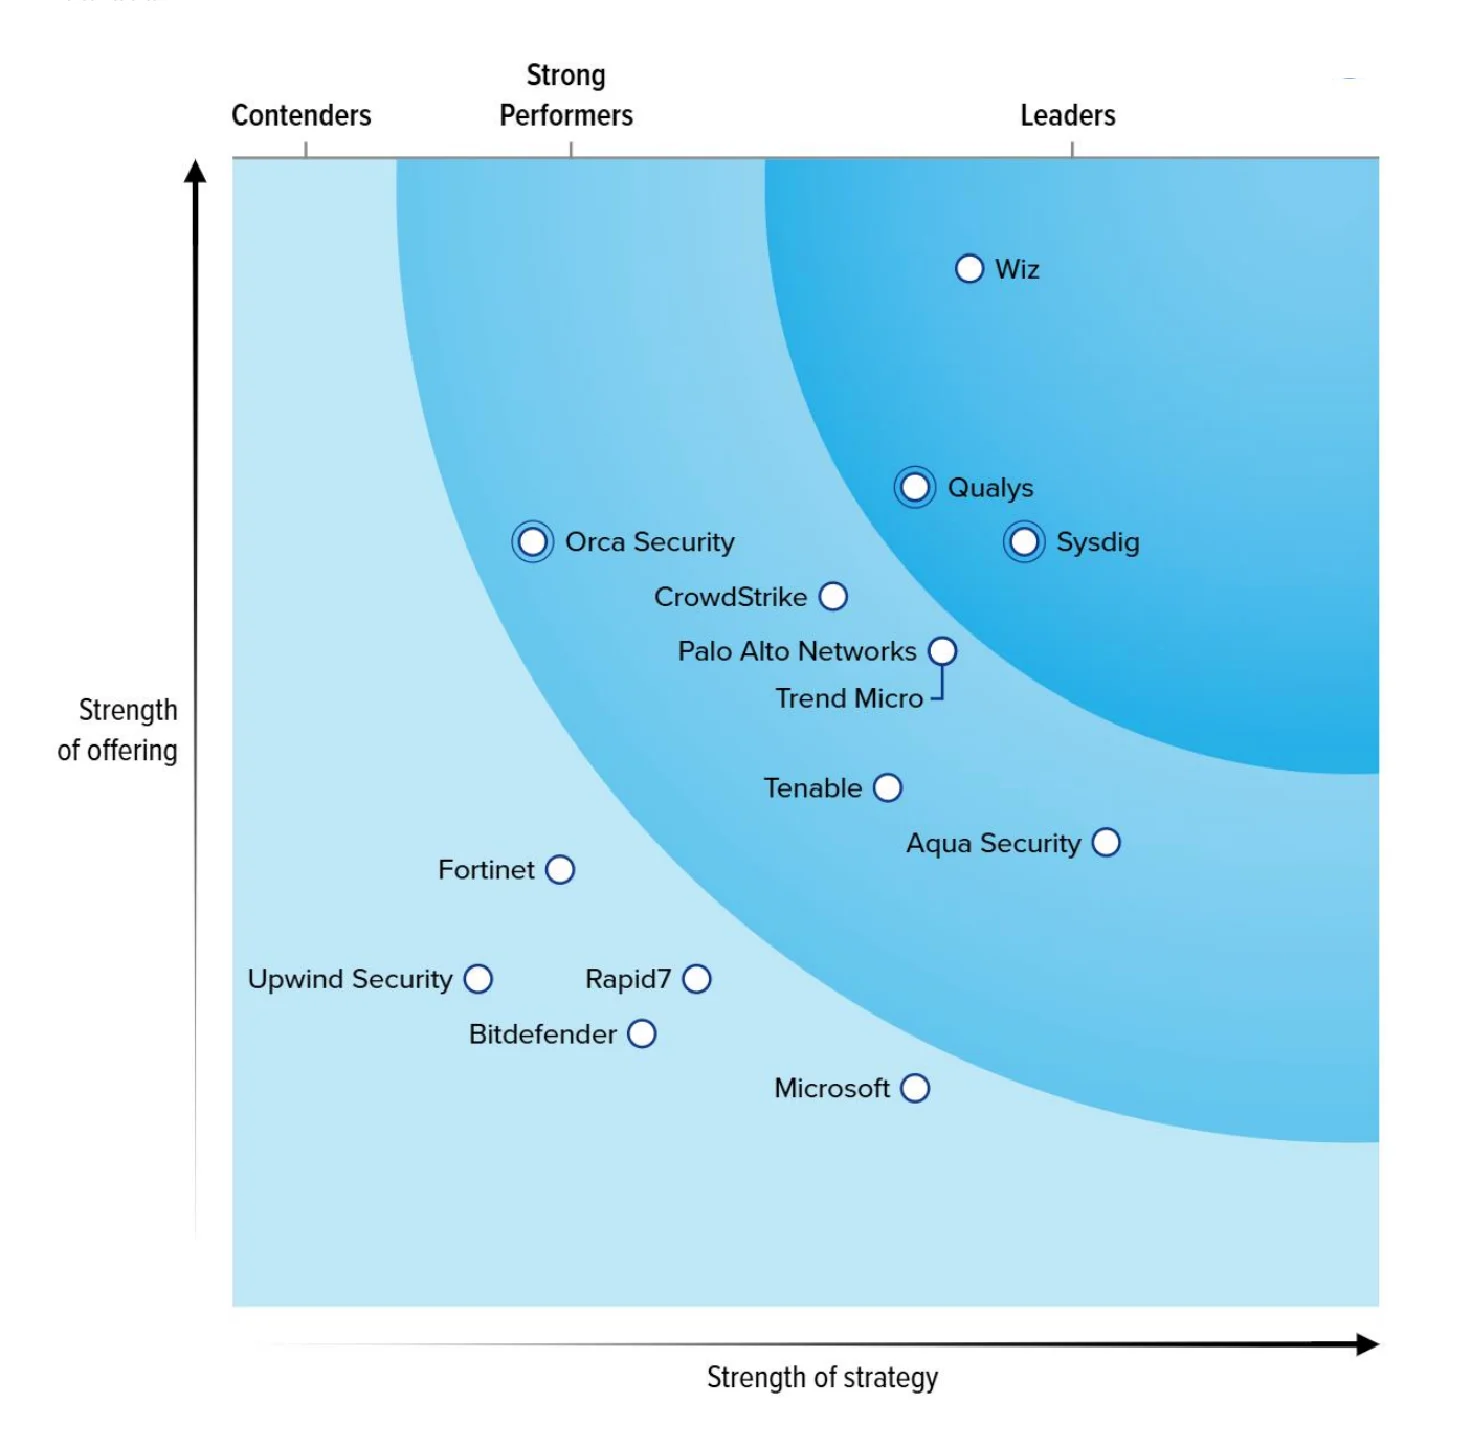
Forrester names Sysdig a Leader in CNAPP
Runtime redefines cloud security, the right way.
Secure the cloud
the right way withagentic AI.open innovation.runtime insights.agentic AI.
agentic AI.
open innovation.
runtime insights.
agentic AI.
Sysdig delivers real-time security with zero compromise.
From protection to prevention, Sysdig secures the complete cloud lifecycle.
2026 CLOUD-NATIVE SECURITY & USAGE REPORT
Human-driven security has reached its limits
The Sysdig Open Source Community Launch
2025 GARTNER® MARKET GUIDE for CNAPP
Runtime is no longer optional.
GET THE GUIDE
Sysdig named representative vendor in Gartner Market Guide for CNAPP
sysdig is customer’s choice for cNAPP
LATIO TECH 2025 CLOUD SECURITY MARKET REPORT
We're a leader in real-time AI cloud defense.
GET INVOLVED
Join the Sysdig Open Source Community.
AI Helps Teams Reduce MTTR by 76%

In security,
there’s no room for compromise.
But security teams face constant pressure to
Respond fast.
Be precise.
Never miss a threat.
At the same time,
developers must
Ship fast.
Stay focused.
Build securely.
Both teams move fast, but they’re disconnected
Too much noise.
Too little context.
Too many siloes.
So they compromise with good enough security.
But why settle when there is a better way?
Secure the cloud the right way
Secure
the cloud
the right way
With Sysdig, there’s no guesswork or black boxes. There’s just real-time defense, done right.
The value of not
compromising on security.
Teams using Sysdig save time, fix faster, and defend smarter –
without slowing down innovation.

95%
time saved on vulnerability management

98%
reduction in vulnerability noise

2 second
threat detection
better together
Empowering development and security teams together – the right way

Neo4j provides critical insights to organizations in some of the world’s most heavily regulated industries, including NASA and major U.S. banks. A security breach on their platform could have serious consequences.

Integrations
Sysdig helps teams work smarter, respond in real time, and build a more resilient security ecosystem.
Get security right.
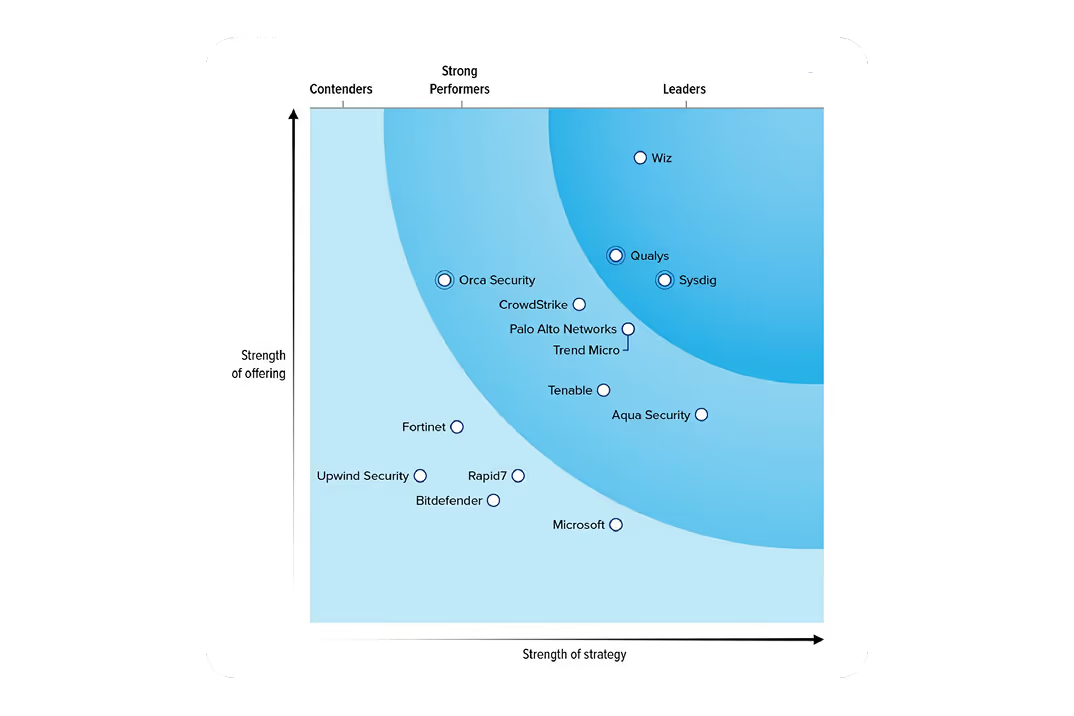
Forrester names Sysdig a Leader in CNAPP
Runtime redefines cloud security, the right way
Forrester names Sysdig a Leader in CNAPP

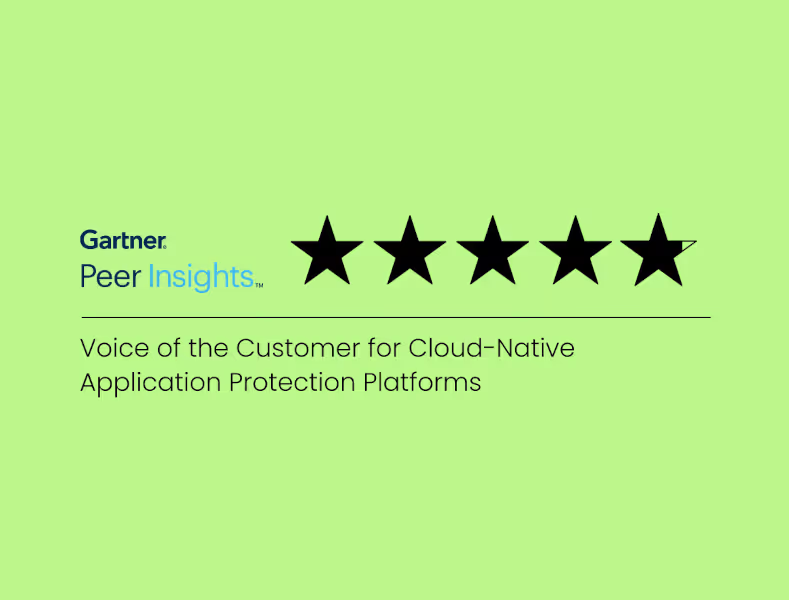
Sysdig recognized as Customers’ Choice for CNAPP
99% of customers recommend Sysdig
Sysdig recognized as Customers’ Choice for CNAPP

Securing AI: Navigating a New Frontier of Security Risk
AI unlocks value and new security risks
Securing AI: Navigating a New Frontier of Security Risk