Csysdig is an open source, htop-like interactive troubleshooting tool for Linux that is designed for monitoring and debugging containers.
It understands Docker, Rkt and LXC containers and underlying processes and threads together with their resources usage (CPU, Memory, net and file IO, etc) – basically everything you can capture from system calls. It can also map container activity to related Kubernetes and Mesos concepts like pods, deployments, services and the like. Think of wireshark for your entire system, and not only network activity, that understands the container orchestration tool you use.
Csysdig works on live data and historical “captures” (similar to tcpdump pcap files) that allows you to
troubleshoot containers off-host and after-the-fact.
It leverages the same kernel instrumentation as sysdig (for more information read:
dtrace vs. strace vs. sysdig – a technical discussion).
Finally, Csysdig can take actions on Docker containers, like: kill, stop, open shell, inspect logs, and more.
Csysdig: Show me the goodness
I was inspired by “
htop explained visually” to create this simple overview of Csysdig.
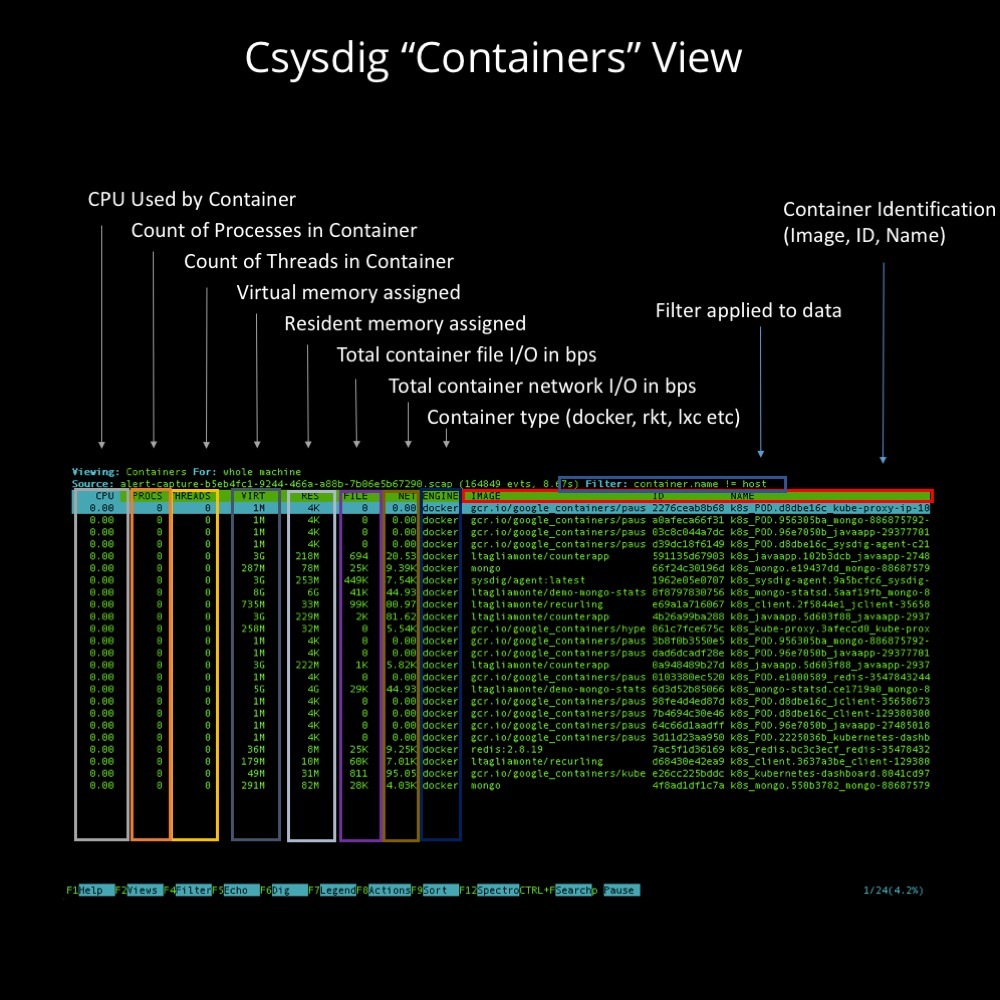
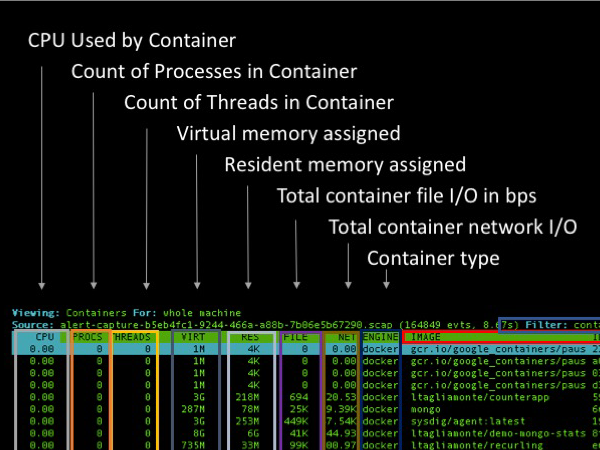
As example, let’s break down the Containers view. A view is just a particular way to format your data plus a filter applied to the data. As you’ll see, there are lots of views in Csysdig.
The Containers view gives you a high level breakdown of what each of your containers is doing on a host. Csysdig is aggregating CPU, process, thread, memory, file and network information per container. You can use the arrow keys to navigate between lines, and then use the enter key to drill down. This will change the filter to, for example, focus on data only for a given container (in this view) or process etc for other views. Across the bottom, you’ll see the function keys with common actions you might want to take to explore further.
You can also see that, in the upper right, there is a filter. This limits the data to what’s relevant to you. As you navigate through Csysdig (either by drilling down or by changing views), you’ll see that the filter changes. If you use the sysdig command line tool already, you might be familiar with this filtering language. If you don’t yet use sysdig, then Csysdig can serve as an easy way to learn the filtering language as you become more powerful with the tool.
Views are based on a sysdig concept called Chisels. Chisels are
Lua plug-ins that aggregate and format your data to see exactly what you want. It’s valuable to know this because you
can actually build views and add them to Csysdig!
Exploring all of the Csysdig troubleshooting views
If you press F2 (Fn+F2 if you’re using a Mac Terminal) then you’ll get a menu of all the existing Csysdig views, plus definitions for each one.
Let’s take a look:
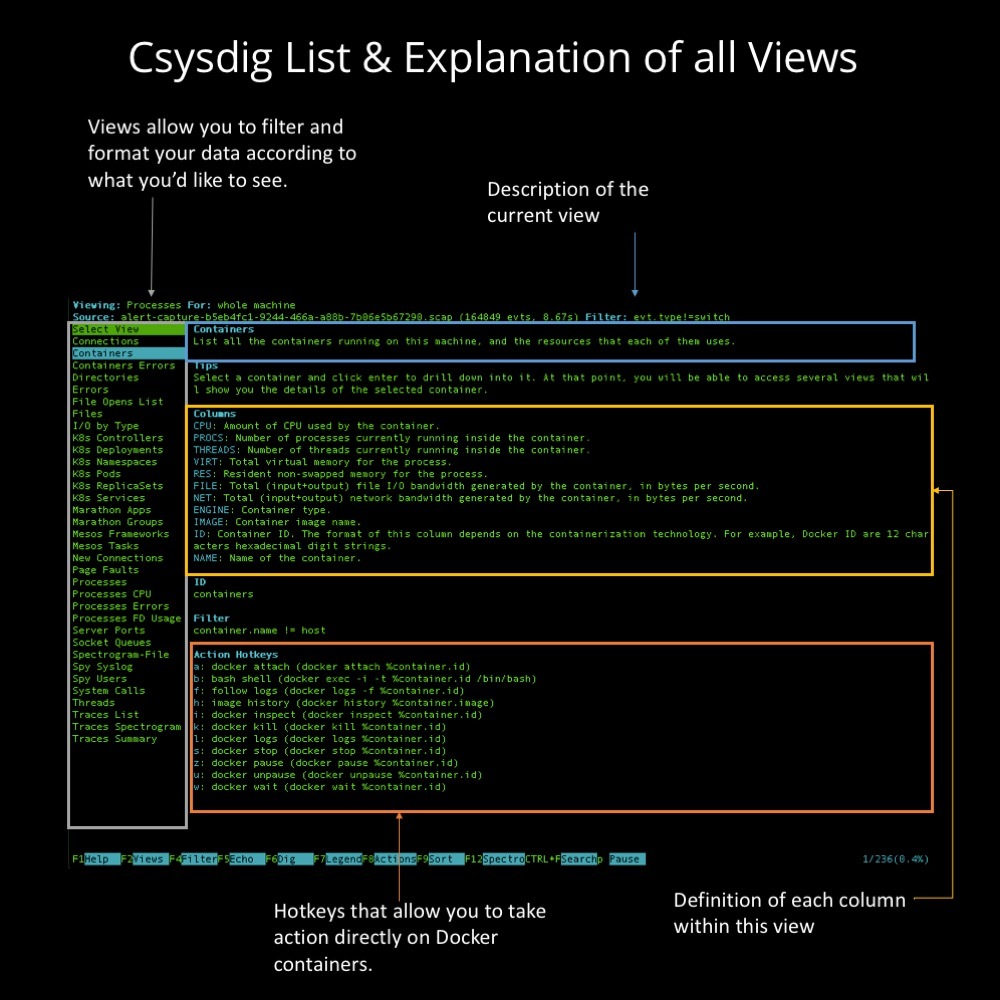
Use the up and down keys to cycle through views. As you can see there are lots of views for:
- Containers
- Container Errors
- Kubernetes-based views
- Mesos-based views
- Network activity (by container, host, and process)
- File Activities
- Processes Activity / CPU / Memory / File
- Threads
- Log activity
- User Activity
- Traces
- Spectrograms
Don’t just see it – take action If you’re running Csysdig in “live” mode (as opposed to analyzing a capture file after the fact), then you can also take actions using the Action Hotkeys.
For example, on the containers view you can:
- Kill (k) or Pause (z) a container
- Inspect (i)
- View logs (l)
- Launch a shell (b)
Let’s take a look at one more view – spectrograms – to give you a feel for what else Csysdig can do.
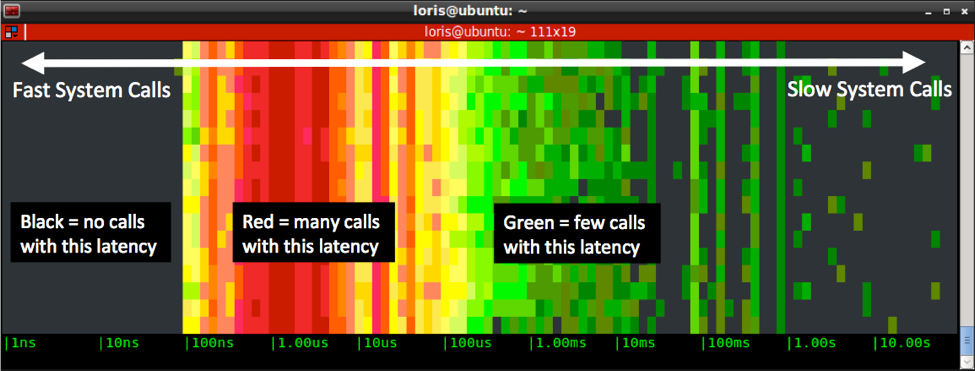
Exploring spectrograms
Spectrograms are a great way to visualize a lot of information at once. A close cousin to the heat map, spectrograms simultaneously display time-based information (like file access, system calls, network times) with a sense of volume (many or few calls).
They are a great way to quickly assess where a problem might be. Also…. you can drill down here! You can use the mouse to select select the time frame in the spectrogram you want to focus and Csysdig drill down there. Try it! Or, if you want to read more on spectrograms, check out
50 Shades of System Calls.
Of course there is tons more you can see and do with Csysdig. For example, using
Sysdig Monitor (the commercial monitoring tool) you can trigger a Csysdig system capture – even across multiple hosts – based on a performance alert.
Hopefully this visual tour inspires you to dig in deeper. The easiest way to get started is to
download and install csysdig today!