
We’re thrilled to announce the expansion of Sysdig Monitor integration with Kubernetes with the release of kube-state-metrics support. Now, you get complete visibility into the performance and state of your Kubernetes environment to help you ensure your container-based services are scheduled and running as expected. What’s more, Sysdig does this automatically, without requiring you to run and manage the kube-state service separately.
With kube-state-metrics, we add a new dimension to Kubernetes monitoring. Now you can quickly answer questions like, “how many pods are currently running for my java app service deployment?” Or, “how many nodes are ready vs. unschedulable?”
What is kube-state-metrics?
kube-state-metrics is an open source project designed to generate metrics derived from the state of Kubernetes objects – the abstractions Kubernetes uses to represent your cluster. With this information you can monitor details such as:
- State of nodes, pods, and jobs
- Compliance with replicaSets specs
- Resource requests and min/max limits
Contrast kube-state-metrics with resource utilization metrics. Resource utilization metrics are oriented toward health and performance. These are aspects like CPU, memory, network, and storage by Kubernetes object. kube-state-metrics is about the status or count, and by combining the two, you start to get a more complete picture of what’s happening in your Kubernetes cluster.
The kube-state-metrics service uses client-go – the official client library for the Go programming language – to talk with the Kubernetes cluster API. It collects and holds an entire snapshot of Kubernetes state in memory and continuously generates new metrics. Though it contains a wealth of data, it does not export the data anywhere. To be useful, you need a way to extract display, and use the metrics.
Monitoring #Kubernetes orchestration state with Sysdig Monitor and kube-state-metrics. 25+ metrics to know what Kubernetes is doing! Click to tweet
How does Sysdig Monitor use kube-state-metrics?
Getting started with Kubernetes object state monitoring is easy. The Sysdig agent automatically polls the Kubernetes API for kube-state-metrics and makes them available for analysis, correlation, and alerting in the Sysdig Monitor UI. At the moment, Sysdig Monitor features 25 new metrics on the Kubernetes object state, but this will grow as more objects and resources become available upstream. Five out-of-the-box groupings help to organize your infrastructure in meaningful hierarchies and provide you with infrastructure overviews that simplify drill-down to the data you want to see. Plus, we’ve setup 13 default dashboards categorized by Kubernetes object to give you flexibility in what and how you view the kube-state-metrics output. We’ve made it simple – zero effort to get started – just click on your desired Kubernetes object and we’ll display the relevant choices. In addition, you can build-your-own views incorporating kube-state-metrics and non-kube-state-metrics in the same dashboard. Check out this short demo video to see what’s included:
Answering key Kubernetes questions with kube-state-metrics
So you may be asking, “What do I get with this object state information?” There are a lot of new scenarios you will now be able to explore. When paired with resource consumption metrics, kube-state-metrics help you identify whether the condition of your cluster is having an impact on application behavior. Here are examples of questions you’ll be able to answer:
- Pods:
- Are there enough available pods compared to the desired pods?
- How many pods are in available status, ready to serve requests?
- Is there enough capacity to serve pod requests?
- How many pods are waiting to be scheduled?
- How many container restarts occurred within a pod?
- How many CPU cores and how much memory has been requested by the containers in a pod?
Deployments:
- Does each deployment have sufficient resources?
- How many pods are running per deployment? How many are desired?
- Does each deployment have sufficient available pods?
- How many have been updated?
Namespaces:
- How many namespaces exist?
- What is the number of services, deployments, replicaSets, or jobs per namespace?
Nodes:
- How many nodes are ready?
- Is there enough capacity to serve the pods running on the nodes?
- How many nodes are unavailable? How many nodes are out of disk space?
- What are the pod resources of a node that are available for scheduling?
- What is the allocatable capacity vs. requested capacity on the node?
- How many nodes have memory, disk, or network pressure?
ReplicaSets:
- How many pods are in a replicaSet?
- How many pods per replicaSet are ready?
- What is the desired number of pods per replicaSet?
ReplicationControllers:
- How many pods are in a ReplicationController?
- How many pods per ReplicationController are ready?
- What is the number of desired pods per ReplicationController?
DaemonSets:
- How many nodes are running at a daemonSet?
- How many should be running a daemonSet and how many should not?
Jobs:
- What are the running jobs?
- What is the maximum or desired number of concurrent jobs?
- How many jobs are actively running?
- How many have reached phase Succeeded vs. phase Failed?
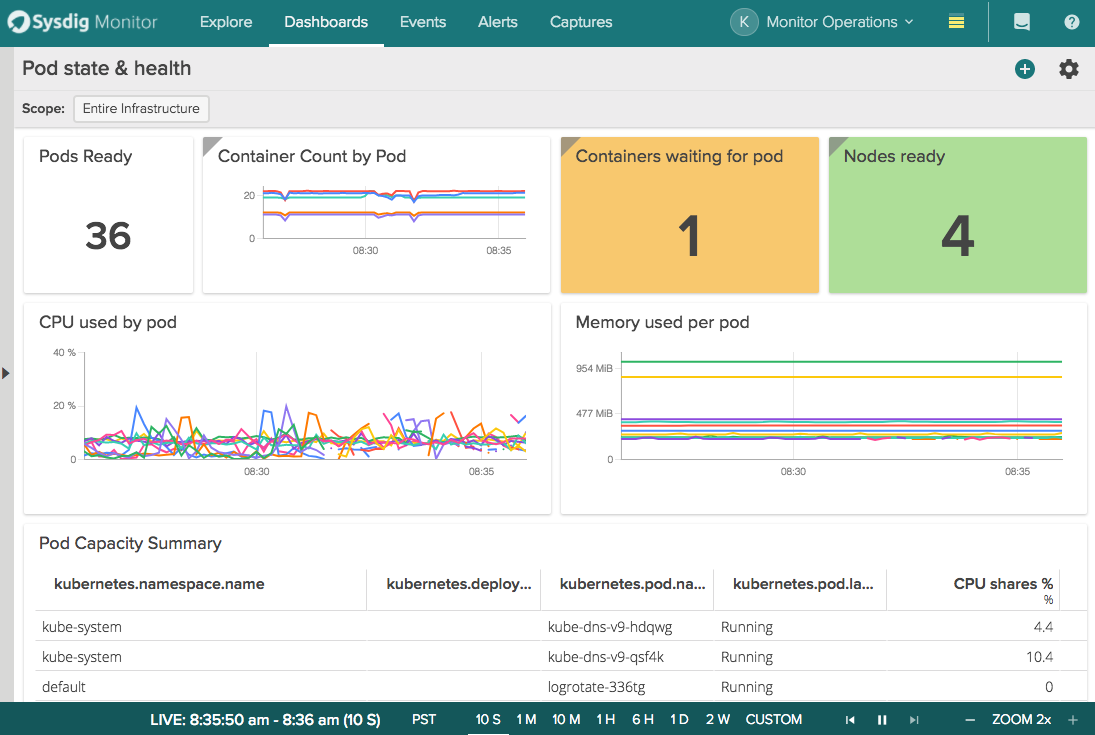 Monitoring kubernetes pod health with kube-state-metrics
We will keep adding more metrics as new objects and resources are implemented in Kubernetes!
Alerting with kube-state-metrics
Along with the new dashboards and groupings, we also provide 16 new pre-configured alerts. As a result, you can be notified on a wide range of conditions related to the state of Kubernetes objects. Here are a couple of great Kubernetes alerting examples for common conditions you may encounter:
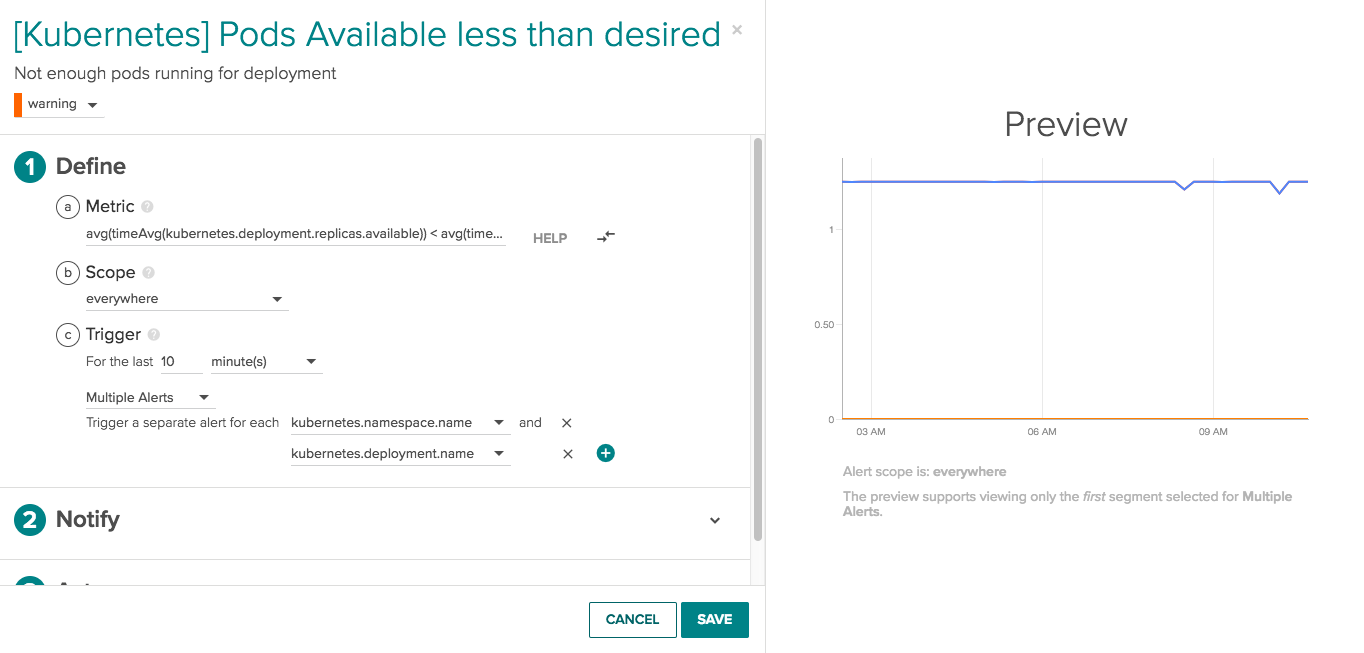
Pods available are less than desired: Let’s say you’ve built a java app and have specified a policy for pods desired = 4 per deployment. You can set an alert to be notified if for a period of time – say 10 minutes – the number of pods in the deployment drops and remains below 4. In this state, the danger is that your app performance is degraded or not running at the redundancy required. By receiving a notification, you are able to proactively investigate what is happening to resolve the issue before it severely impacts your user’s experience. Sysdig’s adaptive alerting will automatically extend this alert to new deployments as they come online, eliminating the need to manually assign new alerts as your environment changes.
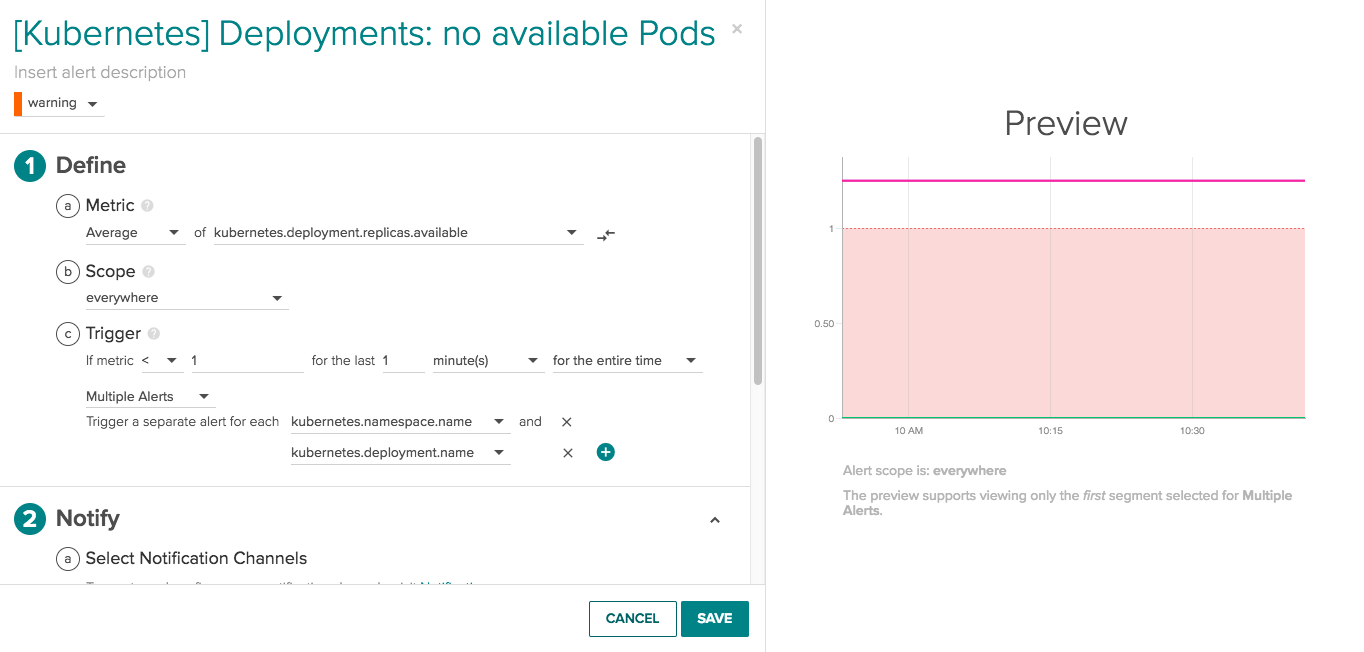
Deployments with no available pods: What if you’ve defined a deployment, but end up with no pods running and available – meaning your app is not serving requests? Getting alerted on this condition means you can spring into action to find and resolve the issue. Is it a cluster issue? Is it a resource issue? Is it a scheduler error? Using the metrics and information available within Sysdig Monitor you can troubleshoot, pinpoint and solve the problem quickly.
Conclusion
Whether you are operating in your own data center or in a public cloud like AWS, GCP, or Azure, we think you’ll find the capabilities of kube-state-metrics extremely useful for monitoring your Kubernetes environment. Existing customers or trial users can get started today – here’s an article from our support site on how. Adding kube-state-metrics is another important milestone for us — we hope you like it!