Have you ever fallen asleep to the sounds of your on-call team in a Zoom call? If you’ve had the misfortune to sympathize with this experience, you likely understand the problem of Alert Fatigue firsthand.
During an active incident, it can be exhausting to tease the upstream root cause from downstream noise while you’re context switching between your terminal and your alerts.
This is where Alertmanager comes in, providing a way to mitigate each of the problems related to Alert Fatigue.
In this article, you will learn:
- What Alert Fatigue is
- What AlertManager is
- Routing
- Inhibition
- Silencing and Throttling
- Grouping
- Notification Template
Alert Fatigue
Alert Fatigue is the exhaustion of frequently responding to unprioritized and unactionable alerts. This is not sustainable in the long term. Not every alert is so urgent that it should wake up a developer. Ensuring that an on-call week is sustainable must prioritize sleep as well.
- Was an engineer woken up more than twice this week?
- Can the resolution be automated or wait until morning?
- How many people were involved?
Companies often focus on response time and how long a resolution takes but how do they know the on-call process is not contributing to burn out?
| Pain Point | Feature | Alertmanager |
| Send alerts to the right team | Routing | Labeled alerts are routed to the corresponding receiver |
| Too many alerts at once | Inhibition | Alerts can inhibit other alerts (e.g., Datacenter down alert inhibits downtime alert) |
| False positive on an Alert | Silencing | Temporarily silence an alert, especially when performing scheduled maintenance |
| Alerts are too frequent | Throttling | Customizable back-off options to avoid re-notifying too frequently |
| Unorganized alerts | Grouping | Logically group alerts by labels such as ‘environment=dev’ or ‘service=broker’ |
| Notifications are unstructured | Notification Template | Standardize alerts to a template so that alerts are structured across services |
Alertmanager
Prometheus Alertmanager is the open source standard for translating alerts into alert notifications for your engineering team. Alertmanager challenges the assumption that a dozen alerts should result in a dozen alert notifications. By leveraging the features of Alertmanager, dozens of alerts can be distilled into a handful of alert notifications, allowing on-call engineers to context switch less by thinking in terms of incidents rather than alerts.
Routing
Routing is the ability to send alerts to a variety of receivers including Slack, Pagerduty, Opsgenie, and email. It is the core feature of Alertmanager.
route:
  receiver: slack-default            # Fallback Receiver if no routes are matched
  routes:
    - receiver: pagerduty-logging
      continue: true
    - match:
      team: support
      receiver: jira
    - match:
      team: on-call
      receiver: pagerduty-prodCode language: YAML (yaml)
Here, an alert with the label {team:on-call} was triggered. Routes are matched from top to bottom with the first receiver being pagerduty-logging, a receiver for your on-call manager to track all alerts at the end of each month. Since the alert does not have a {team:support} label, the matching continues to {team:on-call} where the alert is properly routed to the pagerduty-prod receiver. The default route, slack-default, is specified at the top of the routes, in case no matches are found.
Inhibition
Inhibition is the process of muting downstream alerts depending on their label set. Of course, this means that alerts must be systematically tagged in a logical and standardized way, but that’s a human problem, not an Alertmanager one. While there is no native support for warning thresholds, the user can take advantage of labels and inhibit a warning when the critical condition is met.
This has the unique advantage of supporting a warning condition for alerts that don’t use a scalar comparison. It’s all well and good to warn at 60% CPU usage and alert at 80% CPU usage, but what if we wanted to craft a warning and alert that compares two queries? This alert triggers when a node has more pods than its capacity.
(sum by (kube_node_name) (kube_pod_container_status_running)) >
on(kube_node_name) kube_node_status_capacity_pods
We can do exactly this by using inhibition with Alertmanager. In the first example, an alert with the label {severity=critical} will inhibit an alert of {severity=warning} if they share the same region, and alertname.
In the second example, we can also inhibit downstream alerts when we know they won’t be important in the root cause. It might be expected that a Kafka consumer behaves anomalously when the Kafka producer doesn’t publish anything to the topic.
inhibit_rules:
  - source_match:
      severity: 'critical'
    target_match:
      severity: 'warning'
    equal: ['region','alertname']
  - source_match:
      service: 'kafka_producer'
    target_match:
      service: 'kafka_consumer'
    equal: ['environment','topic']
Code language: YAML (yaml)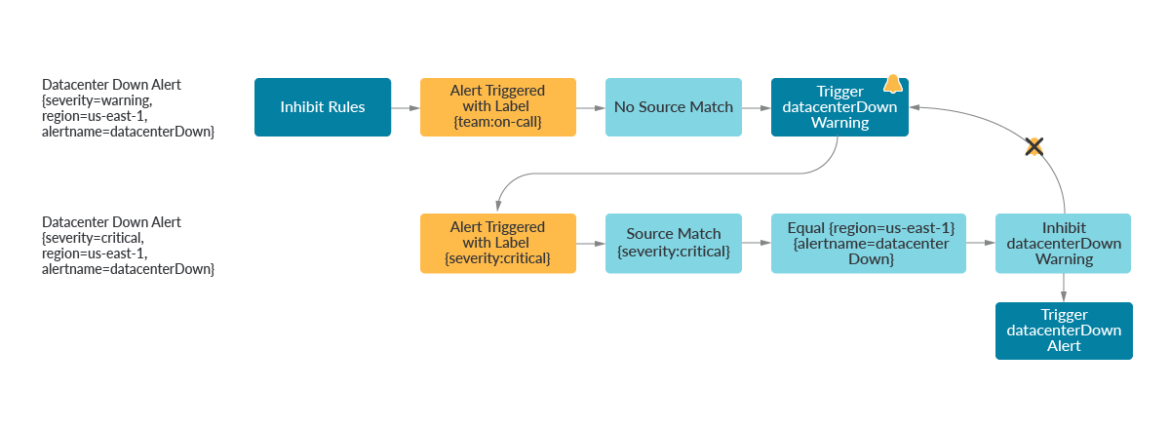
Silencing and Throttling
Now that you’ve woken up at 2 a.m. to exactly one root cause alert, you may want to acknowledge the alert and move forward with remediation. It’s too early to resolve the alert but alert re-notifications don’t give any extra context. This is where silencing and throttling can help.
Silencing allows you to temporarily snooze an alert if you’re expecting the alert to trigger for a scheduled procedure, such as database maintenance, or if you’ve already acknowledged the alert during an incident and want to keep it from renotifying while you remediate.
Throttling solves a similar pain point but in a slightly different fashion. Throttles allow the user to tailor the renotification settings with three main parameters:
- group_wait
- group_interval
- repeat_interval
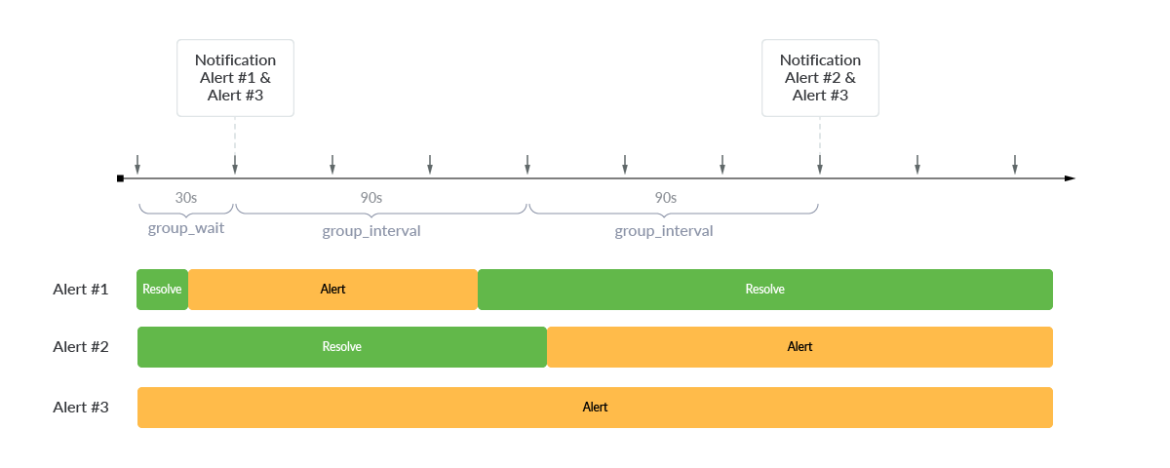
When Alert #1 and Alert #3 are initially triggered, Alertmanager will use group_wait to delay by 30 seconds before notifying. After an initial alert has been triggered, any new alert notifications are delayed by group_interval . Since there was no new alert for the next 90 seconds, there was no notification. Over the subsequent 90 seconds however, Alert #2 was triggered and a notification of Alert #2 and Alert #3 was sent. In order to not forget about the current alerts if no new alert has been triggered, repeat_interval can be configured to a value, such as 24 hours, so that the currently triggered alerts send a re-notifications every 24 hours.
Grouping
Grouping in Alertmanager allows multiple alerts sharing a similar label set to be sent at the same time- not to be confused with Prometheus grouping, where alert rules in a group are evaluated in sequential order. By default, all alerts for a given route are grouped together. A group_by field can be specified to logically group alerts.
route:
  receiver: slack-default            # Fallback Receiver if no routes are matched
  group_by: [env]
  routes:
    - match:
        team: on-call
      Group_by: [region, service]
      receiver: pagerduty-prod
Code language: YAML (yaml)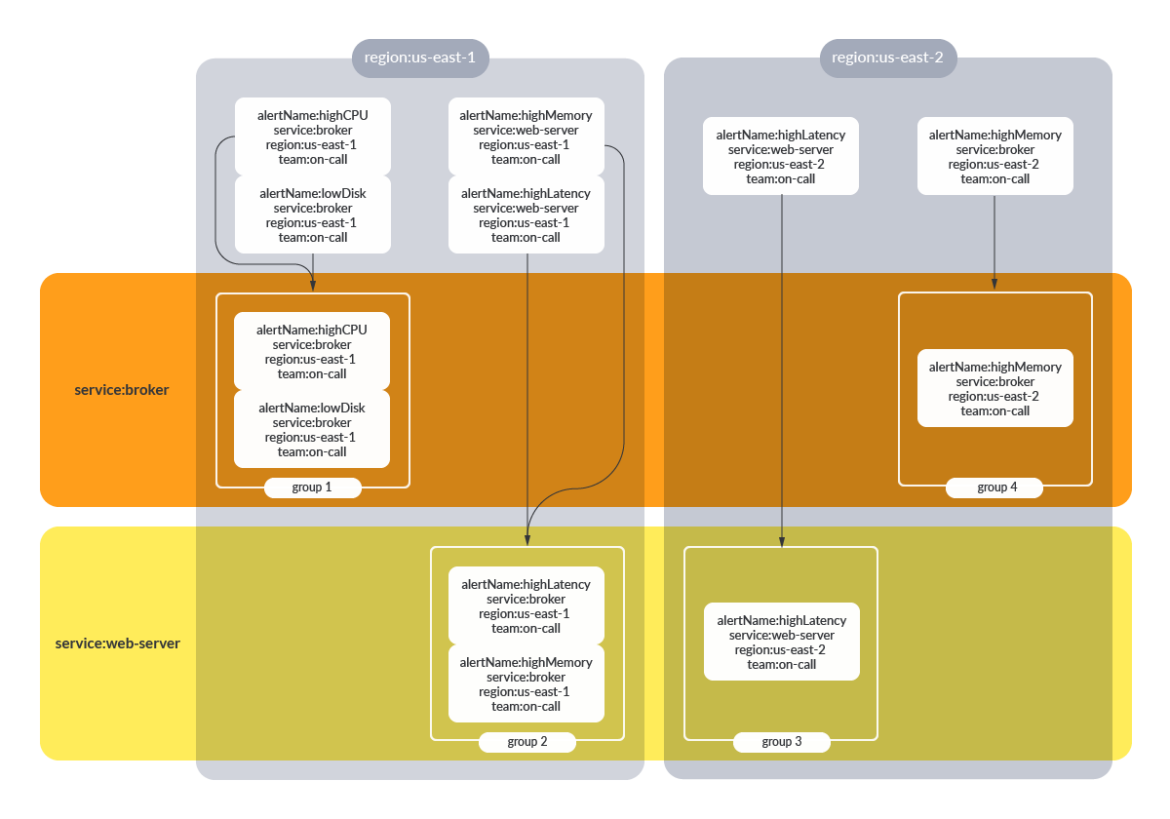
Alerts that have the label {team:on-call} will be grouped by both region and service. This allows users to immediately have context that all of the notifications within this alert group share the same service and region. Grouping with information such as instance_id or ip_address tends to be less useful, since it means that every unique instance_id or ip_address will produce its own notification group. This may produce noisy notifications and defeat the purpose of grouping.
If no grouping is configured, all alerts will be part of the same alert notification for a given route.
Notification Template
Notification templates offer a way to customize and standardize alert notifications. For example, a notification template can use labels to automatically link to a runbook or include useful labels for the on-call team to build context. Here, app and alertname labels are interpolated into a path that links out to a runbook. Standardizing on a notification template can make the on-call process run more smoothly since the on-call team may not be the direct maintainers of the microservice that is paging.
receivers:
- name: 'slack-notifications'
  slack_configs:
  - channel: '#alerts'
    text: 'https://internal.myorg.net/wiki/alerts/{{ .GroupLabels.app }}/{{ .GroupLabels.alertname }}'
Code language: YAML (yaml)
Manage alerts with a click with Sysdig Monitor
As organizations grow, maintaining Prometheus and Alertmanager can become difficult to manage across teams. Sysdig Monitor makes this easy with Role-Based Access Control where teams can focus on the metrics and alerts most important to them. We offer a turn-key solution where you can manage your alerts from a single pane of glass. With Sysdig Monitor you can spend less time maintaining Prometheus Alertmanager and spend more time monitoring your actual infrastructure. Come chat with industry experts in monitoring and alerting and we’ll get you up and running.
Sign up now for a free trial of Sysdig Monitor


