Operations teams seem to have a love-hate relationship with alerting solutions. You
love being notified the minute abnormal behavior or poor performance springs up inside your environment. But you
hate being overwhelmed with too many alerts, too much noise. Even “accurate” alerts often that lack the context needed to quickly identify root cause. You’re left having to sort through a broad stack of opaque services and technologies to try to find the bottlenecks.
And as we all know, the problem’s only getting worse: environments are getting more complex every day. Service oriented architectures, migration to cloud environments, and the introduction of containers into technology stacks means environments are being built on concepts that didn’t even exist a few short years ago.
Over the past 12 months at Sysdig, we’ve talked to hundreds of IT organizations around the world about alerting. It is clear: current alerting solutions are not keeping up with the huge advances being made in operations engineering. Today it is my pleasure to announce the our new solution for alerting in the modern era:
Intelligent Alerting.
Sysdig’s Intelligent Alerting
Sysdig’s intelligent alerting provides operations teams an easy and intuitive way to control how alerts are implemented. Our alerting engine is provided to you with no additional configuration or plugins required, simply install our agent on your host machines and we immediately provide visibility into all aspects of your infrastructure (servers, applications, network, containers, and databases) and allow you to alert on your infrastructure in a number of different ways:
- Self-learning baselines continuously predict the normal performance of your system in order to automatically alert on anomalies.
- Group-based comparisons automatically monitor the behavior of clusters of machines and alert when any node deviates from the standard behavior of the group.
- Manual thresholding allows you to define your own fine-grained alerts with highly configurable conditions on all the different metrics automatically collected from across your application stack.
Before I walk through some examples, I’d like to highlight the principles that make our alerting unique:
Fine-grained
Sysdig Monitor alerts offer an unprecedented range of specificity, from high level, dynamic system alerts to deep application monitoring. You can set up alerts on everything from certain tags we’ve imported from AWS, to certain container images that we’ve auto discovered inside your environment, to certain processes running on a node, to even certain network ports, HTTP status codes, or SQL queries. The list goes on and on.
Natural workflow
Sysdig Monitor’s totally unique workflow allows you to automatically create an alert based on any view in the Sysdig UI. You’ve got to try this to believe it, but trust me: creating alerts for complex systems has never been this easy. Because Sysdig naturally understands the logical groupings of your infrastructure, you can easily set alerts that cover hundreds of machines or processes (even those that aren’t running yet!) to get both a macro and micro level view of system performance without needing to manage hundreds of separate alerts. All in just a few clicks. You can also easily tie alerting into your monitoring and troubleshooting process in new and intuitive ways. For example, if you discover some anomalous application behavior in a Sysdig Monitor chart, you can easily create an alert directly from that chart so the system notifies you once that behavior occurs again.
Unified Context
Unlike most alerting systems, Sysdig Monitor doesn’t stop at the alert itself. We go one step further, offering you the full context you need to get to root cause. Sysdig stores the full state of your infrastructure with one-second granularity, so you can pause, rewind, and fast-forward through historical data to rapidly troubleshoot issues once an alert fires. To be clear, this isn’t limited to the scope of the alert – Sysdig stores the entire state of your infrastructure with high granularity so you can see single processes, requests, or network connections in the context of your overall system. No more silo’d toolsets to handle specific areas of your infrastructure: you can monitor, troubleshoot, and alert on all of these parts of your environment with one unified view of system performance.
Use Cases
Let’s dive in and see how easy it is to set up powerful, intelligent alerting inside a distributed environment with Sysdig Cloud!
Here are some example alerting scenarios I’ll walk you through:
- Automatic host comparison
- Automatic baselines
- Container images
- Application errors
- Network connections
- Rapid troubleshooting
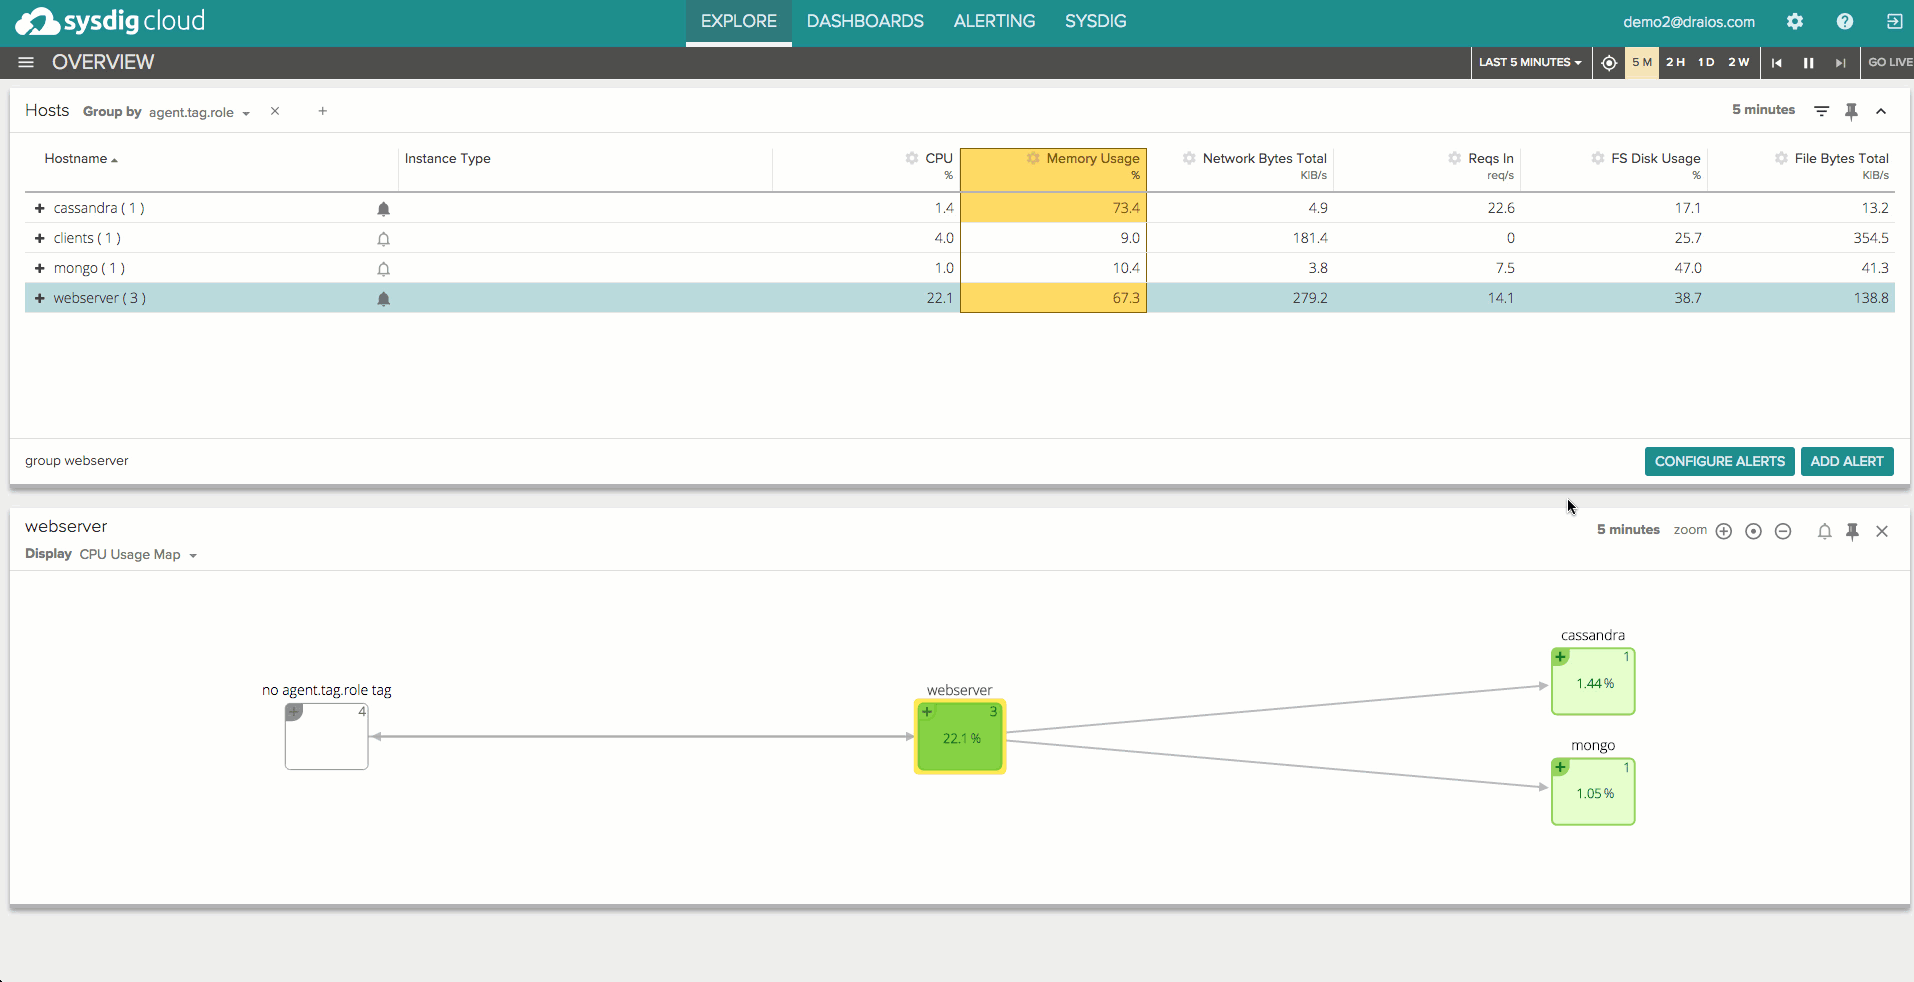
Automatic host comparison
Let’s suppose you have a dynamic group of web servers behind a load balancer, and you expect them to use a similar amount of CPU and have similar disk IOPS performance. Sysdig lets you easily – with 2 clicks – set up an automatic alert that will notify you when the CPU and IOPS for any machine in that group differs significantly from the average performance of the rest of the group. The alert will cover the machines that are currently part of the group, and the ones that will join it in the future, and won’t require specifying any thresholds.
Automatic baselines
Another typical pattern in distributed applications is that some metrics tend to have a periodic behavior, which makes threshold-based alerting impossible to use. For example, the amount of network traffic coming into a production web server tier is usually variable depending on the time of day, but you can expect similar values each Monday morning at 8am. Wouldn’t it be cool to be alerted when a deviation from this expected behavior happens? Our baselining technology will do exactly that, for many metrics, by self-learning the normal performance of an entity, whether it is a process, a container, a host or a whole tier.
Container images
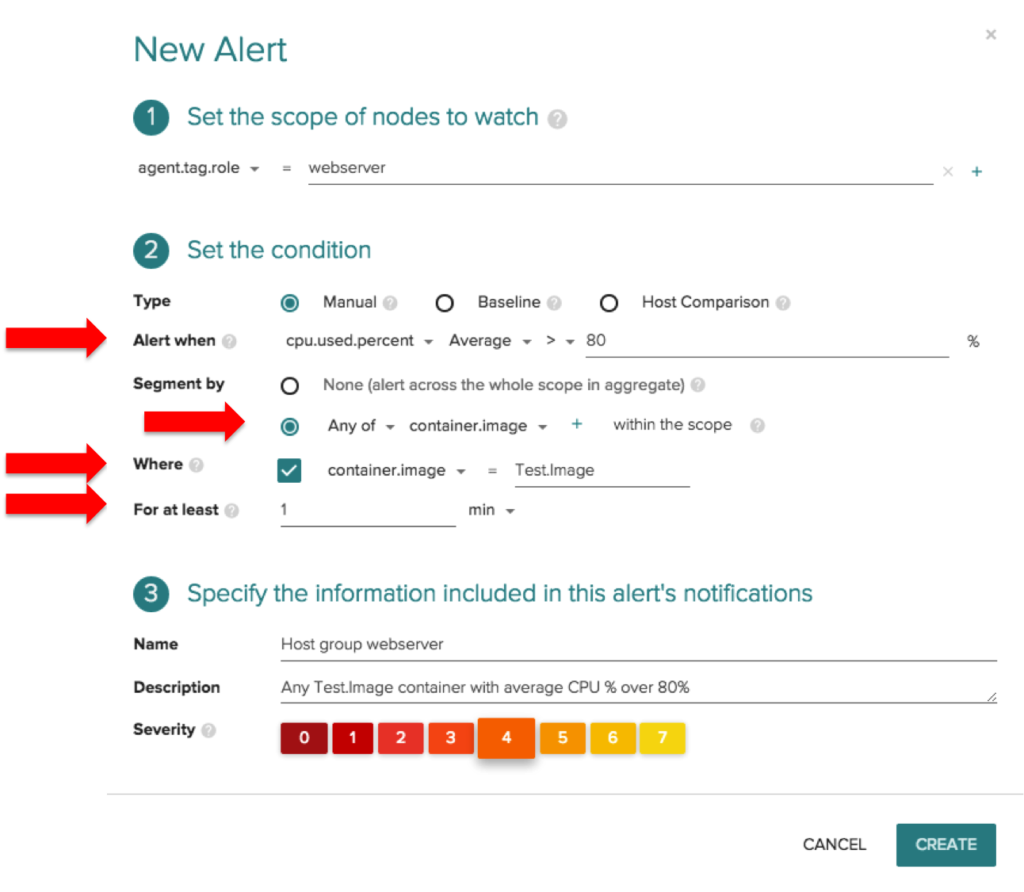
Sysdig has a
revolutionary approach to getting visibility inside containers, which, naturally, enables us to alert on these metrics. What if you wanted to receive an alert when CPU usage was over 80% for at least 1 minute, for any container with a specific image, across only your production webserver tier? That is a lot of variables to deal with and sounds hard to setup. With Sysdig you can configure that policy in a few clicks. Simply define the metric and trigger value (CPU Usage % over 80%), limit the alert to a specific container image (Test.Image) and change the time period to 1 minute. Container alerting has never been easier!
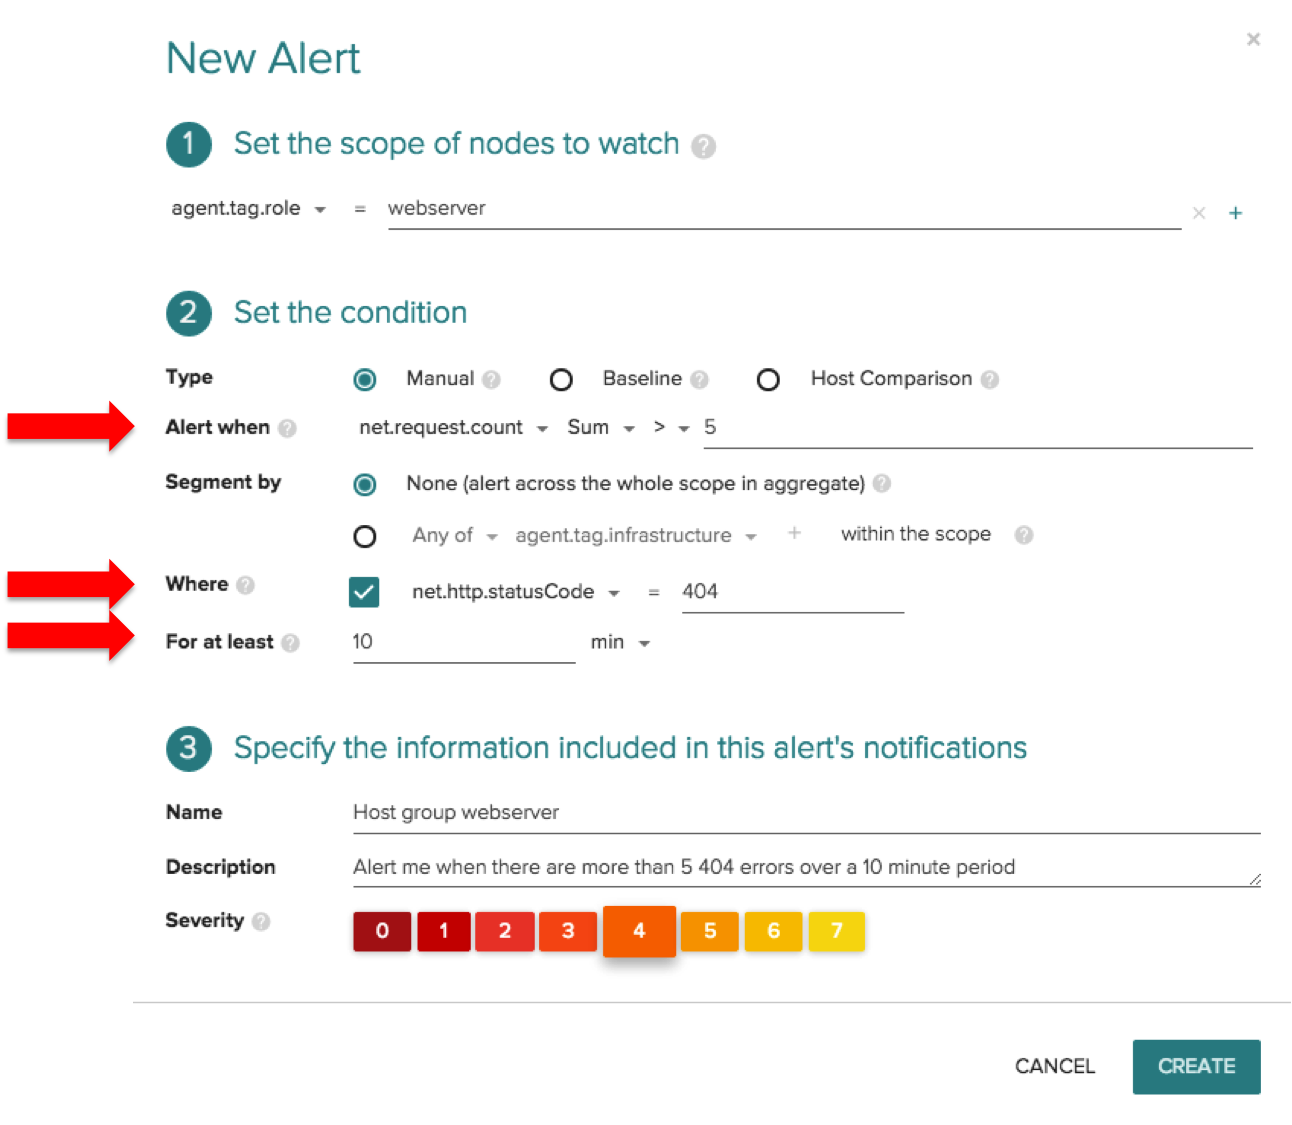
Application errors
Now let’s take a look at alerting on application metrics. What’s great about Sysdig Monitor is that we provide visibility into application metrics without the need to instrument the application code. Let’s create an application-focused alert that fires when there are more than 5 HTTP requests with 404 status codes in the webserver tier over any 10 minute period.
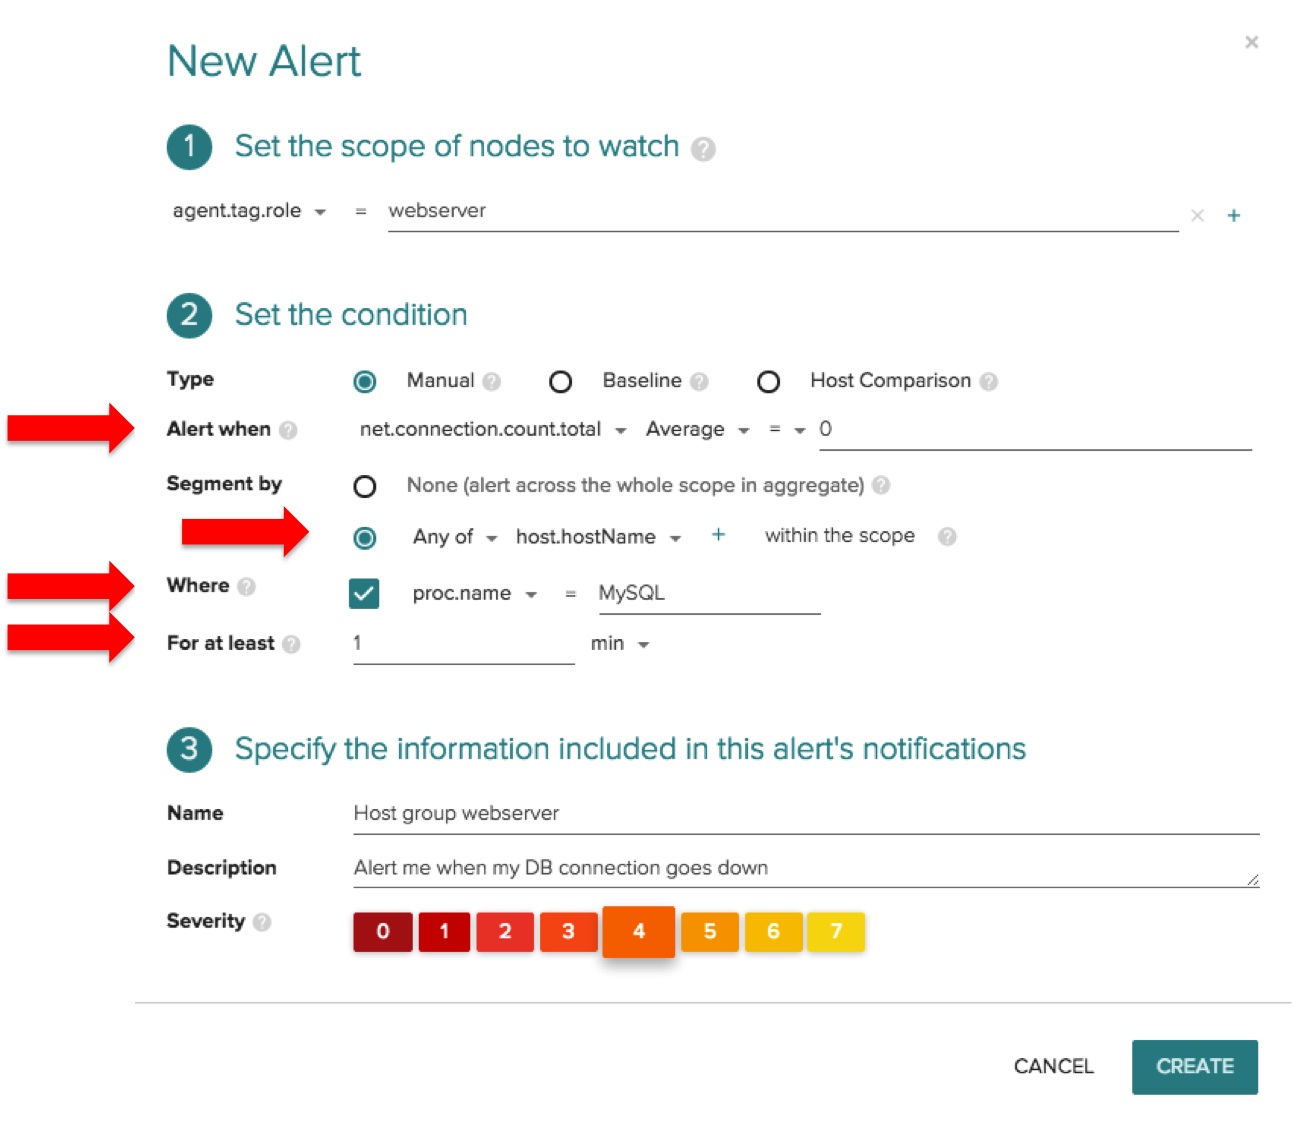
Network connections
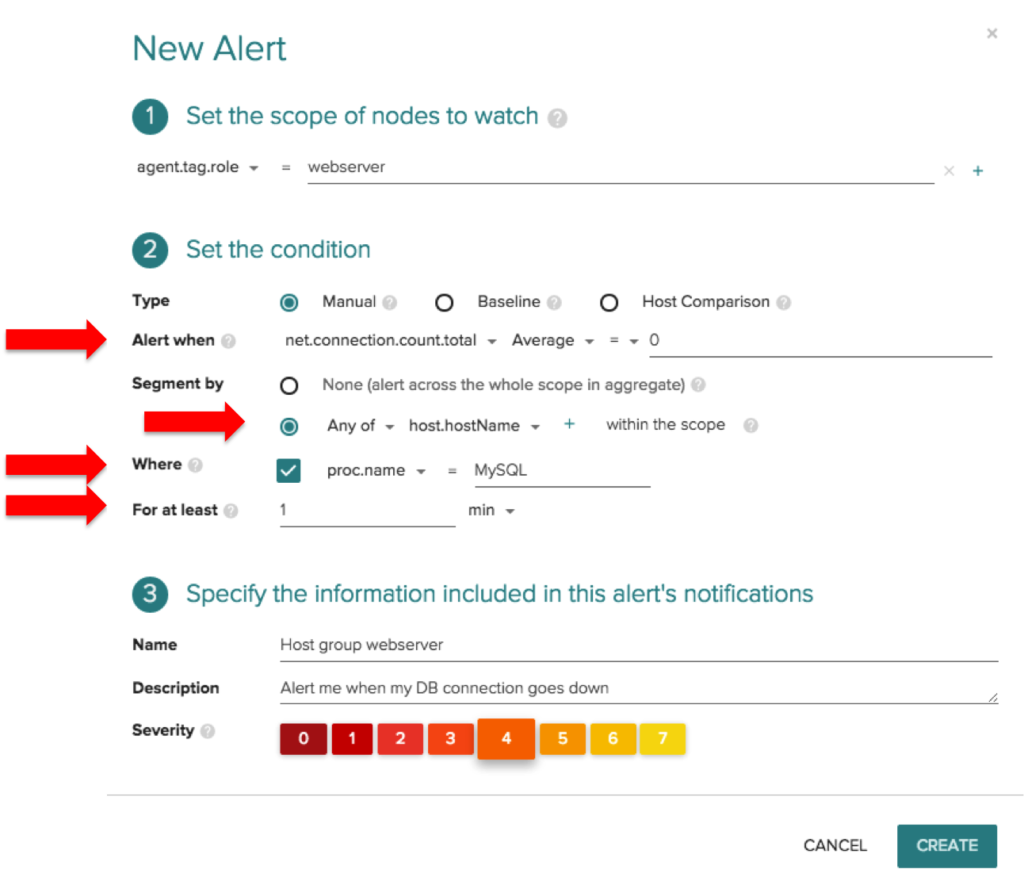
Another example I’ll highlight is an alert for network connections. By leveraging our open source instrumentation technology, Sysdig Monitor can automatically pull in network metrics with no additional configuration needed. In this scenario, let’s create an alert that is triggered when the MySQL network connection goes down for any of my webservers over a one minute timeframe.
Rapid troubleshooting
Being notified as to
WHAT is going on in your environment is helpful, but like I mentioned above, the
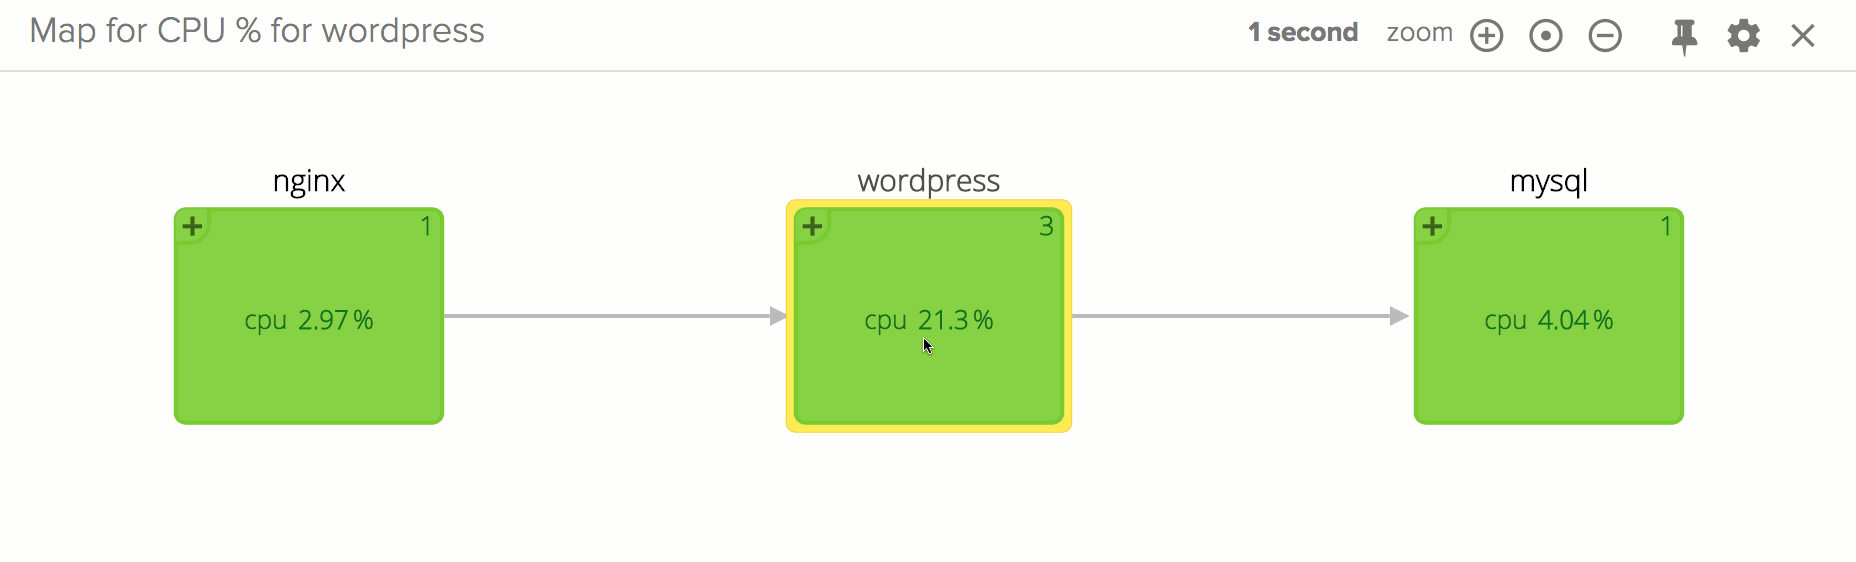
WHY is much more important. Once any of these alerts are triggered, Sysdig Monitor makes it super easy to get the full context around the alert. With a single click, Sysdig Monitor automatically rewinds your whole infrastructure’s state back in time to a period right before the alert was fired so you can play, pause, rewind, and fast-forward your system’s state.
This enables you to investigate what components of your system contributed to the conditions that resulted in the alert firing. Remember, Sysdig Monitor shows you metrics from across your environment and automatically correlates them together in one view so you can quickly identify issues with any component and start the troubleshooting process right away.
Conclusion
As you can see, Sysdig Monitor’s alerting engine offers a good balance between automatic alerts for those that want easy setup and fine-grained custom alerts for those that want more control. We’re proud of the fact that our alerting engine solves real problems for our customers and provides them accurate, customizable notifications for their distributed, containerized environments. To try this alerting functionality out for yourself, sign up for a
free trial of Sysdig Monitor today!