


Falco Feeds extends the power of Falco by giving open source-focused companies access to expert-written rules that are continuously updated as new threats are discovered.

Welcome to the second half of this two-part series focusing on troubleshooting Kubernetes services with sysdig. In the first part, we studied how a Kubernetes service works: in particular, we explored an HTTP transaction across a Kubernetes service, starting from the "magic" DNS resolution done by SkyDNS and followed by the Kubernetes proxy intercepting requests leveraging the Linux Netfilter capabilities and forwarding them to the backend pods.After studying the behavior under normal conditions, we are now ready to troubleshoot some real application failures. The key here is that we now know what ought to be expected from a properly behaving system, because we've thoroughly analyzed it already. As we'll see, this workflow of "troubleshooting by visually spotting differences" will be very powerful.
Scenario #1: Wrong port configuration
Here's the setup: I've now deployed a new Kubernetes cluster with pretty much the exact same application as before in Part 1: two nginx pods with a single Kubernetes service to load balance them. But this is what I get now:root@ubuntu:/# curl my-nginx.default.cluster.local:8080
curl: (52) Empty reply from server
Weird. And the curl error doesn't help me. Through a quick inspection via kubectl, everything seems to be up and running just fine:gianluca@sid:~$ kubectl get pods
NAME READY STATUS RESTARTS AGE
my-nginx-tsyps 1/1 Running 0 2m
my-nginx-wu92j 1/1 Running 0 2m
ubuntu 1/1 Running 0 2m
gianluca@sid:~$ kubectl get services
NAME LABELS SELECTOR IP(S) PORT(S)
my-nginx run=my-nginx run=my-nginx 10.0.0.159 8080/TCP
Let's explore with sysdig what happens under the hood. Once again, I'm going to use the same command lines as before for capturing the system events and reading them during the analysis. For brevity, I'm going to omit the steps of the troubleshooting that match the behavior of the previous use case, jumping right to the core of the issue.Here we can see curl, after having correctly done the DNS resolution, trying to connect to the service virtual IP address (which matches the output of kubectl):41582 13:17:57.400711569 3 curl (18949) > connect fd=3(<4>)
41817 13:17:57.401695929 3 curl (18949) < connect res=-115(EINPROGRESS) tuple=172.17.0.7:50476->10.0.0.159:8080
While curl is connecting to the service, we can see the proxy process accepting the connection (correctly translated by iptables, like before), and the proxy process immediately tries to connect to one of the nginx pods (172.17.0.6), in order to forward traffic to it:41590 13:17:57.400854541 3 hyperkube (7654) < accept fd=9(<4t>172.17.0.7:50476->172.17.42.1:35039) tuple=172.17.0.7:50476->172.17.42.1:35039 queuepct=0 queuelen=0 queuemax=128
41622 13:17:57.401068116 3 hyperkube (7654) > connect fd=10(<4>)
41623 13:17:57.401113733 3 hyperkube (7654) < connect res=-115(EINPROGRESS) tuple=172.17.42.1:58682->172.17.0.6:8080
However, the connection is closed shortly right after:41642 13:17:57.401180860 3 hyperkube (7654) > close fd=10(<4t>172.17.42.1:58682->172.17.0.6:8080)
And we can even see the proxy logging on its standard error (file descriptor 2) a message:41644 13:17:57.401205751 3 hyperkube (7654) > write fd=2(
pipe:[35815]) size=107
41663 13:17:57.401257404 3 hyperkube (7654) < write res=107 data=
E1111 21:17:57.401198 1 proxysocket.go:99] Dial failed: dial tcp 172.17.0.6:8080: connection refused
Do you see why it didn't work? The reason is that the proxy is trying to reach my pods on port 8080, not port 80, where nginx is listening! In this case, I forgot to specify –target-port=80 when declaring my service, so by default Kubernetes used as a target port the same one exposed by the service itself. When things like these happen, troubleshooting can be very painful!
Scenario #2: Wrong labels
Let's try another mystery issue. In this example, curl is giving me the same error as before:root@ubuntu:/# curl my-nginx.default.cluster.local:8080
curl: (52) Empty reply from server
However, what happens under the hood is substantially different. Here we can see the usual step of curl trying to connect to the service virtual IP address:26690 13:40:49.770057107 2 curl (39926) > connect fd=3(<4>)
26759 13:40:49.770500704 2 curl (39926) < connect res=-115(EINPROGRESS) tuple=172.17.0.11:43268->10.0.0.215:8080
But right after accepting the translated connection, the proxy immediately closes the connection, without even attempting to connect to one of my backend pods (like in the previous case):26698 13:40:49.770175853 2 hyperkube (35468) < accept fd=9(<4t>172.17.0.11:43268->172.17.42.1:33919) tuple=172.17.0.11:43268->172.17.42.1:33919 queuepct=0 queuelen=0 queuemax=128
26746 13:40:49.770455105 2 hyperkube (35468) > close fd=9(<4t>172.17.0.11:43268->172.17.42.1:33919)
26747 13:40:49.770455717 2 hyperkube (35468) < close res=0
Why did this happen? This clearly points out a misconfiguration in the Kubernetes service, because the proxy decided that there are no available pods, even though they are clearly here:gianluca@sid:~$ kubectl get pods
NAME READY STATUS RESTARTS AGE
my-nginx-llbe1 1/1 Running 0 24s
my-nginx-p7ooc 1/1 Running 0 13m
ubuntu 1/1 Running 0 13m
It turns out that during the pod creation I made a typo when setting their labels, as I can see by running csysdig:gianluca@sid:~$ sudo csysdig -v kubernetes_pods
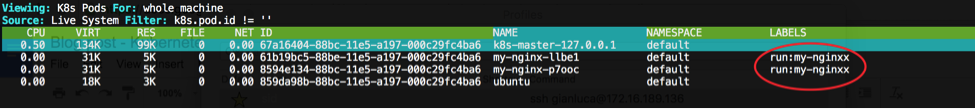
Notice how the selector is looking for "my-nginx" pods, whereas the pod label is "my-nginxx".
Scenario #3: Firewall misconfiguration
This time the error curl gives me is different:root@ubuntu:/# curl my-nginx.default.cluster.local:8080
…
curl: (7) Failed to connect to my-nginx.default.cluster.local port 8080: Connection timed out
A timeout after a couple minutes. It's worth digging in with sysdig to see what happens, the usual way. Here I see curl correctly trying to connect to the service:56039 15:48:56.154725448 2 curl (69746) > connect fd=3(<4>)
56040 15:48:56.154883625 2 curl (69746) < connect res=-115(EINPROGRESS) tuple=172.17.0.19:46320->10.0.0.226:8080
But this is pretty much the only thing that happens. The proxy doesn't seem to receive any incoming connection or do any network traffic like we've seen in the previous cases, so it definitely can't forward any request to the backend pods. It seems almost as if there was a system misconfiguration in iptables and the routing logic for the virtual IP address wasn't there. Let's check:# iptables -t nat -L
Chain KUBE-NODEPORT-CONTAINER (0 references)
target prot opt source destination
Chain KUBE-NODEPORT-HOST (0 references)
target prot opt source destination
Chain KUBE-PORTALS-CONTAINER (0 references)
target prot opt source destination
Chain KUBE-PORTALS-HOST (0 references)
target prot opt source destination
Completely empty! No wonder curl gives me a timeout error, since it is actually trying to reach a real host with IP address 10.0.0.226 somewhere according to my network routing table, which obviously doesn't exist. The culprit here is a custom script that I ran that flushes all the iptables rules and, although Kubernetes recreates them periodically to ensure long term consistency, when I ran curl I was still in this vulnerable time window and the traffic wasn't intercepted by the proxy. The solution here is to tweak my script to not be so disruptive and avoid flushing iptables rules for the Kubernetes chains!
Scenario #4: Accessing a service from the host
So far I've been accessing the service using a client pod running inside Kubernetes itself. Sometimes it might be convenient to access the service directly from the host. This is what happens if I run the same curl command from my host:gianluca@sid:~/infrastructure/test-infrastructures/kubernetes-demo$ curl my-nginx.default.cluster.local:8080
..
curl: (7) Failed to connect to my-nginx.default.cluster.local port 8080: Connection refused
After a couple minutes, curl returns this error. Using sysdig, here we have curl connecting to the DNS server, and receiving a reply from it:22611 16:15:46.985067704 0 curl (91366) < connect res=0 tuple=172.16.189.136:47319->172.16.189.2:53
...
22623 16:15:46.987606830 1 curl (91366) < recvfrom res=103 data=
0x0000: 584d 8180 0001 0001 0001 0001 086d 792d XM...........my-
0x0010: 6e67 696e 7807 6465 6661 756c 7407 636c nginx.default.cl
0x0020: 7573 7465 7205 6c6f 6361 6c00 0001 0001 uster.local.....
0x0030: c00c 0001 0001 0000 0005 0004 ac1e 0001 ................
0x0040: 0000 0200 0100 0000 0500 0c03 6e73 3102 ............ns1.
0x0050: 6b61 036c 7476 00c0 4b00 0100 0100 0000 ka.ltv..K.......
0x0060: 0500 04ac 1b01 01 .......
tuple=172.16.189.2:53->172.16.189.136:47319
But this is clearly wrong, notice how there isn't any activity from the skydns process, as we've seen before, and yet curl received a DNS response. Obviously curl is contacting another DNS server, 172.16.189.2, which is the one offered by my provider. In fact, curl then tries to connect to a totally random host on another network:22676 16:15:46.989700389 1 curl (91366) > connect fd=4(<4>)
22677 16:15:46.989707967 1 curl (91366) < connect res=0 tuple=172.16.189.136:40960->172.30.0.1:8080
This will eventually fail because that host either does not exist or is just letting all connections on port 8080 timeout. Correlating this with the previous normal baseline behavior, I can see that skydns listens to requests on localhost (:::53 in the initial trace), and so the fix is as simple as adding "nameserver 127.0.0.1" to my /etc/resolv.conf file, and trying again:gianluca@sid:~$ curl my-nginx.default.cluster.local:8080
< !DOCTYPE html>