


Falco Feeds extends the power of Falco by giving open source-focused companies access to expert-written rules that are continuously updated as new threats are discovered.

Observability in serverless computing environments, such as AWS Lambda, has always been a challenge. The pure nature of serverless environments has meant that traditional observability tools can be at a slight disadvantage due to the following issues:
- Serverless computing typically does not require nor offer a static runtime environment
- The ephemeral nature of serverless functions,
- The micro-duration often seen with the execution of functions
- The distributed nature of when and where serverless functions are executed
Cloud providers often export the equivalent of control plane metrics for serverless functions by exposing runtime metrics such as invocations, concurrency, duration, error count, etc, but access to those metrics has historically come at a literal cost in consumption and latency. Enter the newly announced AWS Lambda Telemetry API which aims to address both problems by giving direct access to serverless function metrics at runtime.
AWS Lambda 101
AWS Lambda is a serverless service, allowing you to run code (or functions) on-demand without the need to provision runtime environments (such as AWS EC2, AWS EKS, Kubernetes, etc). AWS Lambda function support ranges from very straightforward functions – a Hello World Python script, for example, which when invoked simply return the ubiquitous "Hello World" via HTTP along with an HTTP 200 response code – to the ability to directly integrate with additional AWS services as functions such as using Lambda ones to build and execute AWS Alexa skills. For more information on AWS Lambda services, please visit the AWS Lambda services home page.
Although AWS Lambda does not require a pre-configured runtime, Lambda functions do still run in an execution environment. This execution environment also allows you to attach external code, tools, and post-processors, called Lambda Layers, to Lambda functions in that same runtime environment. Lambda Layers is a highly flexible system for acting on both the outcome of a Lambda function as well as actions around the execution of that function, such as extracting control plane events from the execution of each Lambda function.
Sysdig Monitor Lambda Extension
Today AWS announced the availability of the AWS Lambda Telemetry API, which gives providers such as Sysdig the ability to create specific telemetry tools which run alongside the respective Lambda functions, packaged as Lambda Layers. These tools, or extensions, can be attached to each Lambda function to consume telemetry data, such as function events, function start time, function end-time, function errors, etc. When a Lambda function executes, the extension will be executed along with that function.
Along with the general availability of AWS Lambda Telemetry API, Sysdig is excited to announce preview availability of the Sysdig Monitor Lambda Extension for AWS Lambda Telemetry API. This tool will allow Sysdig to generate and collect real-time metrics based on event data coming from each individual Lambda function and push those metrics directly into your Sysdig Monitor account. That allows you to consume near real-time serverless metrics along with your other core observability metrics.
How does it work?
The Sysdig Monitor Extension for AWS Lambda generates four metrics which are critical for monitoring a serverless control plane environment:
- aws_lambda_invocations
- aws_lambda_duration
- aws_lambda_postruntime_extensions_duration
- aws_lambda_errors
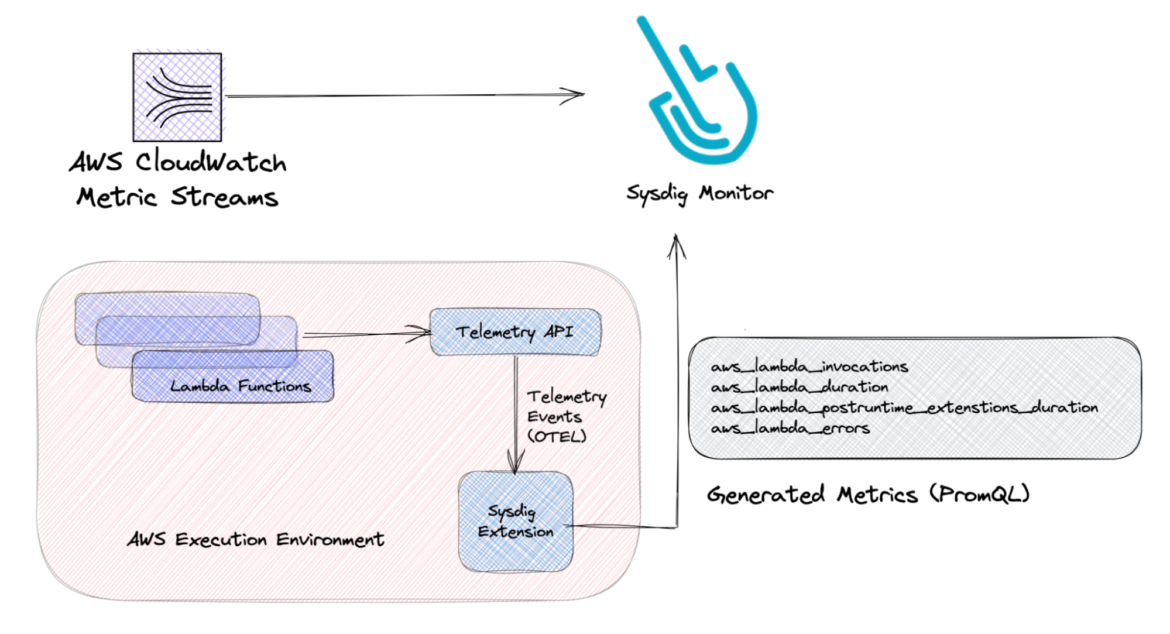
The AWS Lambda Telemetry API allows Sysdig to plug directly into the event stream from Lambda functions.
It pushes Lambda function events in a format compatible with OpenTelemetry events for consumption by other extensions, so that observability tools can natively ingest those events and, in Sysdig's case, convert them into actionable metrics.
Given that this is a real-time architecture, events are generated every time a Lambda function is executed, resulting in immediate access to Lambda events at runtime in an OTEL-compatible format. As Lambda functions are invoked, events are triggered and exposed via the Telemetry API, allowing Sysdig to consume those events directly per-function at execution time of each function. As Sysdig consumes those events, real-time metrics, such as invocation count and function duration, are generated and pushed to the Sysdig Monitor platform.
The result is lower latency in receiving metrics from Lambda functions, something that is critical in high-volume function workloads and environments. If you have a low-latency requirement for a system where other components may depend on the outcome of Lambda function events, the ability to funnel those events into a real-time observability stack, like Sysdig Monitor, is critical. By deploying the Sysdig Monitor Extension for AWS Lambda Telemetry API, users can immediately plug into that real-time event stream and lower the latency of receiving metrics into the observability stack.
For Sysdig Monitor users who are already ingesting metrics from AWS CloudWatch Metric Streams, the addition of metrics generated from the AWS Lambda Telemetry API gives access to very specific Lambda metrics at a much lower latency and a much greater fidelity. The list of metrics generated from the Lambda Telemetry API is not meant to be exhaustive nor to match the complete list of metrics available when streaming AWS Lambda metrics through AWS CloudWatch Metric Streams, but rather provide a highly focused list of critical metrics for real-time function monitoring.
For customers who may not wish to consume metrics through AWS CloudWatch Metric Streams, direct access to these critical Lambda function metrics through the Telemetry API and via the Sysdig Monitor extension can provide the required observability in near real-time with simplified instrumentation.
For more information, check the official documentation
Sysdig Monitor Extension benefits
The goal of any observability tool is to drive lower MTTR with greater flexibility throughout the observability stack…in other words, get as close to the event source as possible in as little time as possible. With the preview availability of the Sysdig Monitor Extension for AWS Lambda Telemetry API, Sysdig users will immediately see the following benefits:
Simplified Instrumentation
By exposing platform metrics available directly via the Telemetry API, Sysdig users have a more direct path for ingesting critical Lambda serverless metrics into the Sysdig Monitor platform. This leads to lower latency and lower MTTR for real-time serverless functions.
By default, the Sysdig Monitor Extension for AWS Lambda Telemetry API will push event-generated metrics to the Sysdig Monitoring platform at a cadence of every 10 seconds, as opposed to the normal cadence of AWS Lambda metrics through AWS CloudWatch Metric Streams, which is one minute. Quicker access to function state allows lower MTTR for Lambda functions, which becomes critical for real-time event-driven systems.
Enhanced observability
The AWS Lambda Telemetry API provides deeper insights into the runtime performance and phases of the Lambda execution environment lifecycle (initialization, invocation, etc). By generating metrics based on real-time events via the Telemetry API, Sysdig provides greater insight into the performance and states of AWS Lambda functions:
- Better cold start visibility (through events related to init phase)
- Understanding initialization success and behavior (during init phase)
- Visibility into issues which often occur during the invoke phase due to timeout/reset (through "phase" visibility on init events).
OpenTelemetry (OTEL) compatibility
Today, Sysdig supports the OTEL format implemented by AWS CloudWatch Metric Streams natively, receiving JSON-formatted metrics directly from AWS Kinesis Firehose and converting the metrics information contained in that data format into Prometheus-native metrics. With the addition of the Sysdig Monitor Lambda Extension, Sysdig extends that support to real-time events generated from Lambda functions by the AWS Lambda Telemetry API. The OTEL-compatible Sysdig Monitor Extension easily and efficiently consumes Lambda events via the Telemetry API to gather insights for Lambda function execution and environments.
Greater Flexibility
The Sysdig Monitor Extension for AWS Lambda is designed to augment the ingestion of the full metrics suite provided by AWS Lambda via AWS CloudWatch Metric Streams. It can also be used to ingest only the invocation-level metrics required for real-time monitoring of AWS Lambda functions, giving you the flexibility to choose the types of metrics you want to collect and from which source.
Availability
The Sysdig Monitor Extension for AWS Lambda Telemetry API is currently available in Preview mode. For more information on how to access, install, configure, and use the extension, please visit https://aws.amazon.com/blogs/compute/introducing-the-aws-lambda-telemetry-api/
You can try it for free right now by signing up for a 30 day trial and choosing an AWS region during the sign-up process.