


Falco Feeds extends the power of Falco by giving open source-focused companies access to expert-written rules that are continuously updated as new threats are discovered.

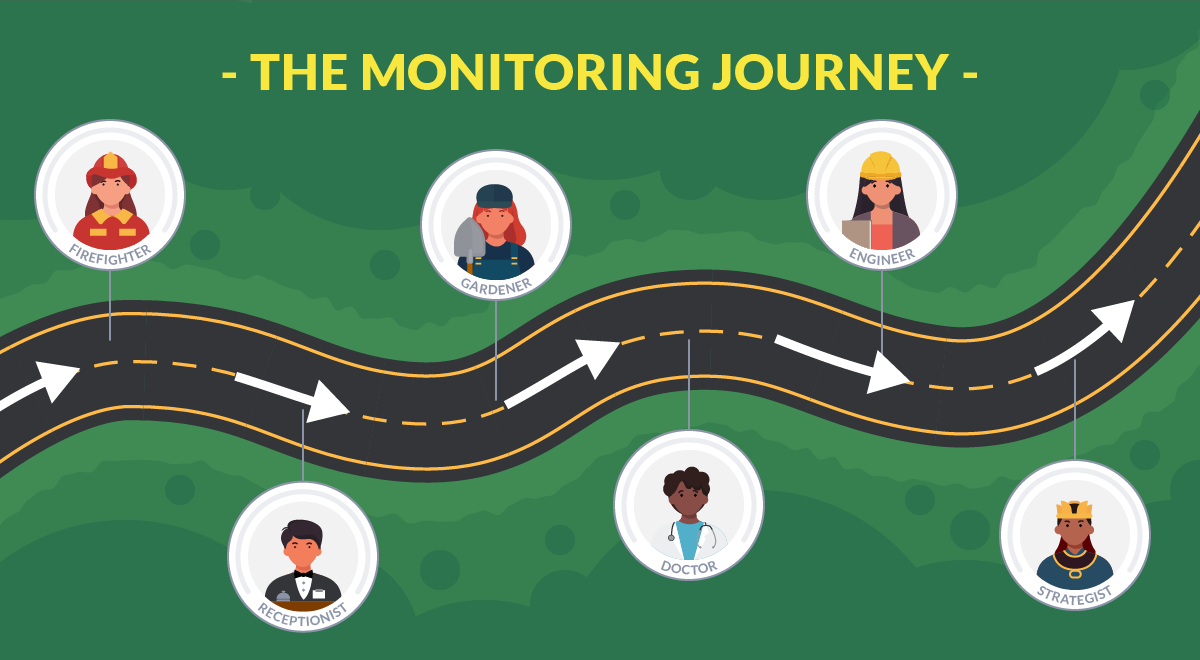
Monitoring is not a goal, but a path. Depending on the maturity of your project, it can be labeled in one of these six steps of the cloud monitoring journey. You will find best practices for all of them and examine what companies get from each one.
From classic virtual machines to large Kubernetes clusters or even serverless architectures, companies have adopted the cloud as a mainstream way to provide their online services. As part of their business strategy, cloud monitoring helps these companies to ensure a quality of service (QoS), solve problems, and eventually get cost efficiency.
However, the large number of companies that implement cloud monitoring offers a wide range of approaches. How deep the cloud monitoring is, depends on both the service each company provides and the experience and maturity of their technical departments.
This article will illustrate six phases of monitoring maturity:
- 🧑🚒 Firefighter: No monitoring at all and the actions are reactive to problems.
- 🛎️ Receptionist: Blackbox monitoring of applications.
- 🌱 Gardener: Monitoring resources like CPU, memory, or disk.
- 🩺 Doctor: Seeing inside third-party applications to tune and predict issues.
- 🧑🔬 Engineer: Crafting your own metrics in business and internal applications.
- 💲 Strategist: Metrics are used by other departments, like financial or legal.
Firefighter phase
When moving to the cloud, many companies start with no cloud monitoring at all.
This is the first stage where there is not a clear monitoring strategy and the incidents in availability, downtimes, and quality of services are the main drivers of the actions of the engineering department.
During this phase, the company adopts new technologies, gains experience, and has the opportunity to plan the next step and the tools that it will use for cloud monitoring.

Some best practices of this phase are:
- Invest in a solid backup and disaster recovery strategy to minimize downtimes.
- Have staging environments to test new versions or applications in near-production environments to minimize possible disruption of services.
- Automating tests and increasing the test coverage and integration tests to prevent malfunctions or errors in new releases.
However, the main downside of this first phase is that the failures or downtimes are not automatically reported to the engineering department. They can be detected easily during office hours, but it is possible to have long periods of unavailability if no one reports it during weekends or nights.
Also, the impossibility of quick detection of degradation of services or failures prevents the company from using canary deployments or red-blue deployments strategies. This affects the development cycles, making them longer and conservative, forcing conservative strategies over more agile and faster approaches.
Receptionist phase
This is the first phase of cloud monitoring where some monitoring is in place. The monitoring in this stage has a black-box approach, seeing the infrastructure, services, and applications from the outside. The focus is to alert on downtimes, failures, and issues that directly affect the availability of the business.
Some of the best practices in this stage include setting up monitoring services to track the availability of virtual machines, open ports, response time, or connection errors. With this information, the engineering department now receives alerts when there is a problem. Also, the engineering team tries to use the Golden Signals framework to define what to look for in the cloud monitoring system that they implement.
The company can now organize the IT department and evolve it into something closer to DevOps philosophy. Teams can coordinate on-call rotation cycles, and even if it is still a reactive strategy, the availability and reliability of the services offered by the company improve greatly.
The new cloud monitoring allows development engineers and site reliability engineers (SRE) to implement faster development cycles, with canary releases to test new features without affecting the overall availability of the service. This has a business impact on the whole company which can now deliver new functionalities faster and safer.
Gardener phase
The gardener phase of the cloud monitoring journey is a natural evolution of the previous one. The engineering team that has to solve the availability issues of the machines, services, and applications start to see them like plants: "If they have enough resources, they should be ok."
In the case of plants, resources are light, water, and soil, while in the case of cloud deployments, the resources usually are CPU, memory, disk, and networking.

Even if applications and services are still seen as black boxes in this stage, monitoring not only the outputs but also the inputs that they receive allows to troubleshoot the issues that can appear better and faster, and even anticipate and prevent potential problems, like lack of space in disks, low capacity in machines, or correct dimension of services.
In this phase, the roles of cloud architect or solution architect appear, and there are two best practices that the new cloud monitoring capabilities unblock. The first one is capacity planning, used to correctly dimension and foresee the capacity needed in the future based on number of users, usage, or other parameters.
The second new practice available in this stage is the dynamic sizing of resources. This is available in different layers of cloud technologies, from groups of virtual machines that create or destroy instances depending on the usage, to horizontal pod autoscaling (HPA) strategies in Kubernetes clusters.
Doctor phase
This phase represents a fundamental change in the philosophy of cloud monitoring.
The applications and services are no longer black boxes and the engineering team starts to collect custom metrics from them the same way doctors use X-rays to see inside the body.

The application custom metrics allow the specialization of the SRE team, which can now tune services such as databases, caches, or web servers to improve their performance and prevent failures.
The cloud monitoring solutions that were trying to guess the saturation of a service can now look inside it and check the hit rate of a cache or buffer, the available connections, or any other internal metric that can alert the SREs before the problem affects the customers and the business.
Engineer phase
After some time using custom metrics of third-party applications, the engineering team starts to miss this transparency in their own applications.
Engineers in this phase are able to instrument their in-house applications with custom metrics, taking advantage of do-it-yourself metrics to refine, tune, and troubleshoot their own applications.

They will get an at-glance overview of the health state of their environments and applications, being able to identify root causes better, monitor the efficiency of the whole system, and take action. To do that, they leverage the different libraries for instrumenting code in different technologies, like Prometheus, OpenTelemetry, or others.
The best practice to adopt in this phase is the adoption of instrumentation of metrics as part of the design of new features and modules, involving the SREs that will maintain and troubleshoot the applications in the definition of the metrics that the applications will expose. This way, the design and product teams are also part of the observability strategy of the company.
Strategist phase
Being able to get a full overview of the infrastructure and the applications can turn into a benefit for the whole company. Plus, if this visibility is accompanied by visibility into costs and correlated with it, magic happens.
In the Strategist phase, technical infrastructure translates into a FinOps efficiency machine with impacts on all organizational levels.
FinOps teams can see how better monitoring brings cost optimization: the lack of visibility on the infrastructure and applications doesn't allow them to make informed decisions. In the long term, it means not really knowing what areas can be improved, the processes that generate issues, and the efficiency of connected applications.
The legal department, on their side, can also create Service Level Agreements and keep track of their accomplishment, with an impact on customer satisfaction levels. SLA agreements are only possible with a mature monitoring system that gives transparency to the customers and users.
As we can see in this final stage, more departments, like finance and legal, actively use and leverage monitoring. This means that they need to be involved in the monitoring strategy of the company and participate in the decisions on what to monitor and how.
Conclusion
The increased adoption of cloud-native infrastructures and applications called out the need to get visibility into infrastructures and applications.
Deeper monitoring and a strategic approach supported by the right tools can achieve benefits for the whole company, such as cost optimization and the ability to turn metrics into actionable insights to improve efficiency.
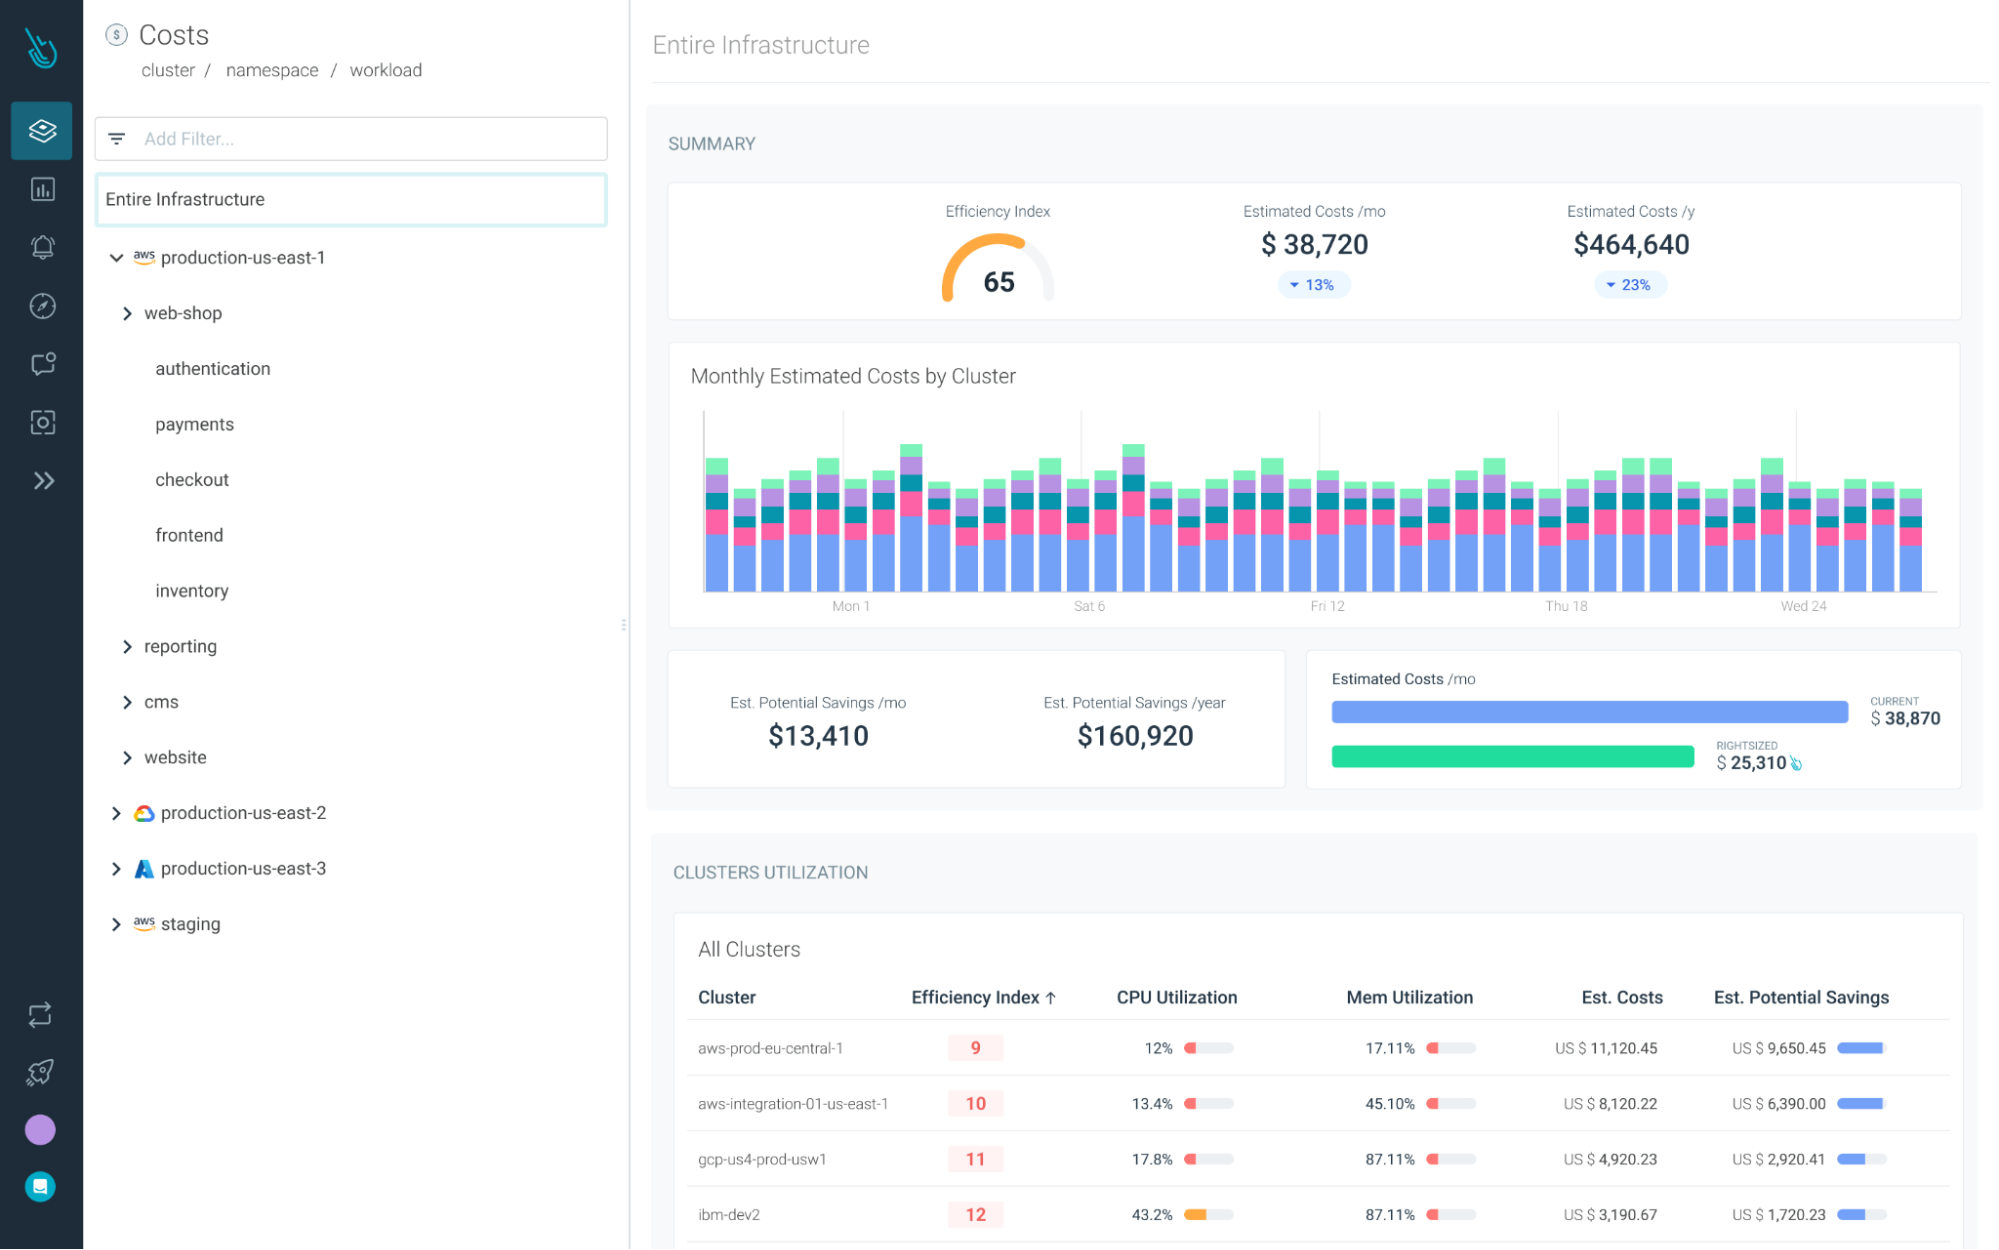
Reduce your Kubernetes costs with Sysdig Monitor
Sysdig Monitor can help you reach the next step in the Monitoring Journey.
With Cost Advisor, you can reduce Kubernetes resource waste by up to 40%.
And with our out-of-the-box Kubernetes Dashboards, you can discover underutilized resourcesin a couple of clicks.
Try it free for 30 days!