

In this post we’ll discuss metadata in Kubernetes – and how it provides a new lens through which to monitor the performance of your system.
Sure, metadata is a fancy word. It actually means “data that describes other data.” While that definition isn’t all that helpful, it turns out metadata itself is especially helpful in container environments. When you have any complex system, the availability of metadata helps you sort and process the variety of data coming out of that system, so that you can get to the heart of an issue with less heartache.
In a Kubernetes environment, metadata can be a crucial tool for organizing and understanding the way containers are orchestrated across your many services, machines, availability zones or (in the future) multiple clouds. This metadata can also be consumed by other services running on top of your Kubernetes system and helping you manage your applications.
We’ll take a look at some examples of this below, but first…
A Quick Intro to Kubernetes Metadata
Kubernetes metadata is abundant in the form of labels and annotations. Labels are designed to be identifying metadata for your infrastructure, whereas annotations are designed to be non-identifying. For both, they’re simply generic key:value pairs that look like this:
“labels”: {
}
Labels are not designed to be unique; you can expect any number of objects in your environment to carry the same label, and you can expect that an object could have many labels.
What are some examples of labels you might use? Here are just a few. WARNING: Once you start, you might find more than a few ways to use this functionality!
- Environment: Dev, Prod, Test, UAT
- Customer: Cust A, Cust B, Cust C
- Tier: Frontend, Backend
- App: Cache, Web, Database, Auth
In addition to custom labels you might define, Kubernetes also automatically applies labels to your system with useful metadata. Default labels supply key identifying information about your entire Kubernetes hierarchy: Pods, Services, Replication Controllers, and Namespaces.
Putting Your Metadata To Work
Once you spend a little time with Kubernetes, you’ll see that labels have one particularly powerful application that makes them essential:
Kubernetes labels allows you to easily move between a “physical” view of your hosts and containers, and a “logical” view of your applications and micro-services.
At its core a platform like Kubernetes is designed to orchestrate the optimal use of underlying physical resources. This is a powerful way to consume private or public cloud resources very efficiently, and sometimes you need to visualize those physical resources. In reality, however, most of the time you care about the performance of the service first and foremost.
But in a Kubernetes world, achieving that high utilization means a service’s containers may be scattered all over the place! So how do you actually measure the service’s performance? That’s where the metadata comes in. With Kubernetes metadata you can create a deep understanding of your service’s performance, regardless of where the underlying containers are physically located.
Paint Me A Picture
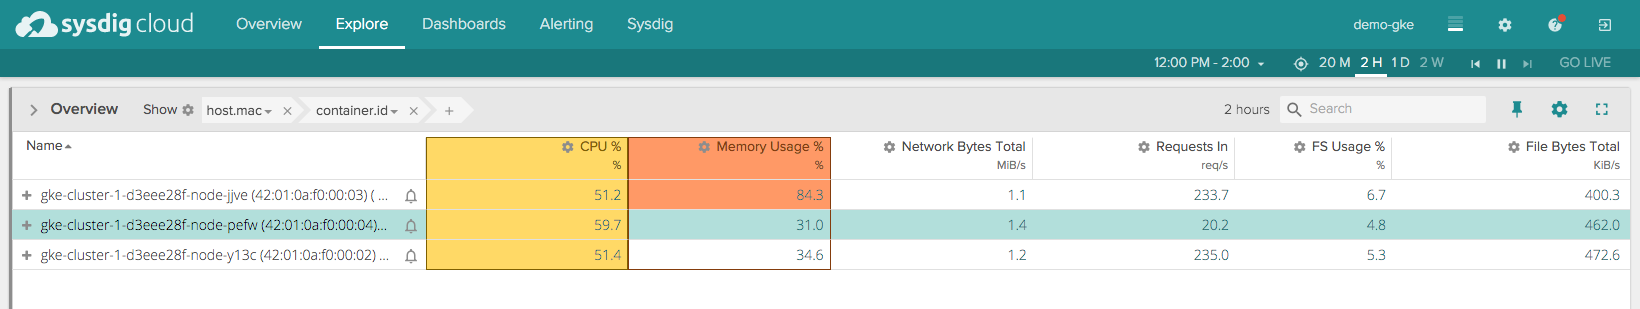
Let’s look at a quick example to make this more concrete: monitoring your application. Let’s work with a small, 3 node deployment running on GKE. For visualizing the environment we’ll use Sysdig Cloud. Here’s a list of the the nodes – note the “gke” prepended to the name of each host. We see some basic performance details like CPU, memory and network.
Each of these hosts has a number of containers running on it. Drilling down on the hosts, we see the containers associated with each:
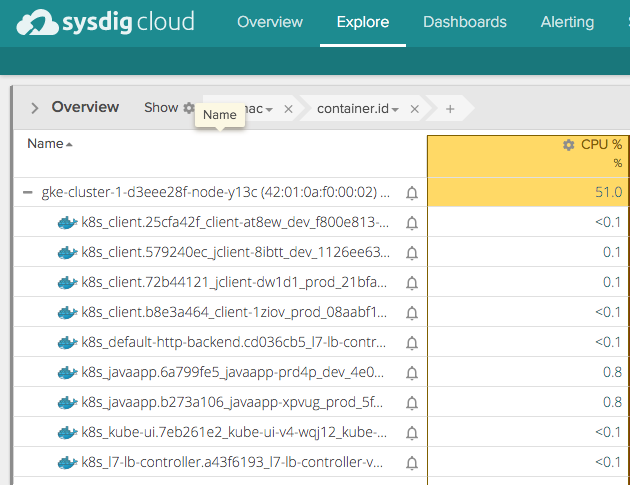
Simply scanning this list of containers on a single host, I don’t see much organization to the responsibilities of these objects. For example, some of these containers run Kubernetes services (like kube-ui) and we presume others have to do with the application running (like javaapp.x).
Now let’s use some of the metadata provided by Kubernetes to take an application-centric view of the system. Let’s start by creating a hierarchy of components based on labels, in this order:
This aggregates containers at corresponding levels based on the above labels. In the app UI below, this aggregation & hierarchy are shown in the grey ‘grouping’ bar above the data about our hosts. As you can see, we have a “prod” namespace with a group of services (replication controllers) below it. Each of those replication controllers can then consist of multiple pods, which are in turn made up containers.
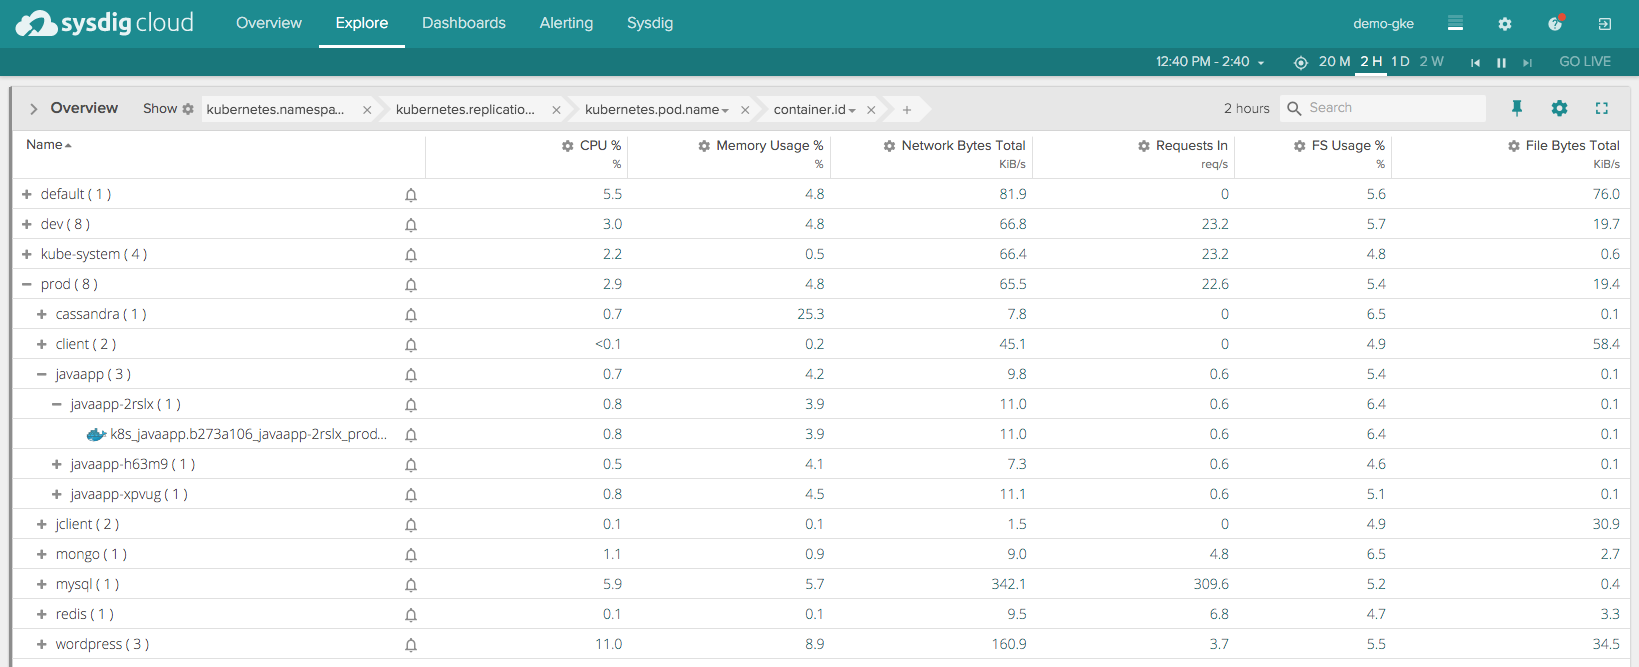
In addition to organizing containers via labels, this view also aggregates metrics across relevant containers, giving a singular view into the performance of a namespace or replication controller.
In other words: with this aggregated view based on metadata, you can now start by monitoring and troubleshooting services, and drill into hosts and containers only if needed. Let’s do one more thing with this environment – let’s use the metadata to create a visual representation of services and the topology of their communications. Here you see our containers organized by services, but also a map-like view that shows you how these services relate to each other.
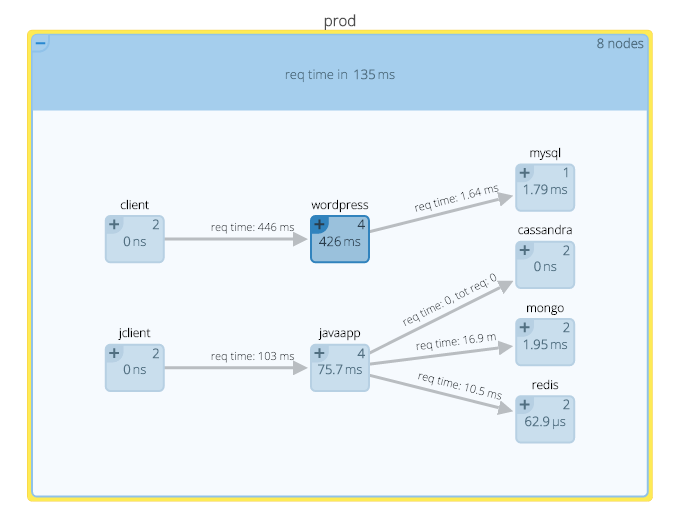
The boxes represent services that are aggregates of containers (the number in the upper right of each box tells you how many containers), and the lines represent communications between services and their latencies.
This kind of view provides yet another logical, instead of physical, view of how these application components are working together. From here I can understand service performance, relationships and underlying resource consumption (CPU in this example).
Metadata: love it, use it
This is a pretty quick tour of metadata, but I hope it inspires you to spend a little time thinking about the relevance to your own system and how you could leverage it. Here we built a pretty simple example — apps and services — but imagine collecting metadata across your apps, environments, software components and cloud providers. You could quickly assess performance differences across any slice of this infrastructure effectively, all while Kubernetes is efficiently scheduling resource usage.
Get started with metadata for visualizing these resources today, and in a followup post we’ll talk about the power of adaptive alerting based on metadata.