


Falco Feeds extends the power of Falco by giving open source-focused companies access to expert-written rules that are continuously updated as new threats are discovered.

Data correlation is perhaps one of the hardest parts of troubleshooting in a complex distributed software environment. It's relatively easy to set-up your APM tool, your monitoring tool, your logging tool, your synthetic monitoring tool and so on to capture data and even alert on problems. It of course gets harder in container environments where these traditional tools don't work – but we'll ignore that point for the moment.
\r\r
When it comes down to actually solving the problem, all those tools are part of the problem: you'll find yourself jumping between charts, graphs, and tables trying to give your team a view into the right data. But you ideally want to have all that information in the same application, with a sane way to correlate all the different data types.
\r\r
Sysdig makes data correlation in container environments much, much simpler with event notification overlays. The ability to correlate metrics with events not only provides you powerful metrics analysis, but also provides you the ability to work with semi-structured data within your overall operations analysis and monitoring practice.
\r\r
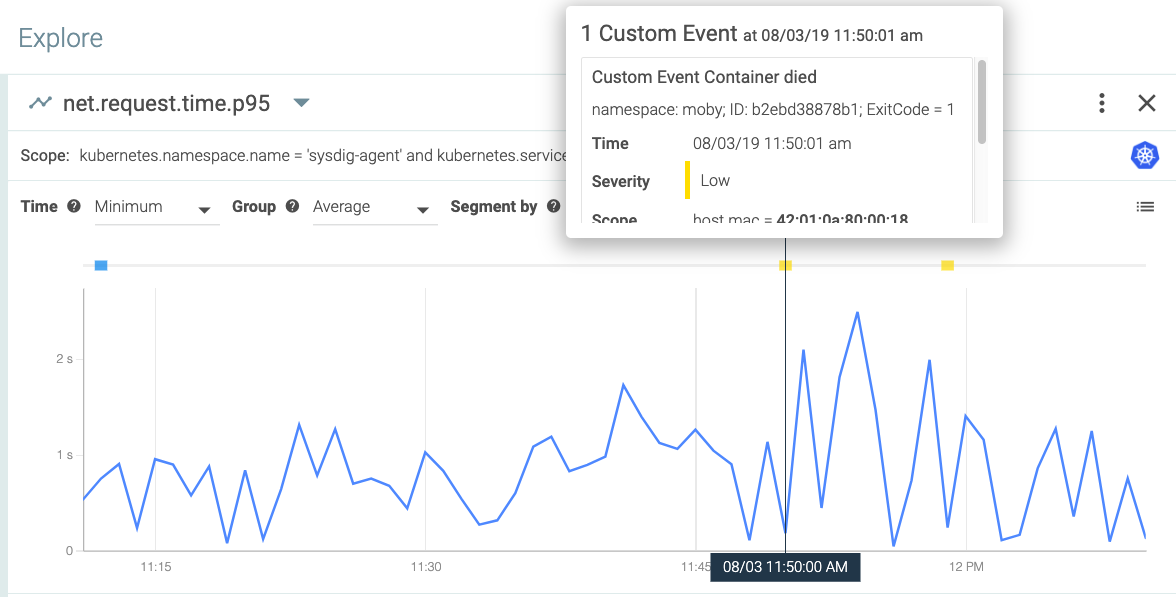
Event notification overlays allow you to correlate event alert messages with your metric charts and dashboards, and to selectively look at alerts within a broad or narrow context. As always, a picture is worth a thousand data points:
\r\r
\r\r
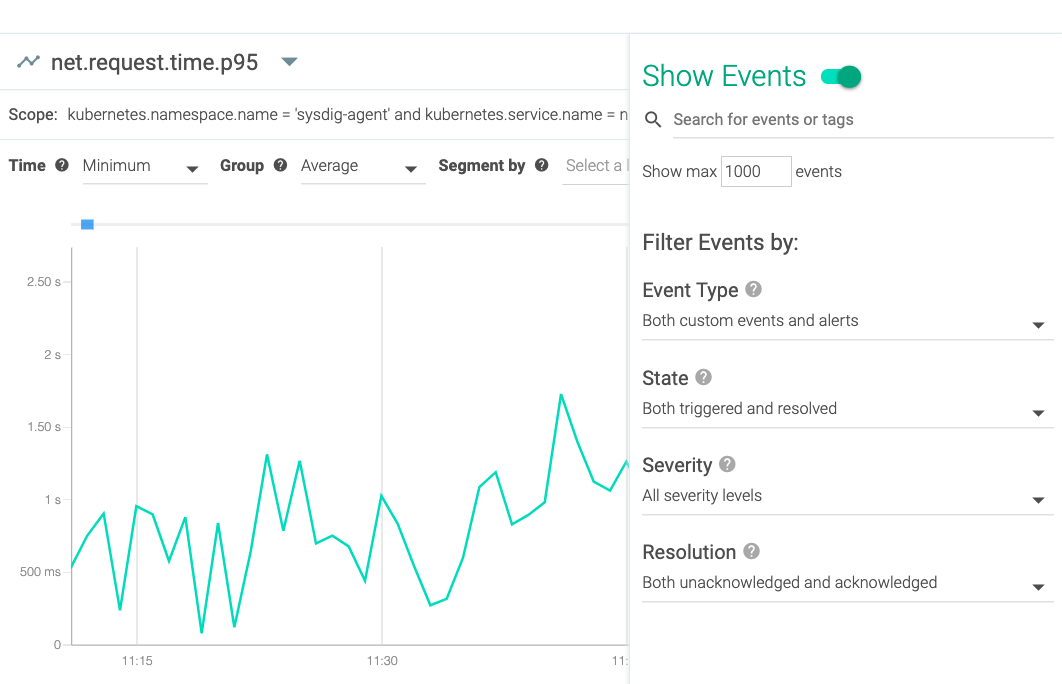
As you see, we allow you to correlate Sysdig-fired alerts with your metrics. The beauty is we let you do it with the flip of a switch:
\r\r
\r\r
By simply flipping the Show Events toggle on any dashboard or panel, Sysdig Monitor will automatically overlay these event notifications. In addition, you can apply filters to narrow the event types that appear on your views. This includes selecting by type, by whether the event is resolved or not, by severity, and by the resolution type – acknowledged or unacknowledged .
\r\r
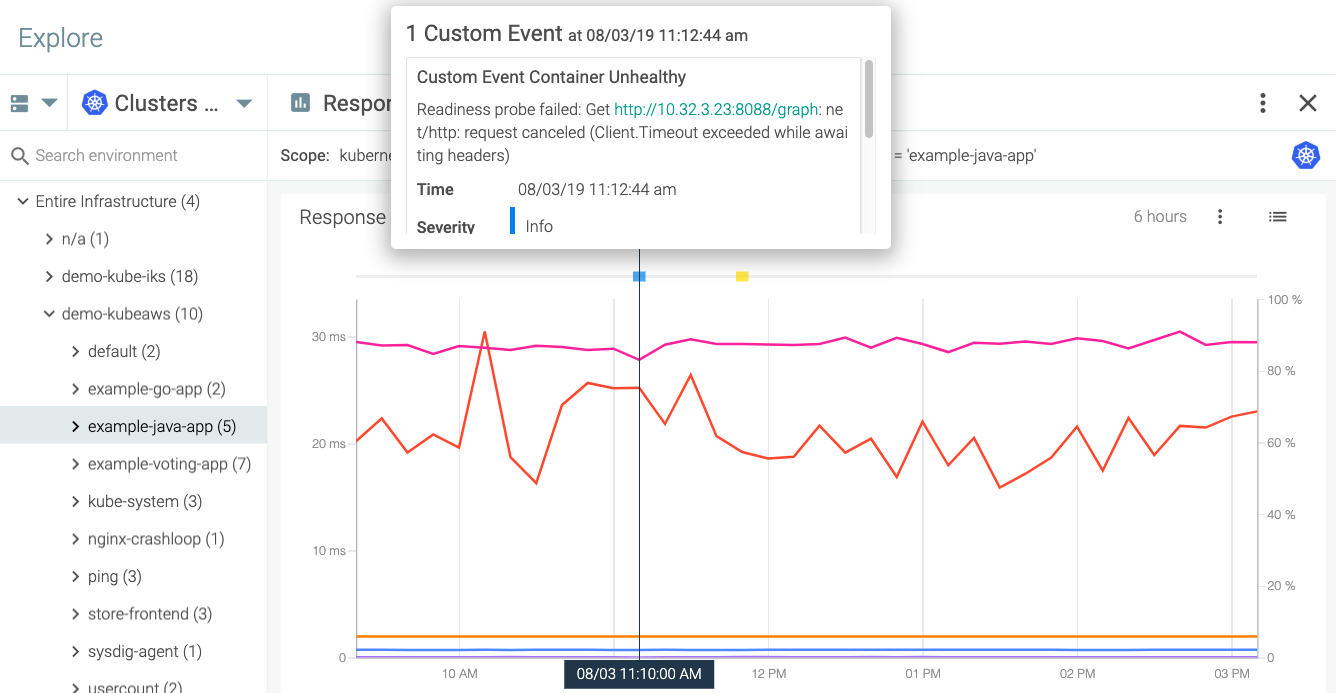
These choices allow you to do some pretty interesting things. For example, in the dashboard below, I can correlate the response time of my Java applications with a "container unhealthy" event coming from a Kubernetes readiness probe:
\r\r
\r\r
Insights from Sysdig event correlations
\r\r
Without a doubt, the ability to visually correlate Sysdig event alerts with Sysdig metrics (or Prometheus metrics, etc.) helps to provide instant insight into the behavior of a given metric or group of metrics. Consider a spike in node resource use correlating with a scheduling event from Kubernetes. Perfectly normal. On the other hand, seeing a spike when a container died message has been issued is another story. One might cause no alarm, while the other might lead you to triage the issue further.
\r\r
At Sysdig, we're always working to bring you new ways to quickly analyze the data we provide through the Sysdig platform. If you've not turned on the event overlay functionality, I recommend you give it a try. We think it will help further accelerate your efforts to ensure the performance and health of your containers, apps, and clouds.