


Falco Feeds extends the power of Falco by giving open source-focused companies access to expert-written rules that are continuously updated as new threats are discovered.

Custom metrics is a key component for many companies. Stock available in warehouses, shopping cart status, number of products sold, and operational status for industrial machines are some of the many KPIs that companies need for their own business tracking purposes. When it comes to custom metrics and observability platforms costs, many companies are struggling to find a good balance between availability, performance, reliability, and costs. Unfortunately, many of these businesses are starting to see how bills are growing exponentially over time, mainly because of a cardinality explosion.
Dealing with growing costs, when the current macroeconomic conditions are causing businesses to rethink their spending and cut costs, only makes the issue of custom metrics cost more troubling. There are multiple ways to reduce your observability and monitoring costs. In previous articles, we already covered how companies can easily reduce costs by choosing the right managed service for Prometheus offering. Now, it's time to talk about cutting custom metrics costs.
This article will provide more information about the pricing plans of Datadog and Sysdig, what the differences are between these two pricing models, along with a comparison of costs based on two different use cases.
Are you concerned about a non-stop growing cardinality in your custom metrics, and its associated huge costs? Is your custom metrics volume eating all of your monitoring budget? If so, you are in the right place. Keep reading and avoid paying a $65M bill.
What is metric cardinality and why is it important?
When it comes to Prometheus time series volume, there is a key factor that comes into play: cardinality.
The definition of cardinality is, "The number of elements in a given mathematical set." Now, you may be wondering, how does cardinality impact your Prometheus metrics?
Metrics are identified by a unique name and contain one or more labels, which may contain one or more values. Data is stored in the form of key/value pairs. In short, in a Prometheus metrics context, cardinality is the total number of unique combinations for values in a given metric. Hence, we can say the more labels in a metric, and the more values for a given label, the more cardinality.
Cardinality is key for observability platforms. It is a risk factor that goes unnoticed very often across organizations. But why is cardinality important? Sometimes, the volume or the number of time series for a given metric starts to grow out of control. If you pay attention, you may notice a cardinality spike. When a metric or a group of metrics starts to grow that way, we say there is a cardinality explosion. This can happen for several reasons, but to make it simpler, imagine the following situation: Recent changes in a given metric were recently done, a new label to track the product id in a transactions metric was added. This may go unnoticed in most of the cases. It is just a new label in a metric, but can have a serious impact on performance, stability, availability, and costs. We already know what cardinality is and how it can be calculated, so how could a new "product id" label impact a metric with thousands of products when processing millions of transactions every day? This recent change can undoubtedly lead metrics to a cardinality explosion.
Businesses must look at metrics cardinality constantly, monitor their metrics volume, and be able to react quickly when a metric explosion is detected. Otherwise, they will run into serious trouble.
Custom metrics pricing
Disclaimer: In this article, you'll find the prices that correspond to the time this article was published (May 2023). For current pricing, please check the public pricing information from every vendor.
Now, let's take a closer look at the price comparison between Datadog and Sysdig. As you will see in the table below, Datadog charges for different assets, like the product license, custom metrics store (beyond 200 custom metrics / host), ingestion, and container monitoring. Sysdig only charges for its license and the custom metrics beyond the free bucket. For further information on actual Datadog pricing, check here.
Let's see how these charges are spread.
While Sysdig Monitor users that exceed these 2,000 custom metrics per host will be charged at $5 for 1,000 custom metrics ($0.005 per custom metric), Datadog charges $5 for only 100 custom metrics blocks – $0.05 per custom metric. In short, Datadog custom metrics pricing is 10x more expensive than Sysdig.
Apart from custom metrics, in terms of costs, Sysdig doesn't charge for other features. Users only have to pay the price per agent, which includes other features like Advisor, out-of-the-box dashboards, alerts, metrics enrichment, integrations, etc. These functionalities are available from the very beginning at no extra cost.
Custom metrics cost comparison
Let's first take a look directly at custom metric costs, as many of our customers found custom metrics to be by far the largest component of their monitoring bill.
In this example, we compare costs for 10 million custom metrics from your applications with Datadog and Sysdig. That's all, just custom metrics prices. The other pricing components listed in the table above will need to be considered when monitoring your infrastructure with both Datadog and Sysdig. We'll see this in more detail in a later example.
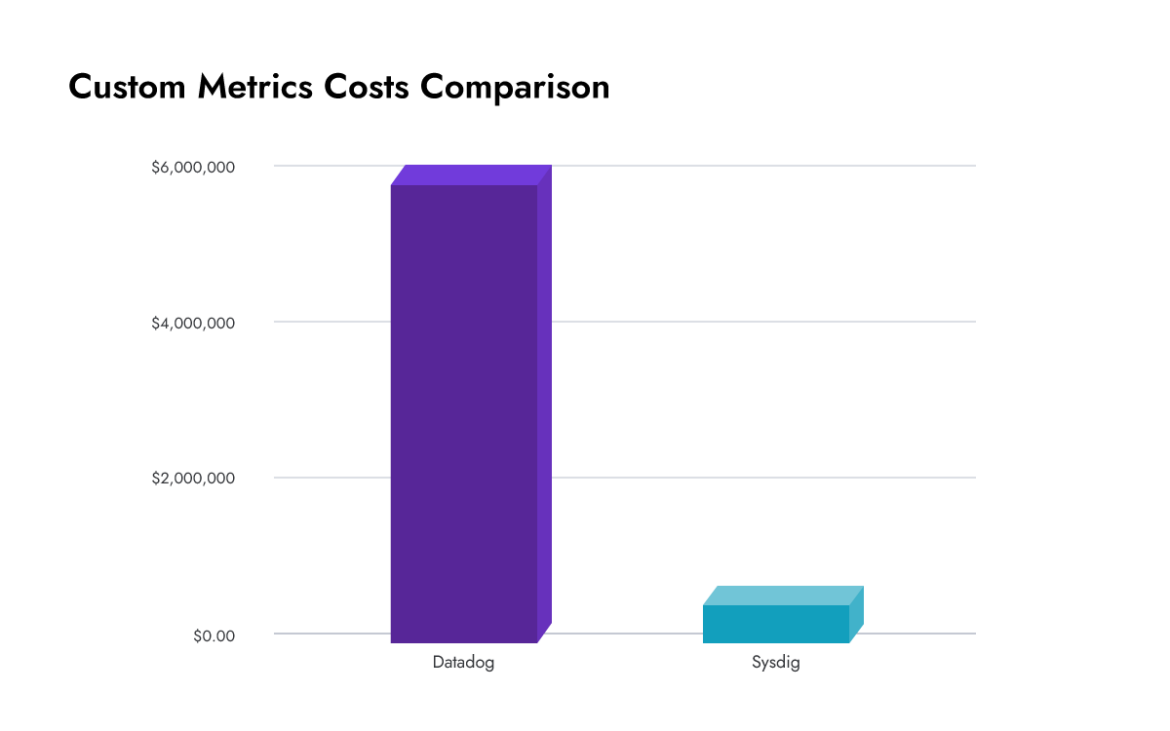
As anticipated in the previous section, Sysdig custom metric costs are 10x cheaper than its competitor. For businesses managing around 10 million time series, they would pay around $6,000,000 per year for custom metrics with Datadog, while Sysdig would reduce their spending by 10x.
Check out this real customer use case and discover how Sysdig Monitor helps customers significantly lower their custom metrics costs while increasing their custom metrics volume.
Custom metrics cost comparison in detail
This time, we'll show you a custom metric cost comparison in detail.
In this environment, there are five K8s clusters with the following architecture definition:
- Five Kubernetes clusters
- 50 nodes per cluster
- ~9,250 containers in total
Our observability platform is processing around 20M time series from applications running in these environments. There are many other components in these K8s clusters that generate Prometheus metrics as well, like the K8s control plane, cAdvisor, node exporter, KSM, coreDNS, etc. For the sake of simplicity, you'll find approximate numbers of metrics for every component in the following list.
- Application custom metrics: 20,000,000 TS
- K8s control plane: 530,000 TS
- K8s cAdvisor: 3,800,000 TS
- K8s Node exporter & KSM: 2,300,000 TS
- K8s nodes: 550,000 TS
Next, you'll find a price comparison between Datadog on Sysdig for monitoring a Kubernetes architecture like the one described in the heading of this section.
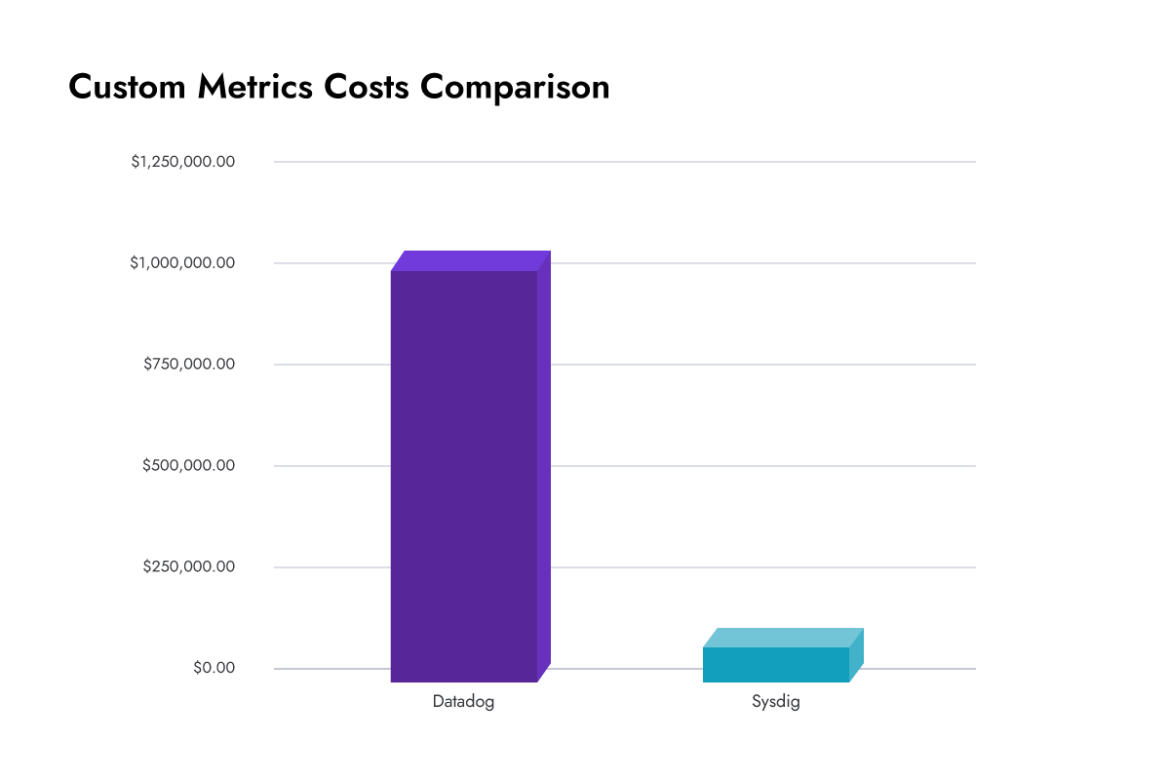
Digging deeper into the numbers used for the math, as anticipated earlier, 20,000,000 TS is the total number of custom metrics in this environment for applications. For Datadog calculations, after applying 200 TS reduction per node (50,000 TS in total), it becomes 19,950,000 billable TS at $5/100TS, ~$997,500 for custom metrics. Bear in mind that metrics ingestion, containers, and infrastructure hosts are also charged – check these extra costs in the table above.
As explained in the previous example, Sysdig Monitor charges a much lower price. That's $5/1000TS for custom metrics. Sysdig brings its own set of equivalent KSM, node exporter, and cAdvisor metrics at no extra cost, so these don't need to be ingested at all. In addition, as discussed in previous sections, the license includes 2,000 TS per node – that means 500,000 for free in this specific scenario.
Have you already noticed the differences in pricing between both products? While Datadog total costs are around $1,030,950/month and $12,371,400 for a whole year, Sysdig charges respectively at $100,150 and $1,291,800 for the same period. This is 10x cheaper than the competitor.
Conclusion
As you saw in the previous comparison, custom metrics costs may significantly vary depending on the vendor. Metrics cardinality grows exponentially: The more values for a label and the more labels in a metric, the more cardinality. That means more and more unique metrics. This is a key factor for making your custom metrics costs rise over time.
Sysdig Monitor is a Kubernetes and cloud observability platform that helps troubleshoot issues and lower costs with deep visibility into cloud-native applications. If you want to learn more about how Sysdig can help you reduce your custom metrics costs, check out the Best Practices Guide for Reducing the Cost of Custom Metrics. To learn more about how Sysdig addresses custom metrics use cases, visit the Sysdig custom metrics webpage.
Do you want to try it yourself? Visit the Sysdig Monitor trial page and request a 30-day trial account. You'll be up and running in minutes!