


Falco Feeds extends the power of Falco by giving open source-focused companies access to expert-written rules that are continuously updated as new threats are discovered.

Getting started with PromQL can be challenging when you first arrive in the fascinating world of Prometheus, here’s a PromQL cheatsheet with interesting tips. Since Prometheus stores data in a time-series data model, queries in a Prometheus server are radically different from good old SQL.
Understanding how data is managed in Prometheus is key to learning how to write good, performant PromQL queries.
This article will introduce you to the PromQL basics and provide a cheat sheet you can download to dig deeper into Prometheus and PromQL.
In this article, you will learn:
- How time-series databases work
- PromQL data selection
- PromQL aggregators and operators
- PromQL functions
- Next steps

How time-series databases work
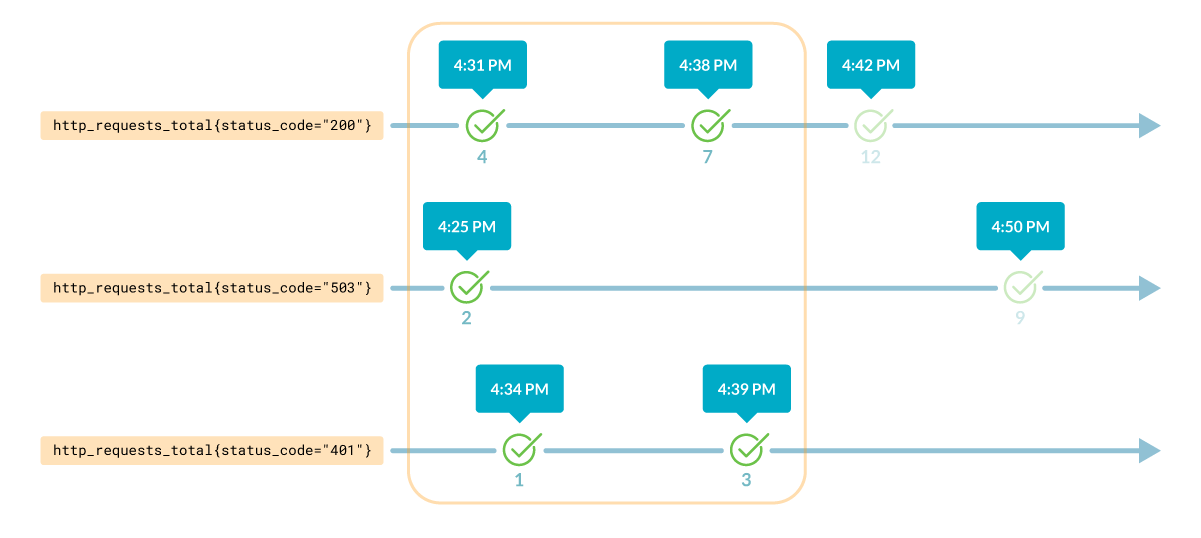
Time series are streams of values associated with a timestamp.
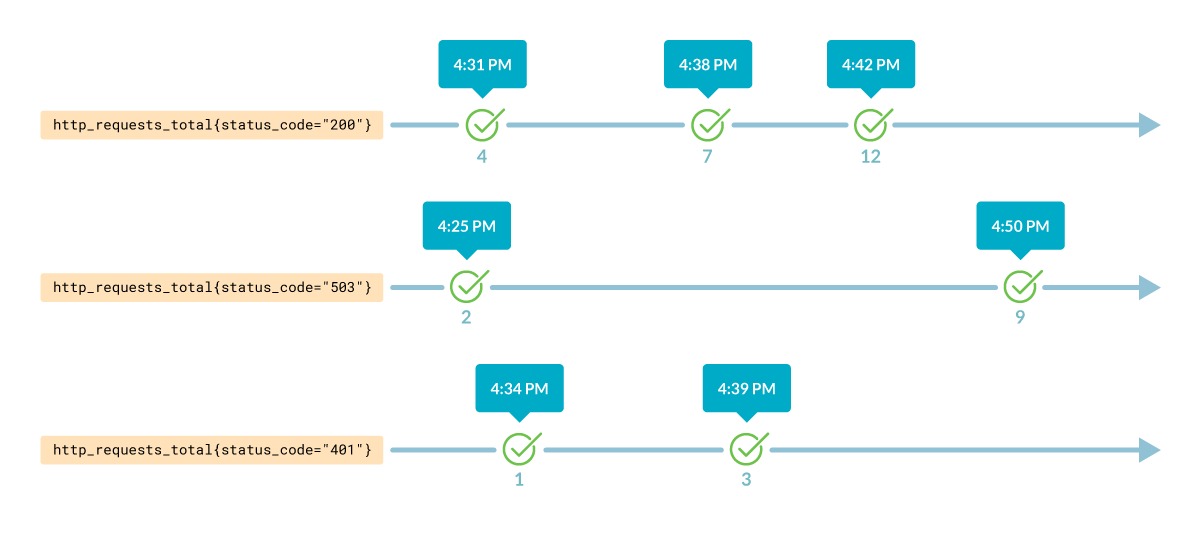
Every time series is identified by its metrics name and its labels, like:
or
In the above example, you can see the metric name (kube_node_labels) and the labels (cluster and label_kubernetes_io_role). Although normally this is how the metrics and labels are referenced, the name of the metric is actually a label too. The query above can also be written like this:
There are four types of metrics in Prometheus:
- Gauges are arbitrary values that can go up and down. For example,
mongodb_uptells us if the exporter has a connection to the MongoDB instance. - Counters represent totalizers from the beginning of the exporter and usually have the
_totalsuffix. For example,http_requests_total. - Histogram samples observations, such as the request durations or response sizes, and counts them in configurable buckets.
- Summary works as a histogram and also calculates configurable quantiles.
Gettings started with PromQL data selection
Selecting data in PromQL is as easy as specifying the metric you want to get the data from. In this example, we will use the metric http_requests_total.
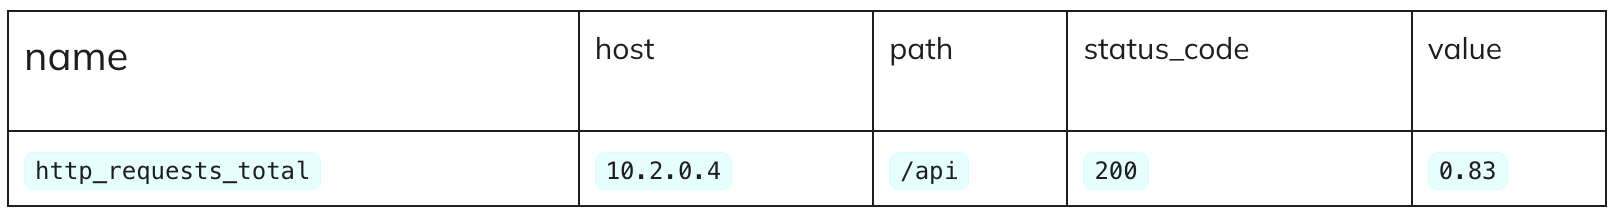
Imagine that we want to know the number of requests for the /api path in the host 10.2.0.4. To do so, we will use the labels host and path from that metric.
We could run this PromQL query:
It would return the following data:
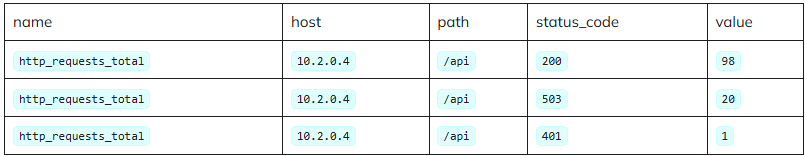
Every row in that table represents a series with the last available value. As http_requests_total contains the number of requests made since the last counter restart, we see 98 successful requests.
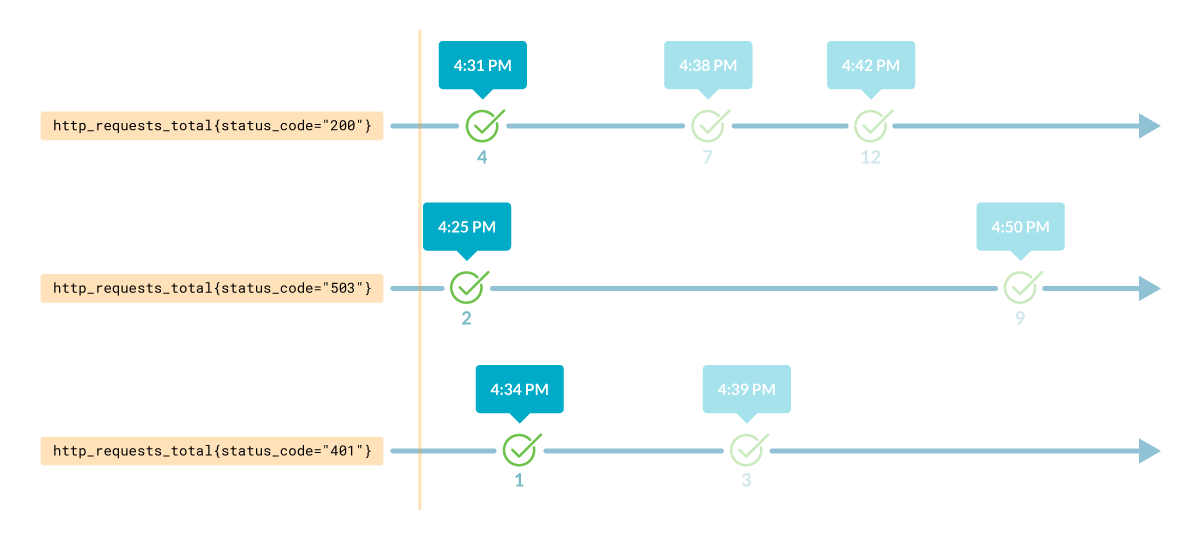
This is called an instant vector, the earliest value for every series at the moment specified by the query. As the samples are taken at random times, Prometheus has to make approximations to select the samples. If no time is specified, then it will return the last available value.
Additionally, you can get an instant vector from another moment (i.e., from one day ago).
To do so, you only need to add an offset, like this:
To obtain metric results within a timestamp range, you need to indicate it between brackets:
It would return something like this:
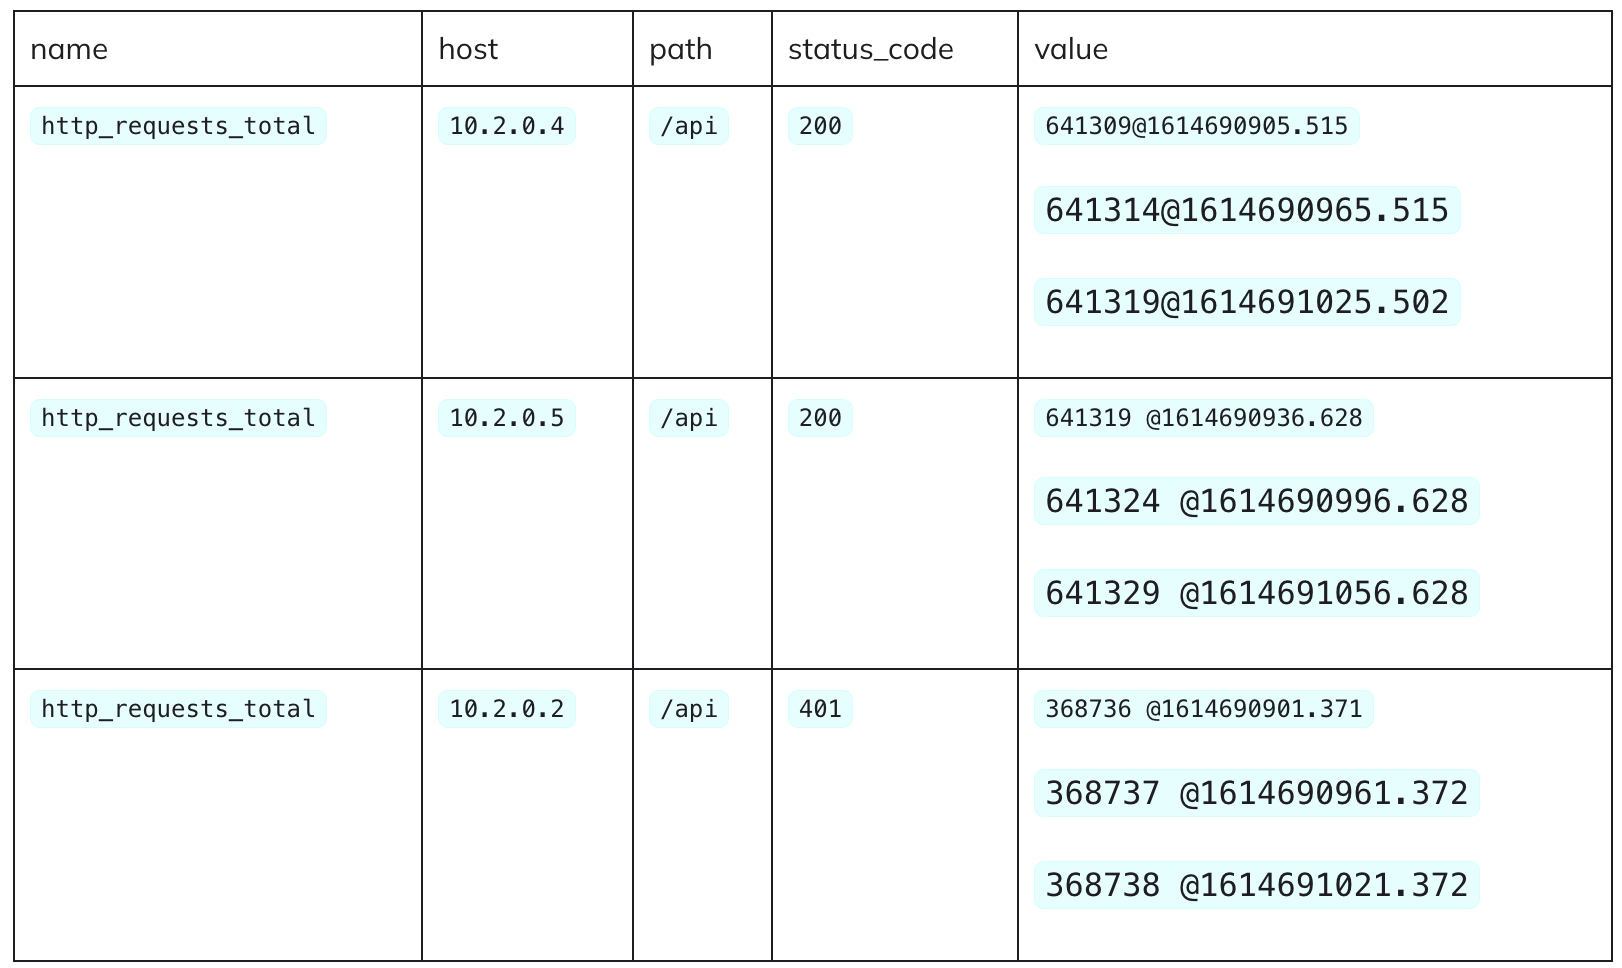
The query returns multiple values for each time series; that’s because we asked for data within a time range. Thus, every value is associated with a timestamp.
This is called a range vector: all the values for every series within a range of timestamps.
Getting started with PromQL aggregators and operators
As you can see, the PromQL selectors help you obtain metrics data. But what if you want to get more sophisticated results?
Imagine if we had the metric node_cpu_cores with a cluster label. We could, for example, sum the results, aggregating them by a particular label:
This would return something like this:
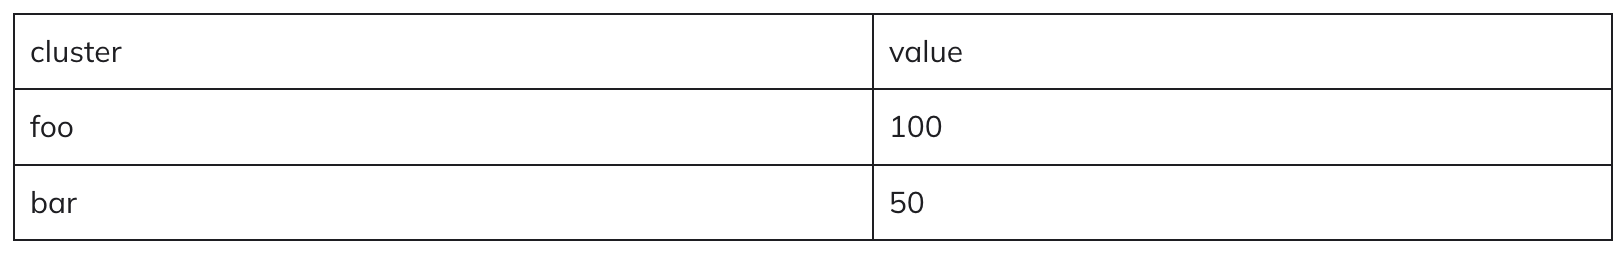
With this simple query, we can see that there are 100 CPU cores for the cluster cluster_foo and 50 for the cluster_bar.
Furthermore, we can use arithmetic operators in our PromQL queries. For example, using the metric node_memory_MemFree_bytes that returns the amount of free memory in bytes, we could get that value in megabytes by using the div operator
We could also get the percentage of free memory available by comparing the previous metric with node_memory_MemTotal_bytes, which returns the total memory available in the node.
And using it for creating an alert in case there are nodes with less than 5% of free memory.
Getting started with PromQL functions
PromQL offers a vast collection of functions we can use to get even more sophisticated results. Continuing with the previous example, we could use the topk function to identify which two nodes have higher free memory percentages.
Prometheus not only gives us information from the past, but also the future. The predict_linear function predicts where the time series will be in the given amount of seconds. You may remember that we used this function to cook the perfect holiday ham.
Imagine that you want to know how much free disk space left will be available in the next 24 hours. You could apply the predict_linear function to last week’s results from node_filesystem_free_bytes metric, which returns the free disk space available. This lets you predict the free disk space, in gigabytes, in the next 24 hours.
When working with Prometheus counters, the rate function is pretty convenient. It calculates a per-second increase of a counter, allowing for resets and extrapolating at edges to provide better results.
What if we need to create an alert when we haven’t received a request in the last 10 minutes. We couldn’t just use the http_requests_total metric because if the counter got reset during the timestamp range, the results wouldn’t be accurate.
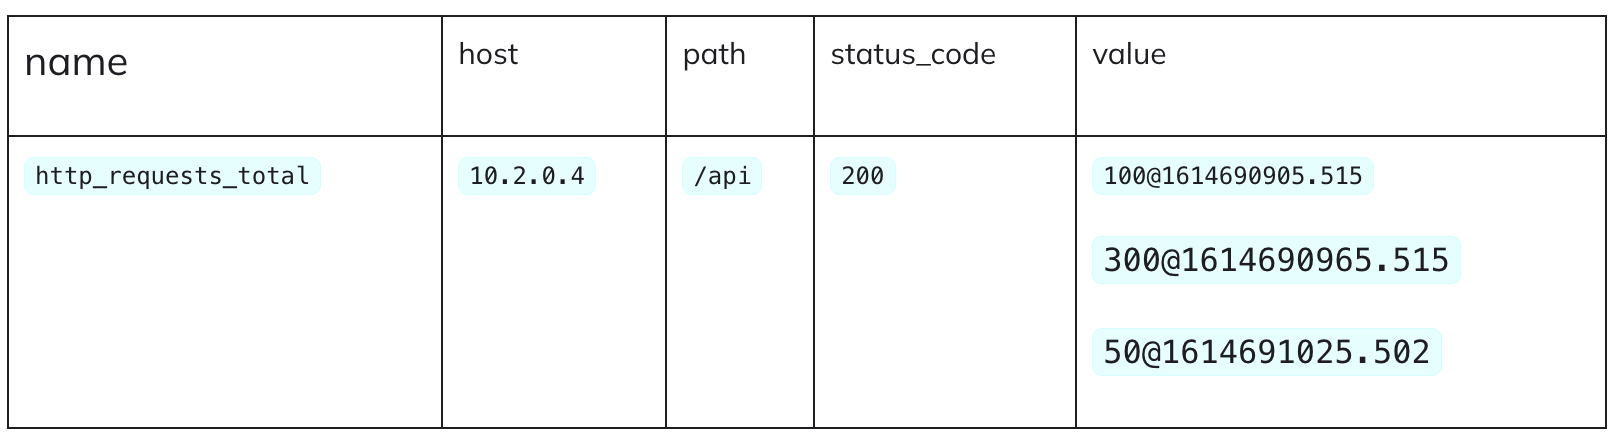
In the example above, as the counter got reset, there will be negative values from 300 to 50. Using just this metric wouldn’t be enough. Here is where the rate function comes to the rescue. As it considers the resets, the results are fixed as if they were like this:
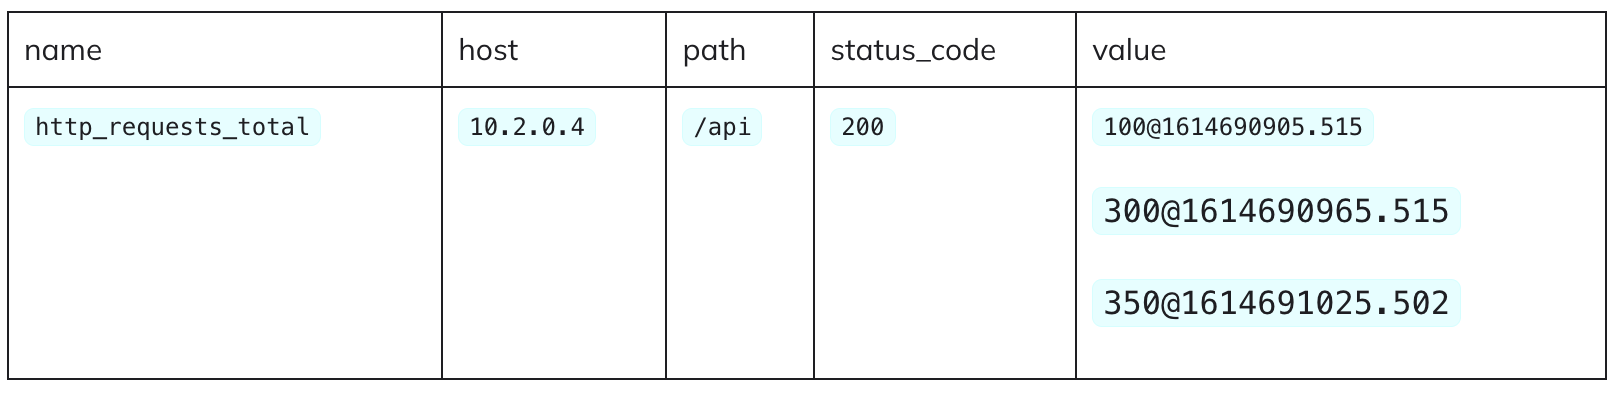
Regardless of the resets, there were 0.83 requests per second as averaged in the last 10 minutes. Now we can configure the desired alert:
Next steps
In this article, we learned how Prometheus stores data and how to start selecting and aggregating data with PromQL examples.
You can download the PromQL Cheatsheet to learn more PromQL operators, aggregations, and functions, as well as examples. You can also try all the examples in our Prometheus playground.
Also, you can take a look at our Top 10 PromQL Examples for monitoring Kubernetes to get some inspiration.
You can also try the Sysdig Monitor Free 30-day Trial, since Sysdig Monitor is fully compatible with Prometheus. You’ll get started in just a few minutes.
More Prometheus query examples in our PromQL Library
We recently released our PromQL Library in Sysdig Monitor. In this library, you’ll find a curated list of Prometheus query examples so you don’t have to start googling or asking on Stackoverflow how to write that PromQL queries.
You can sign up for a free trial of Sysdig Monitor and try the new PromQL Library. Just find the PromQL query you need, click the Try me button, and voilà!