Falco Feeds extends the power of Falco by giving open source-focused companies access to expert-written rules that are continuously updated as new threats are discovered.

In this post we are going to demonstrate how to deploy a Kubernetes autoscaler using a third party metrics provider. You will learn how to expose any custom metric directly through the Kubernetes API implementing an extension service.
Dynamic scaling is not a new concept by any means, but implementing your own scaler is a rather complex and delicate task. That's why the Kubernetes Horizontal Pod Autoscaler (HPA) is a really powerful Kubernetes mechanism: it can help you to dynamically adapt your service in a way that is reliable, predictable and easy to configure. Deploy a #Kubernetes pod autoscaler integrating custom metrics from #monitoring providers. Click to tweet
Why you may need custom metrics for your Kubernetes autoscaler?
If the metrics-server plugin is installed in your cluster, you will be able to see the CPU and memory values for your cluster nodes or any of the pods. These metrics are useful for internal cluster sizing, you probably want to configure your Kubernetes autoscaler using a wider set of metrics:
- Service latency ->
net.http.request.time - I/O load ->
file.iops.total - Memory usage ->
memory.used.percent
You need a metrics provider that is able to provide detailed performance information, aggregated using Kubernetes metadata (deployments, services, pod). The extension API server implementation in this post uses Sysdig Monitor.
Before we start deploying our custom Kubernetes autoscaler, let's go over the HPA basics.
Kubernetes autoscaler (HPA) basic concepts
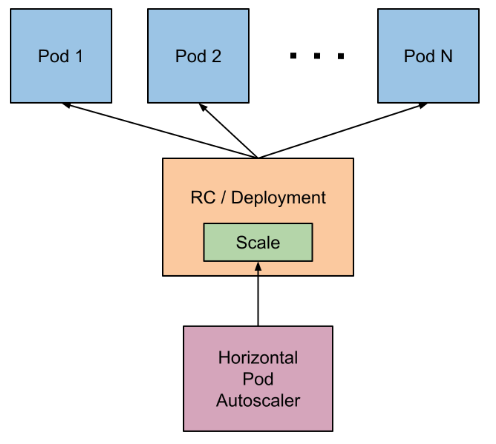
We can start with a simple diagram:

As you can see above, the HPA object will interact with a pod controller like a Deployment or ReplicaSet. It will update this object to configure the "desired" number of pods given the current metric readings and thresholds.
The pod controller, a Deployment for instance, will then terminate or create new pods as part of its reconciliation loop to reach the desired state.
The basic parameters that will you need for any HPA are:
- Scale target: the controller that this HPA will interact with
- minReplicas: minimum number of pods, the HPA cannot go below this value
- maxRepicas: maximum number of pods, the HPA cannot go above this value
- Target metric(s): metric (or metrics) used to evaluate current load and take scaling decisions
- targetValue: threshold value for the metric. If the metric readings are above this value, and (currentReplicas < maxReplicas), HPA will scale up.
You can create a Kubernetes HPA in just one line:
If you generate high CPU loads in these pods, the HPA will scale up the desired number of replicas:
It will also scale down again when the CPU burst is over. Pretty neat, right? There are many other details covering the HPA algorithm and advanced configuration details in the Kubernetes official documentation.
Like many other things in Kubernetes, the set of metrics available to the HPAs can be expanded implementing an API extension. Let's see how this is done.
Kubernetes custom metrics API
The Kubernetes HPA is able to retrieve metrics from several APIs out of the box: metrics.k8s.io, custom.metrics.k8s.io (the one that we will use in this post), and external.metrics.k8s.io.
To register custom metrics and update their values, you need to:
- Enable the Kubernetes aggregation layer
- Register a new APIService object that will bind the new API path to the Kubernetes service implementing it
- The actual service implementation (a pod living inside a Kubernetes namespace for this example) that responds to the HPA requests and retrieves the metric values from the external provider
If you are using a recent Kubernetes version (1.11+), the API aggregation layer is probably enabled and configured out of the box, so you can skip this step. You can check the relevant API server parameters describing the kube-apiserver pod living in your kube-system namespace:
In case your API server doesn't have these flags, the Kubernetes documentation has an article explaining how to configure them.
These parameters enable the kube-aggregator, a controller in charge of two tasks:
- Discovering and registering APIService objects, creating a link between the newly registered API path and the Kubernetes service implementing it.
- Acting as the front-proxy / forwarder for these requests.
This is how a basic APIService object will look like:
Leaving aside the more advanced configuration details, this object will instruct the kube-aggregator to forward v1alpha1.wardle.k8s.io requests to the API extension service, implemented by a pod in the wardle namespace.
Now that we have covered the basic concepts, we can deploy a Horizontal Pod Autoscaler using Kubernetes custom metrics.
Kubernetes autoscaler using Sysdig's custom metrics
Configuring your HPA with custom metrics is pretty straightforward thanks to KEDA, which automatically extends the Kubernetes API metrics endpoint for you. This allows you to use Prometheus PromQL queries to trigger your HPA with just a simple configuration.
Check out how to trigger a Kubernetes autoscaler with Prometheus metrics, and even easier, with Sysdig metrics!
Conclusion
One of the strong points of Kubernetes has always been its extensibility. Thanks to the aggregation layer, you can extend the API, without adding extra complexity or configuration to the resource consumers (the Horizontal Pod Autoscaler in our example).
If you plan to use this integration in your organization, or just a lab environment, we definitely want to hear from you! You can reach us using slack or twitter and, of course, PRs to the project are welcome.
If you would like to run this example, but don't have a Sysdig Monitor account, we invite you to sign-up for a free trial.

