


Falco Feeds extends the power of Falco by giving open source-focused companies access to expert-written rules that are continuously updated as new threats are discovered.

A complete 'Kubernertes monitoring with Prometheus' stack is comprised of much more than Prometheus servers that collect metrics by scraping endpoints. To deploy a real Kubernetes and microservices monitoring solution, you need many other supporting components including rules and alerts (AlertManager), a graphics visualization layer (Grafana), long term metrics storage, as well as extra metrics adapters for the software that is not compatible out of the box.
In this second part we are going to briefly cover all these supporting components, assuming that you already understand the basics of deploying a Prometheus monitoring server covered in the former chapter.
This guide is comprised of four parts:
1 – Kubernetes Monitoring with Prometheus, basic concepts and initial deployment
2 – Kubernetes Monitoring with Prometheus: AlertManager, Grafana, PushGateway (this one):
- AlertManager, Prometheus alerting for Kubernetes
- Grafana, Prometheus Dashboards
- Prometheus metrics for ephemeral jobs – Push Gateway
- Prometheus Persistent metrics storage
3 – The Prometheus operator, Custom Resource Definitions, fully automated Kubernetes deployment for Prometheus, AlertManager and Grafana.
4 – Prometheus performance considerations, high availability, external storage, dimensionality limits.
"Complete your #Kubernetes monitoring with Prometheus stack deploying #AlertManager, #Grafana, pushgateway and persistent storage."
Click to tweet
Prometheus monitoring stack – Architecture overview
Let's start with a deployment architecture overview to place all the components we will discuss over the next sections.
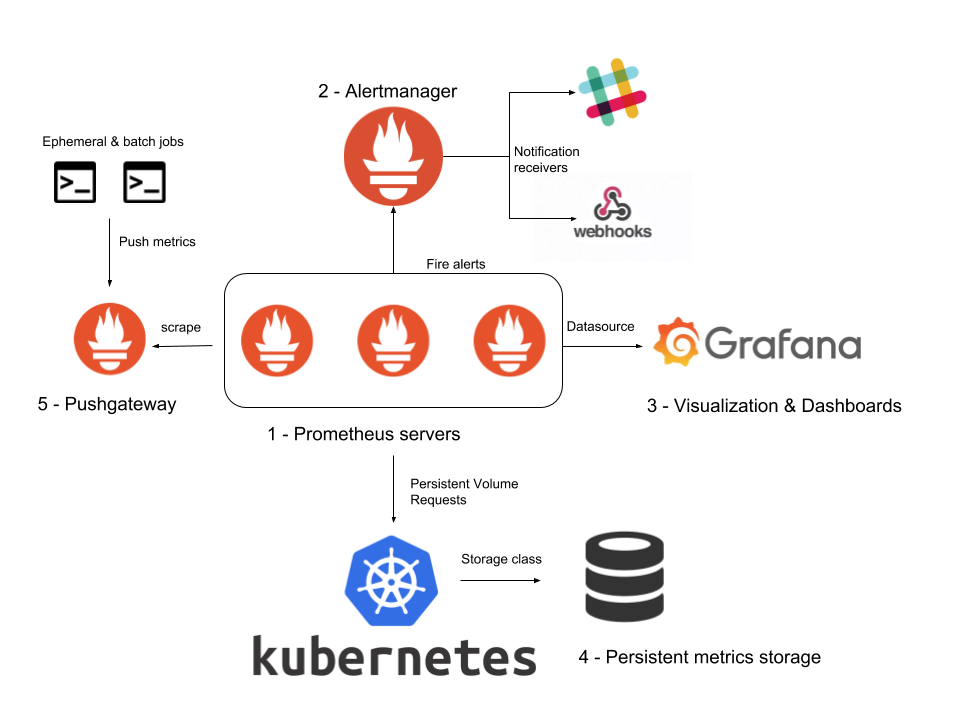
- The Prometheus servers, which were explained in part 1, are at the core of this deployment. The Prometheus servers will push alerts to the AlertManager component, the Alertmanager will classify, route and notify using the different notification channels or receivers.
- We will configure a Prometheus datasource for Grafana, presenting data visualizations and Dashboard via its web interface.
- Using Kubernetes PersistentVolumes, we will configure long term metrics storage.
- We will also cover ephemeral maintenance tasks and its associated metrics. The Pushgateway will be in charge of storing them long enough to be collected by the Prometheus servers.
AlertManager, Prometheus alerting for Kubernetes
There are two parts to alerting with Prometheus:
- The actual alert conditions are configured using PromQL in the Prometheus servers.
- The AlertManager component receives the active alerts:
- AlertManager classifies and groups them based on their metadata (labels), and optionally mutes or notifies them using a receiver (webhook, email, PagerDuty, etc etc).
- AlertManager is designed to be horizontally scaled, an instance can communicate with its peers providing minimal configuration.
We will start with some basic concepts, next section contains a practical example that you can run in your cluster straight away.
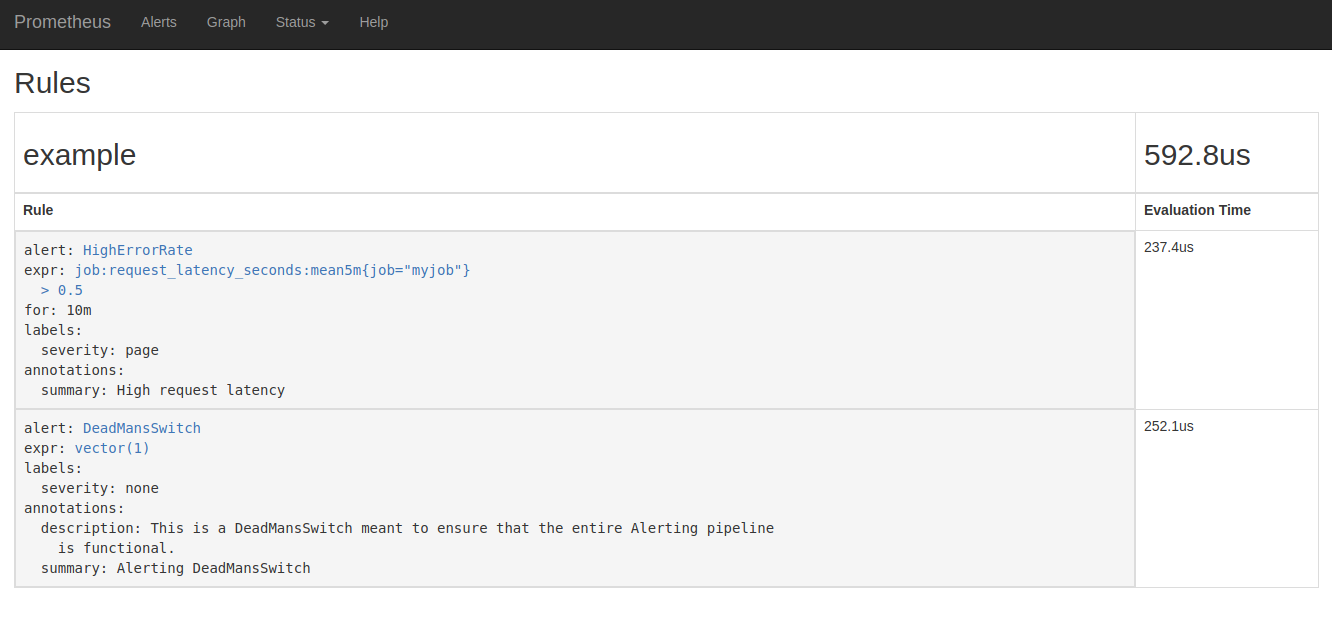
Let's review the structure of a Prometheus alerting rule:
- The
exprkey is a Prometheus expression that will be periodically evaluated and will fire if true. - You can define a minimum evaluation time to avoid alerting on temporary, self-healing glitches.
- Like many other designs in a Kubernetes context, the labels you choose are very relevant to grouping, classification and hierarchy. Later on, the AlertManager will take decisions about which alerts have higher priority, how to group alerts together, etc, all based on these labels.
Now you can display the alerts that the Prometheus server has successfully loaded, directly on the web interface (Status -> Rules):
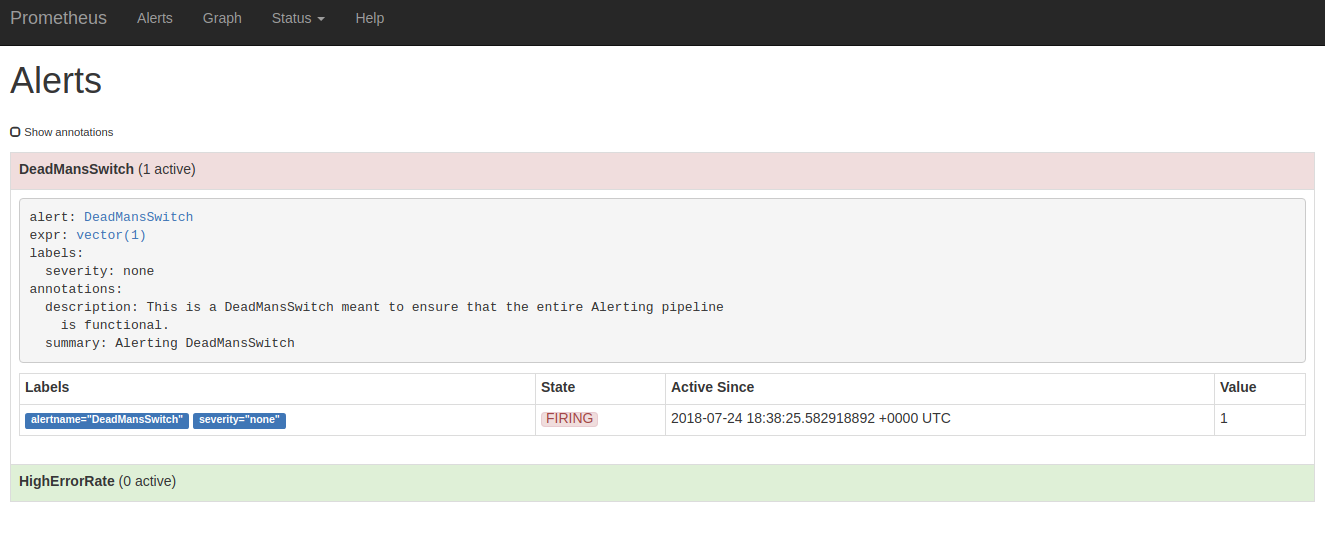
Also the ones that are firing right now (Alerts):
Now you have some alert conditions and alerts that you need to forward to an AlertManager.
Like metrics endpoints, AlertManager services can also be autodetected using different methods: DNS discovery, Consul, etc…
Given that we are talking about Prometheus monitoring in the Kubernetes context, we can take advantage of a basic Kubernetes abstraction: the service.
From the point of view of the Prometheus server, this configuration is just a static name, but the Kubernetes service can perform different HA / LoadBalancing forwardings under the hood.
The AlertManager itself is a sophisticated piece of software, to cover the basics:
- The AlertManager groups the different alerts based on their labels and origin
- This grouping and hierarchy form the "routing tree". A decision tree that determines which actions to take.
- For example, you can configure your routing tree so every alert with the label
k8s-cluster-componentgets mailed to the "cluster-admin" mail address.
- For example, you can configure your routing tree so every alert with the label
- This grouping and hierarchy form the "routing tree". A decision tree that determines which actions to take.
- Using Inhibition rules, an alert or group of alerts can be inhibited if another alert is firing. For example if a cluster is down and completely unreachable, then there is no point notifying the status of the individual microservices it contains.
- Alerts can be forwarded to 'receivers', this is, notification gateways like email, PagerDuty, webhook, etc.
A simple example AlertManager config:
This routing tree just configures a root node.
In this example, we are using a generic JSON webhook as a receiver, there is no need to deploy you own server https://webhook.site will provide you with a temporary endpoint for testing purposes (obviously, your specific URL code for the example will vary).
Prometheus monitoring with AlertManager, Try it out!
You just need to clone the repository and apply the yaml files in the correct order:
Now, access https://webhook.site/ and replace the random URL you will get in the alertmanager.yml file, url: 'your url here' parameter, and then:
After a few seconds, all the pods should be in Running state:
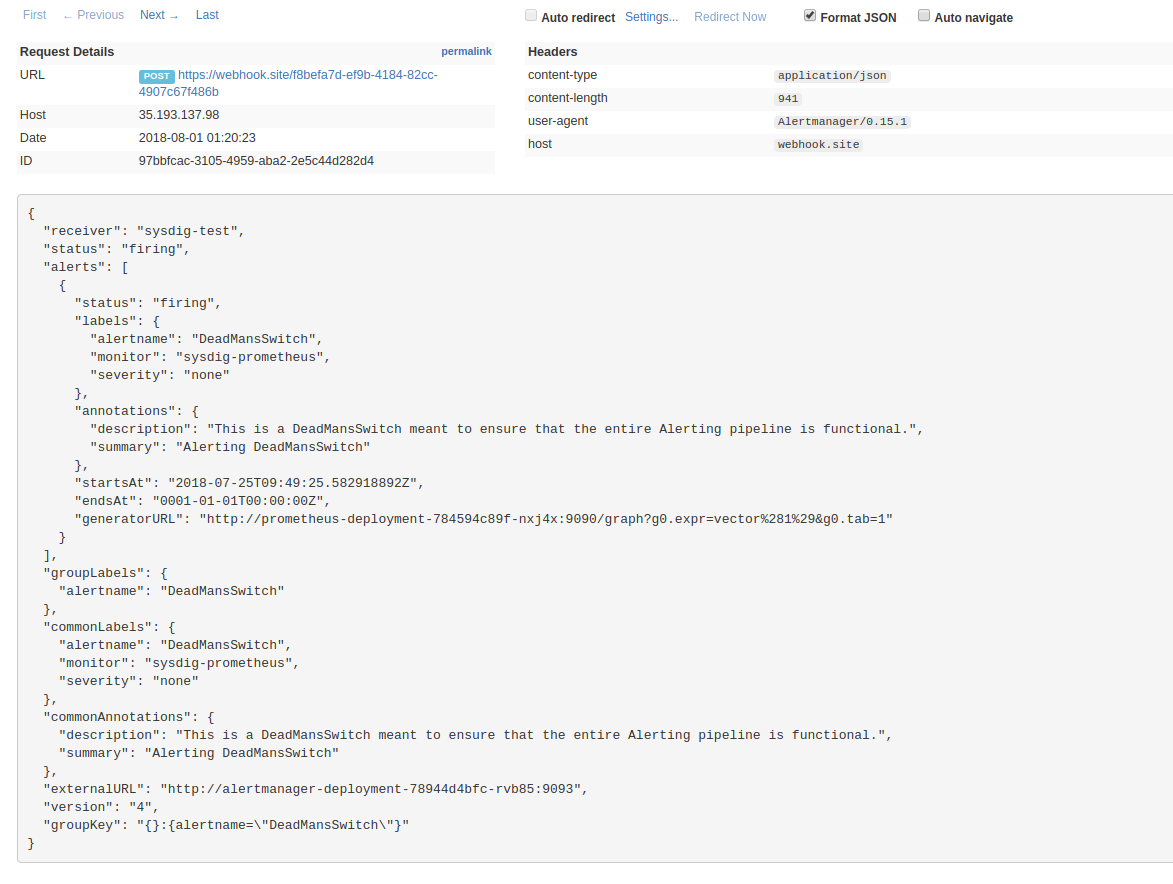
This configuration includes a "DeadManSwitch", this is, an alert that will always fire, intended to test that all the microservices Prometheus -> AlertManager -> Notification channels are working as intended:
Check the webhook URL, looking for the notification in JSON format:
Grafana, Kubernetes Monitoring with Prometheus – Dashboards
The Grafana project is an agnostic analytics and monitoring platform. It is not affiliated with Prometheus, but has become one of the most popular add-on components for creating a complete Prometheus solution.
We are going to use the Helm Kubernetes package manager for this deployment, which will enable us to ] configure Grafana using a set of repeatable ConfigMaps, avoiding any manual post-configuration:
Pay attention to the instructions that helm will output by console, especially those for how to retrieve your admin password:
You can directly forward the grafana service port to your local host to access the interface:
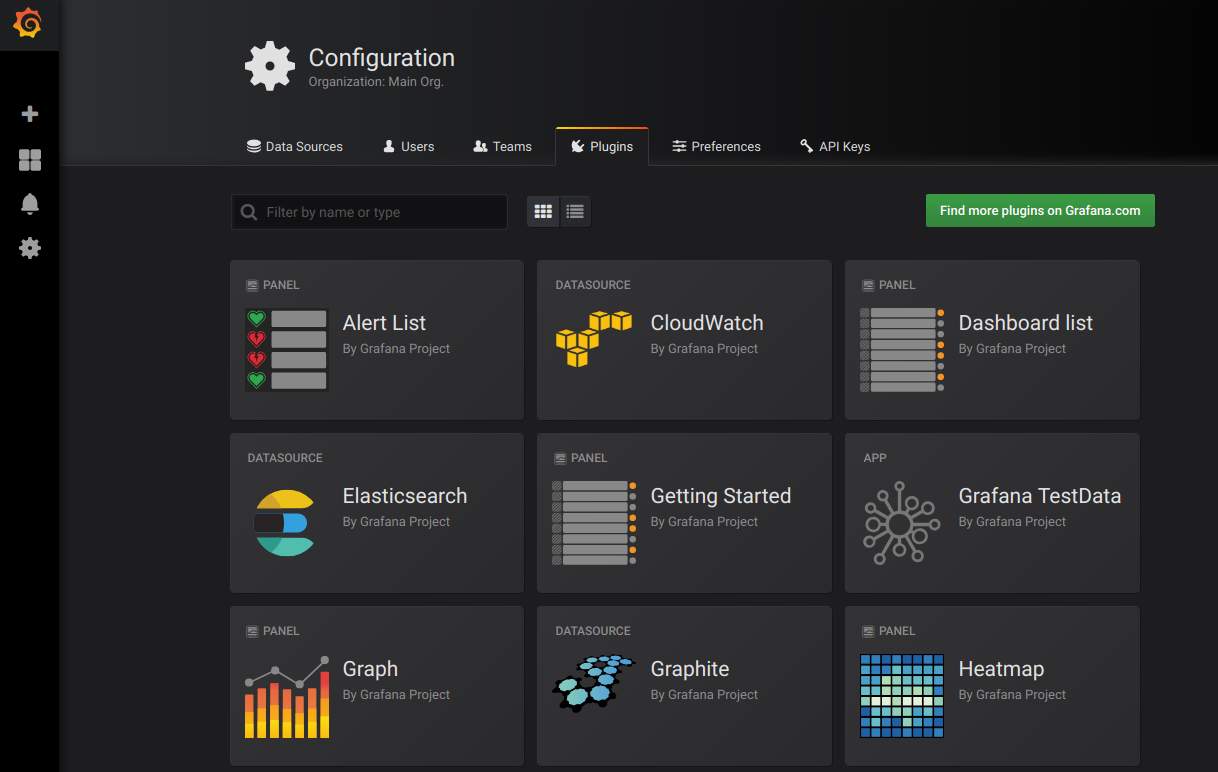
Go to http://localhost:3000 using your browser if you want to have a look at the interface:
Two configurations are required for Grafana to be useful:
- Data sources, the Prometheus server in our case
- The Dashboards to visualize your chosen metrics
Conveniently, you can (and should, if possible) autoconfigure both from config files:
Here again, we are using the Service abstraction to point at several Prometheus server nodes with just one url
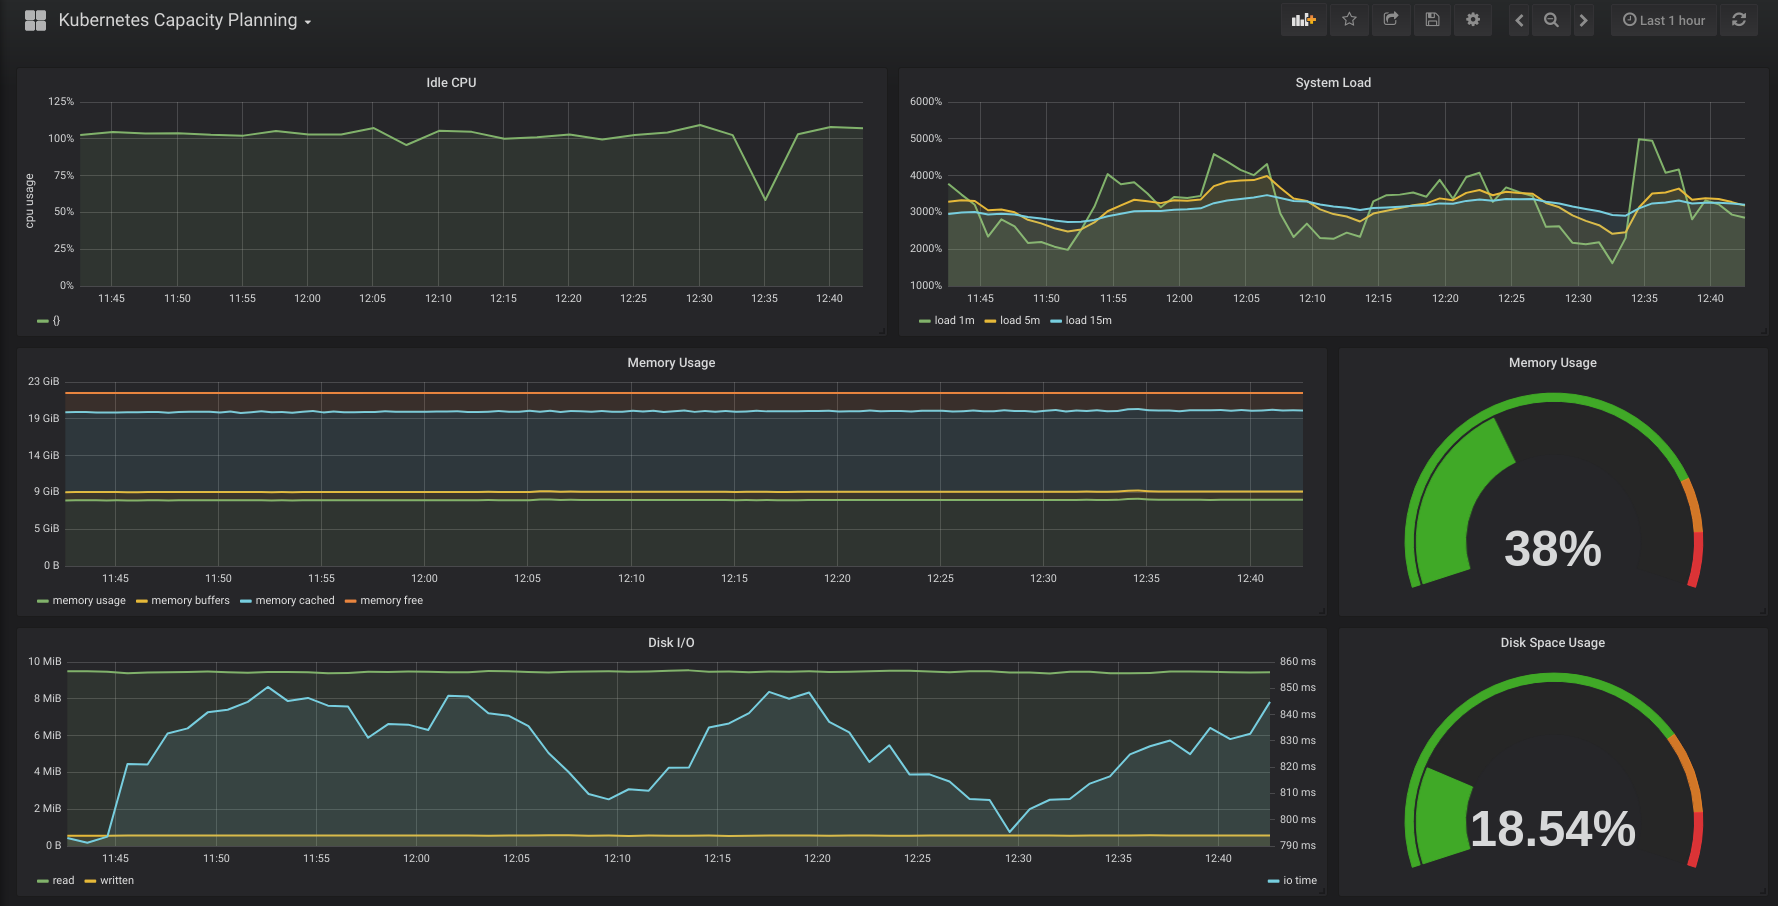
And then Grafana will provide the visualization and Dashboards for the metrics collected by Prometheus:
Prometheus metrics for ephemeral jobs – Push Gateway
Not every program is a continuously running service that you can expect to scrap at any random time. Every IT deployment has a myriad of one-off or cron tasks for backup, clean-up, maintenance, testing, etc.
You may want to collect some metrics from these tasks, but the target/scrap model of Prometheus is definitely not going to work here.
That's why the Prometheus project provides the Pushgateway service: push acceptor for ephemeral and batch jobs. You can push the metrics to the pushgateway and it will retain the information so it can be scraped later on.
Deploying a basic functional pushgateway is fairly simple:
Forward the service port of your pushgateway pod:
And try to post a metric using curl, which is basically what your batch jobs will do:
Now, you can scrape this metric normally, even if the original source is no longer running:
You just need to add the pushgateway as a regular scrape target in your Prometheus configuration to recover these additional metrics.
Prometheus Persistent metrics storage
The Prometheus server will store the metrics in a local folder, for a period of 15 days, by default. Also keep in mind that the default local Pod storage is ephemeral, which means that if the pod is replaced for any reason, then all the metrics will be gone.
Any production-ready deployment requires you to configure a persistent storage interface that will be able to maintain historical metrics data and survive pod restarts.
Again, Kubernetes already provides an abstraction that will fulfill this role: the PersistentVolume
However, as we just discussed, the PersistentVolume is just an abstraction for a data volume, so you need a hardware/software stack that provides the actual volumes.
There are several ways to accomplish this:
- Major cloud providers usually expose a volume orchestrator out of the box, so you don't need to install any additional software.
- If you are using your own hosts and don't have a storage provider yet, there are open source and CNCF-approved solutions like Rook
- You can also use Helm to install Rook if you want to get up and running quickly
- Several commercial storage solutions like NetApp also offer a compatibility layer for Kubernetes persistent volumes.
If you are planning to use stateful storage, then you could use Kubernetes StatefulSets rather than deployments. Every pod will be unambiguously tied to a separate PersistentVolume, so you can kill and recreate the pods and they will automatically attach the correct volume.
You can try to destroy the deployment and create a similar service using StatefulSets:
Every pod will create its own PersistentVolume:
There are three key differences between the deployment we were using before and this stateful set:
The API object type:
The VolumeClaim defining the storage that should be created for each pod in the set:
The Prometheus server parameters defining data directory and retention period:
On average, Prometheus uses only around 1-2 bytes per sample. Thus, to plan the capacity of a Prometheus server, you can use the rough formula:
Prometheus server(s) can also regularly forward the metrics to a remote endpoint and only store the last uncommited chunk of readings locally. Some cloud-scale / multisite Prometheus solutions like Cortex or Thanos solutions make use of this feature, we will cover them on the last chapter of this guide.
Conclusions
Part 1 of this guide explained the basics of the Prometheus service, its integration with the Kubernetes orchestrator and different microservices you can find on a typical cloud-scale deployment. With this discussion around adding alerts, dashboards and long term storage on top of the core Prometheus server here in Part 2, we are getting much closer to an viable monitoring solution.
In the next chapter we will explain how to use the Kubernetes version of the prometheus-operator, which enables faster deployment of a complete stack in a more automated, scalable and declarative way.