Falco Feeds extends the power of Falco by giving open source-focused companies access to expert-written rules that are continuously updated as new threats are discovered.

Christmas is almost here, and you're spending a few hours playing Counter-Strike: Global Offensive (CSGO). You might even be doing so on your own dedicated server. If that's the case, and you want to learn how to monitor your game, keep reading!
In this article, you'll learn how to install a CSGO server and monitor it, along with the instance in which it's running.
Prometheus, of course, but what exporters?
- SRCDS Gameserver Prometheus exporter, for the CSGO server.
- CAdvisor, to analyze the instance's resource usage.
- Node Exporter, to get the instance's OS metrics.

How to install CSGO server, Prometheus, and the exporters
We used an empty Ubuntu 20.04 LTS instance in an EC2 instance for this project, and launched the CSGO server, Prometheus, and the exporters by using Docker and Docker Compose.
Note that you need to install Docker. In this scenario, we followed the installation instructions for Ubuntu.
Configure and launch the containers
First, let's write the configuration file for Prometheus. Create a prometheus folder with a prometheus.yaml file inside. This is its content:
global:
external_labels:
origin: prometheus-ec2-csgo
scrape_configs:
- job_name: prometheus
static_configs:
- targets:
- localhost:9090
- localhost:9100
- localhost:8080
- localhost:9137
Next, let's configure the CSGO server, creating a srcds.yaml file, with the following content:
options:
connectTimeout: 60s
cacheExpiration: 15s
cacheCleanupInterval: 11s
servers:
csgo:
address: localhost:27015
rconPassword:
Here's our docker-compose.yaml:
version: "3.3"
services:
csgo:
image: timche/csgo
container_name: csgo-ds
environment:
CSGO_GSLT:
CSGO_HOSTNAME: CSGOSERVER
CSGO_PW:
CSGO_RCON_PW:
CSGO_PORT: 27017
volumes:
- type: bind
source: /opt/csgo/csgo-data/
target: /opt/app/static
network_mode: host
restart: unless-stopped
csgo-updater:
image: timche/csgo-updater
container_name: csgo-updater
volumes:
- type: bind
source: /var/run/docker.sock
target: /var/run/docker.sock
prometheus:
image: quay.io/prometheus/prometheus:v2.31.1
container_name: prometheus
volumes:
- ./prometheus/:/etc/prometheus/
- /opt/prometheus/prometheus_data:/prometheus
command:
- '--config.file=/etc/prometheus/prometheus.yaml'
- '--storage.tsdb.path=/prometheus'
network_mode: host
cadvisor:
image: gcr.io/cadvisor/cadvisor
volumes:
- /:/rootfs:ro
- /var/run:/var/run:rw
- /sys:/sys:ro
- /var/lib/docker/:/var/lib/docker:ro
ports:
- 8080:8080
restart: always
deploy:
mode: global
node-exporter:
image: prom/node-exporter
volumes:
- /proc:/host/proc:ro
- /sys:/host/sys:ro
- /:/rootfs:ro
command:
- '--path.procfs=/host/proc'
- '--path.sysfs=/host/sys'
- --collector.filesystem.ignored-mount-points
- "^/(sys|proc|dev|host|etc|rootfs/var/lib/docker/containers|rootfs/var/lib/docker/overlay2|rootfs/run/docker/netns|rootfs/var/lib/docker/aufs)($|/)"
ports:
- 9100:9100
restart: always
csgo-exporter:
image: quay.io/galexrt/srcds_exporter:v0.0.1
container_name: csgo-exporter
command: ["/bin/srcds_exporter", "--config.file","/tmp/csgo/srcds.yaml"]
network_mode: host
volumes:
- type: bind
source: /home/ubuntu/srcds.yaml
target: /tmp/csgo/srcds.yaml
Remember to change the passwords, replacing the strings. Also, create a steam token and place it in the slot in the CSGO server configuration YAML.
Now, just start all the containers with the following:
docker-compose up -d
You can see if everything is OK by checking what containers are running:
docker ps

Check the Prometheus dashboard
Normally, ports aren't exposed by default when we create cloud instances, and for security reasons, we won't do it. Let's use a port forward to our local machine to access the Prometheus dashboard safely.
ssh -f -N -i "" -L 9090:localhost:9090 @
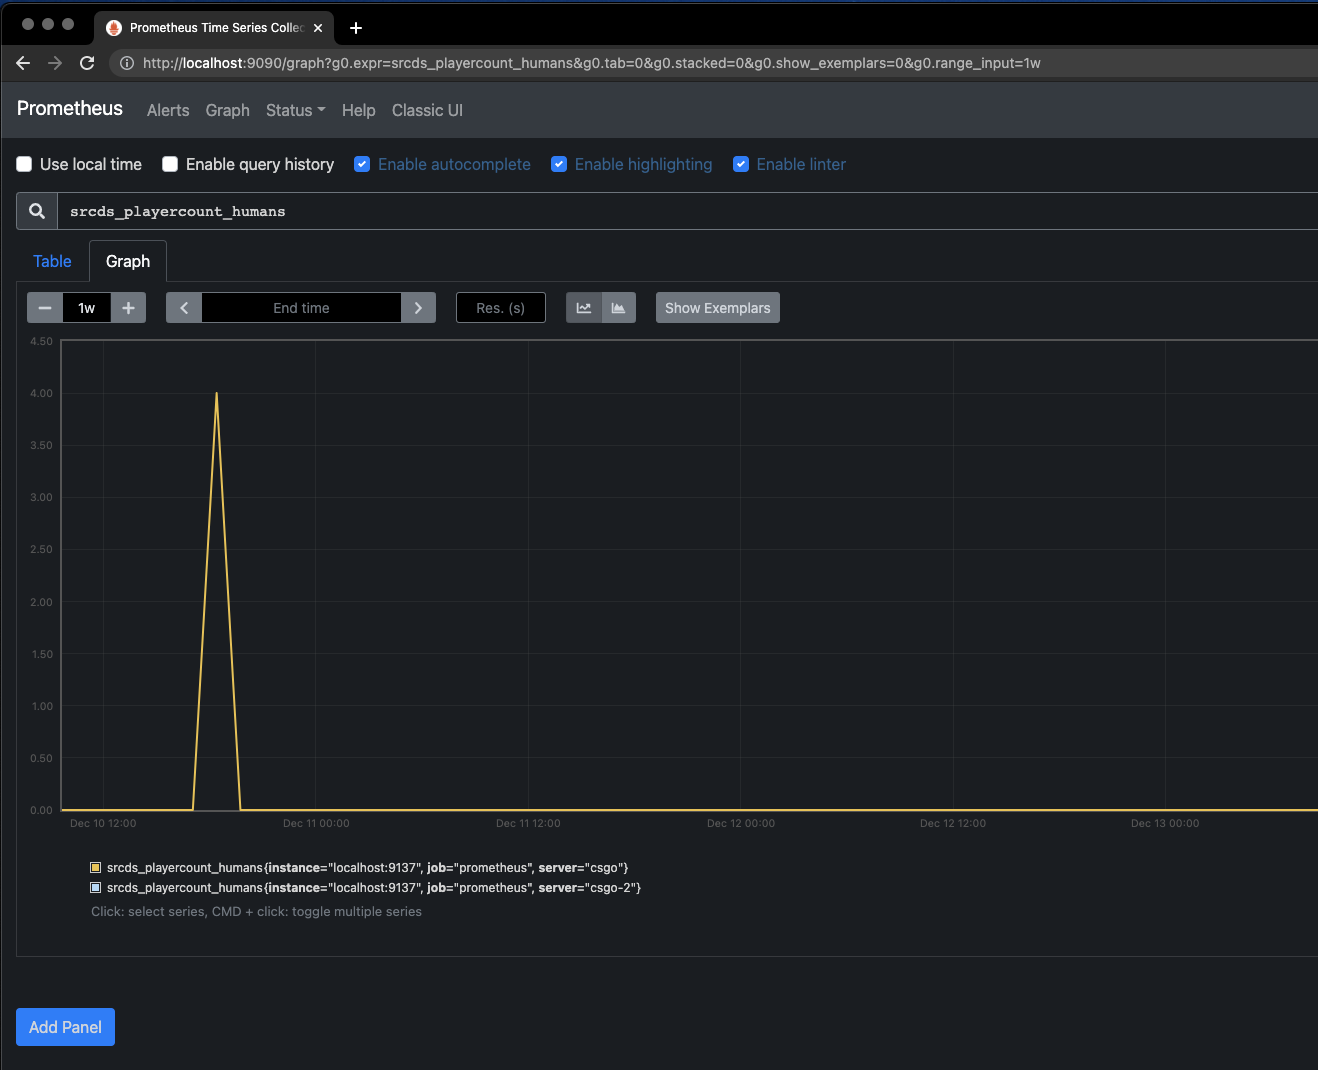
Now, go to your browser and type localhost:9090… et voilà
CSGO Metrics
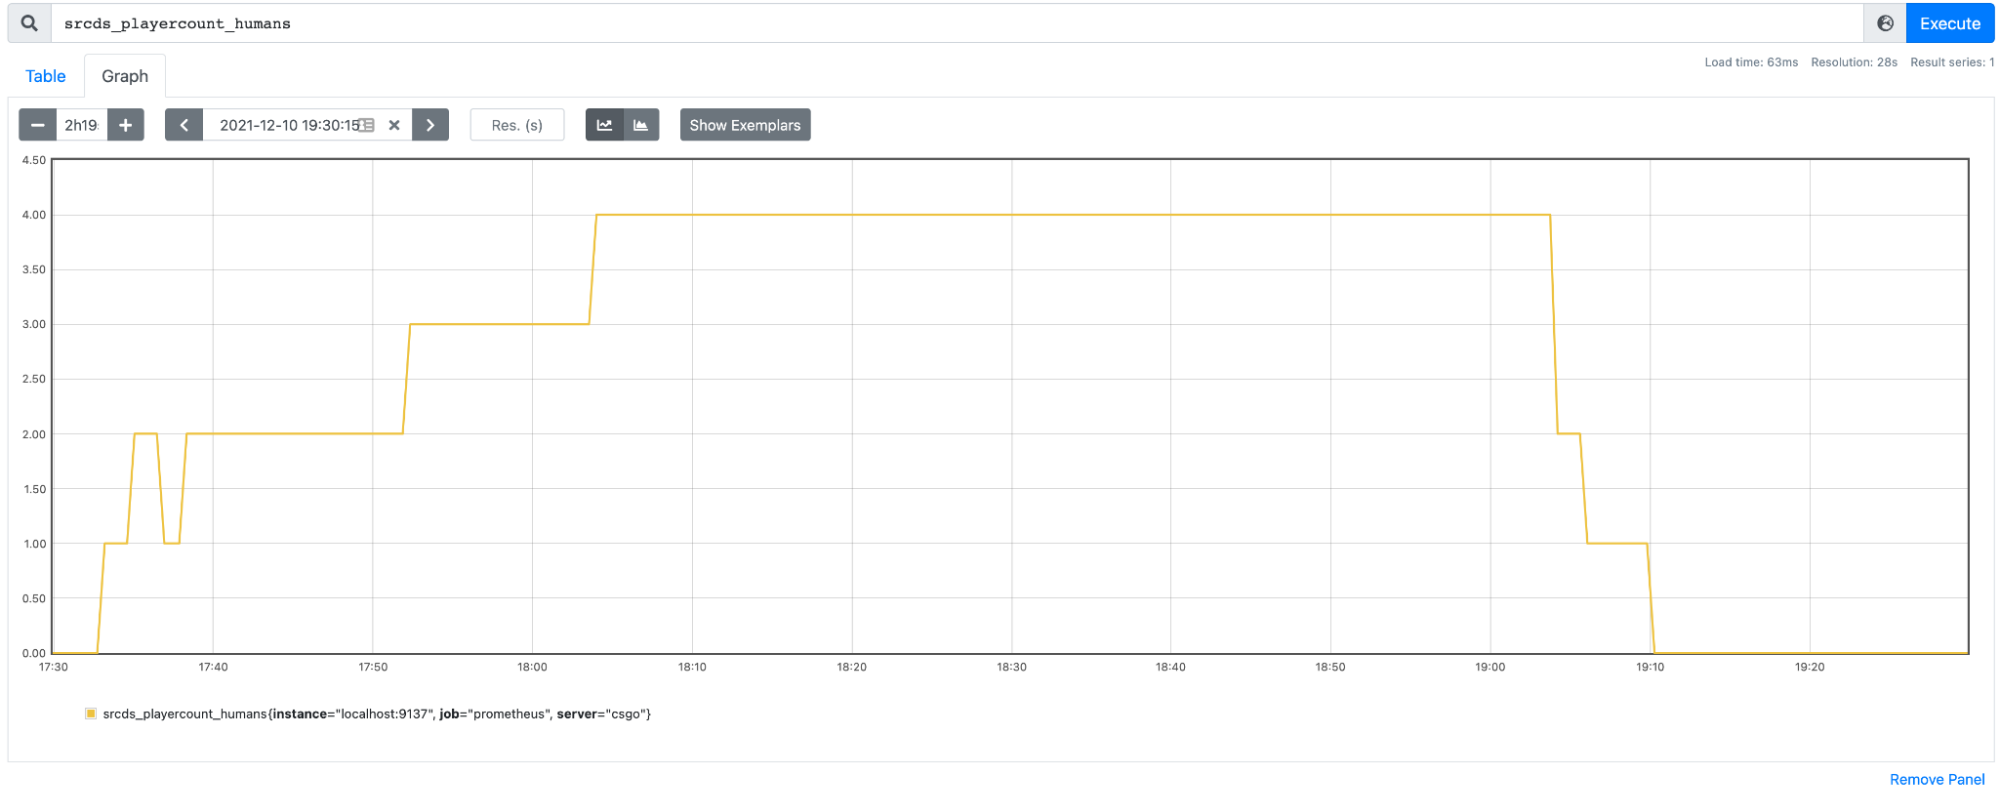
You can get the number of human players in the game by using srcds_playercount_humans.
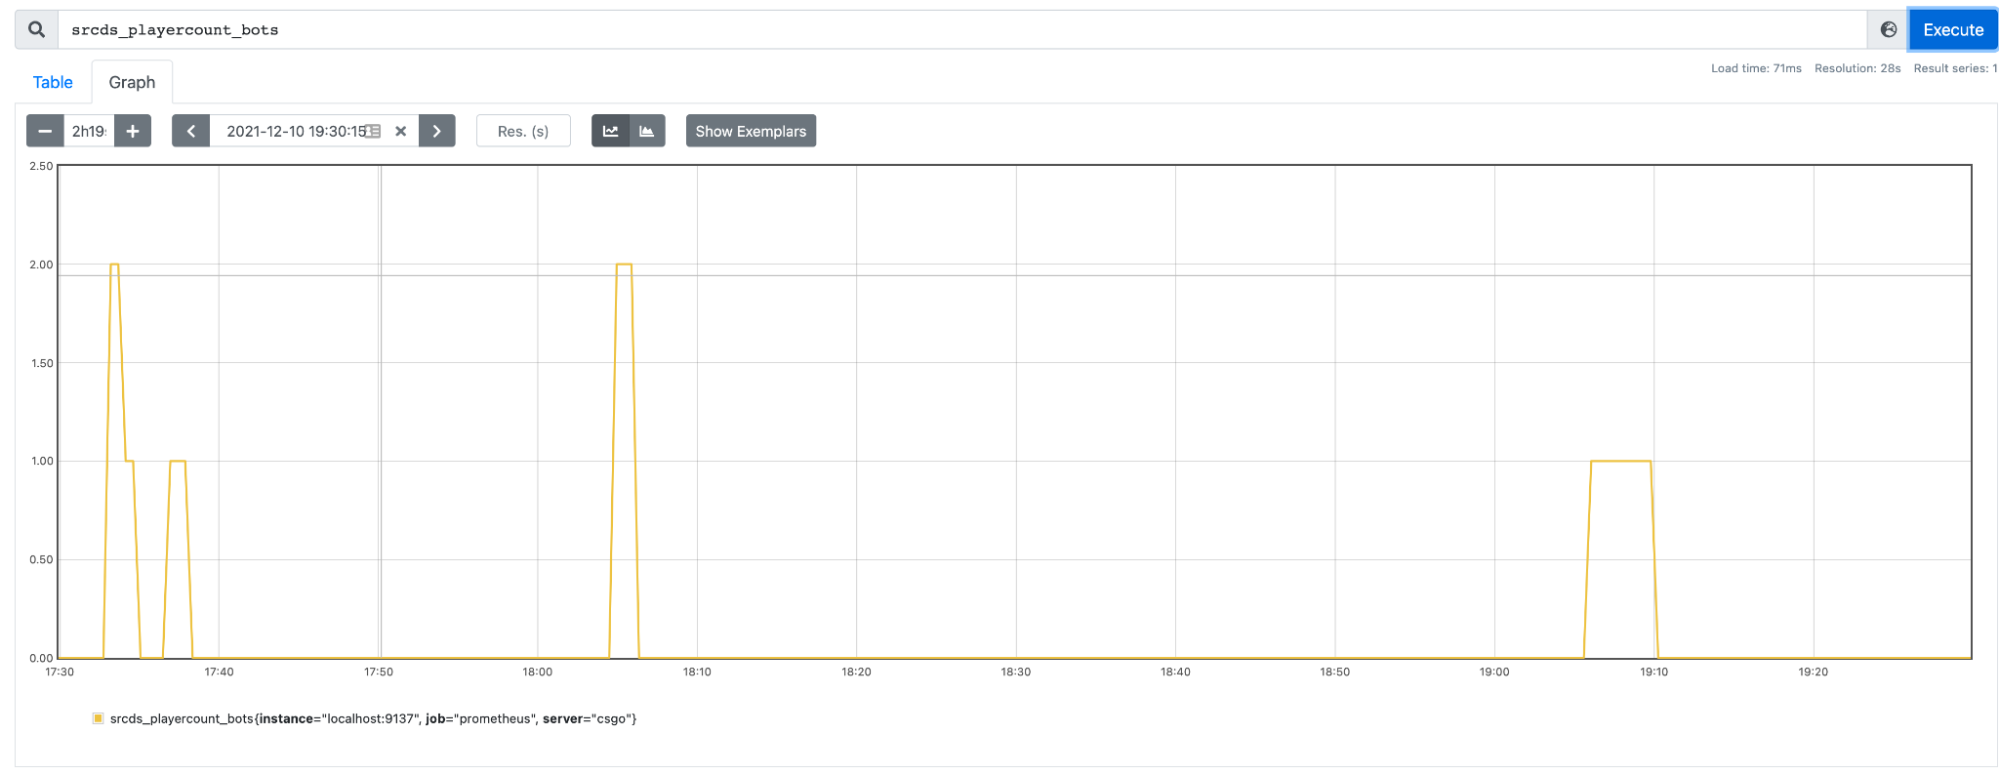
To get the number of bot players in the game, use srcds_playercount_bots.
You can calculate the percentage of the usage of your server as well, with
srcds_playercount_humans{server=~$server}/ srcds_playercount_limit{server=~$server}
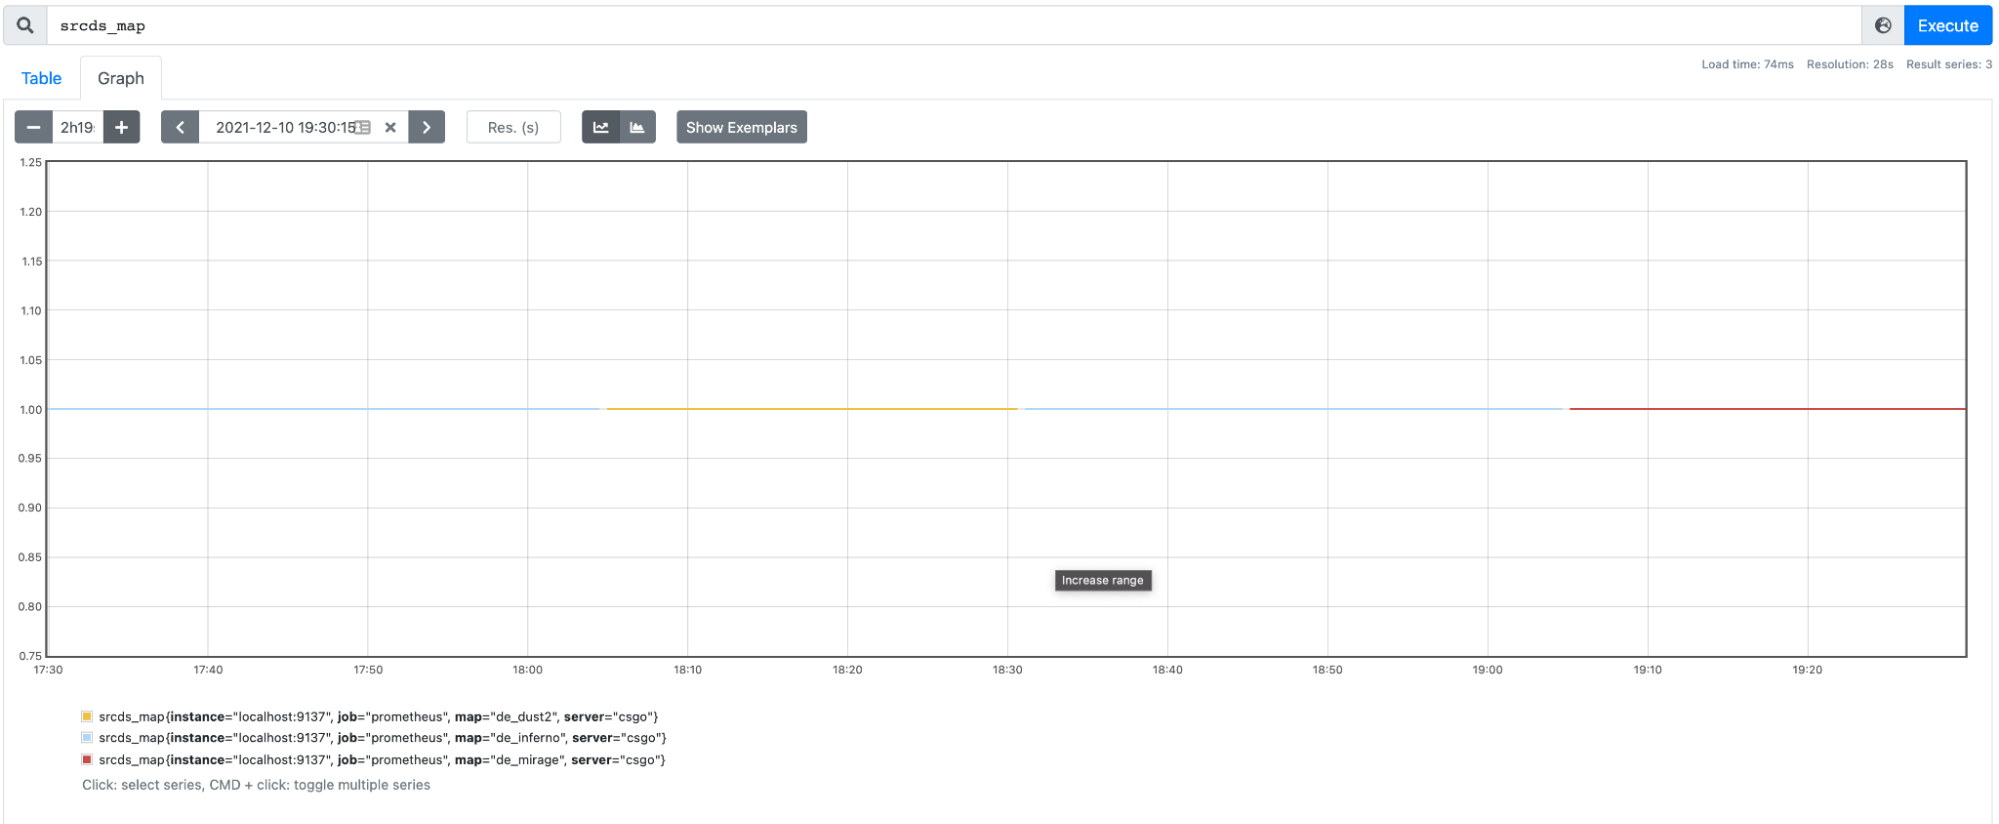
To check the current map being played, just use srcds_map.
Instance Metrics
Monitoring CSGO is useful, but you also need to have a picture of how it's performing in the cloud instance.
You could get valuable knowledge from these metrics. For example, you might be using a more powerful machine than you actually need. So, maybe this will help you save some money.
Memory
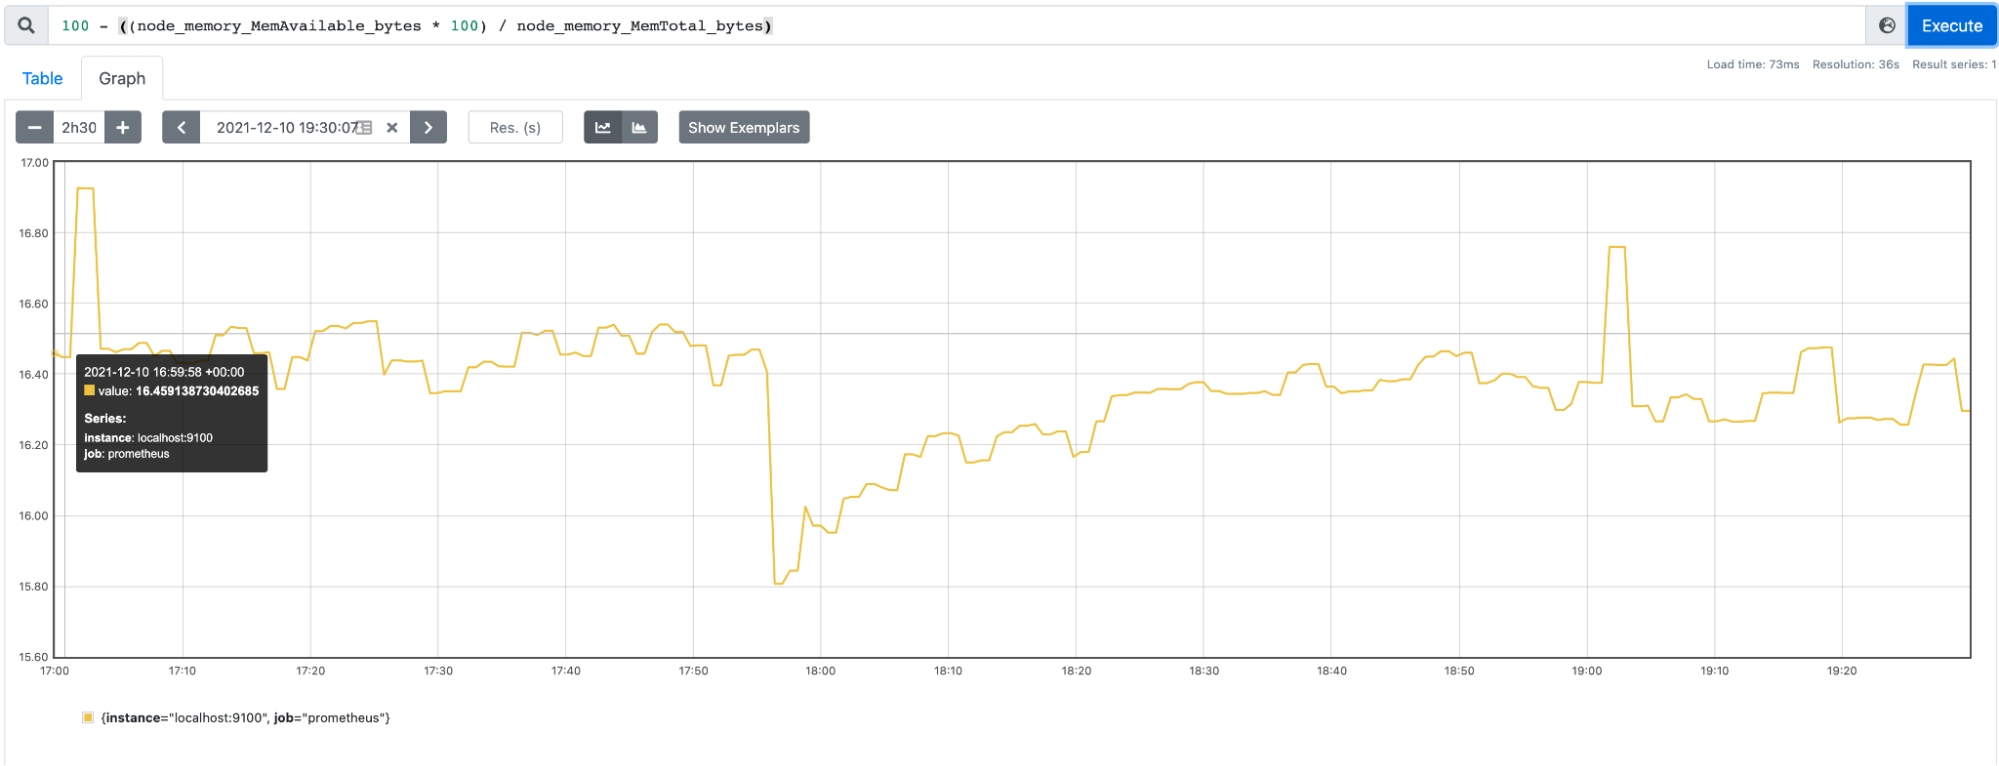
First, let's see how much memory is being used in the instance, in percentage:
100 - ((node_memory_MemAvailable_bytes * 100) / node_memory_MemTotal_bytes)
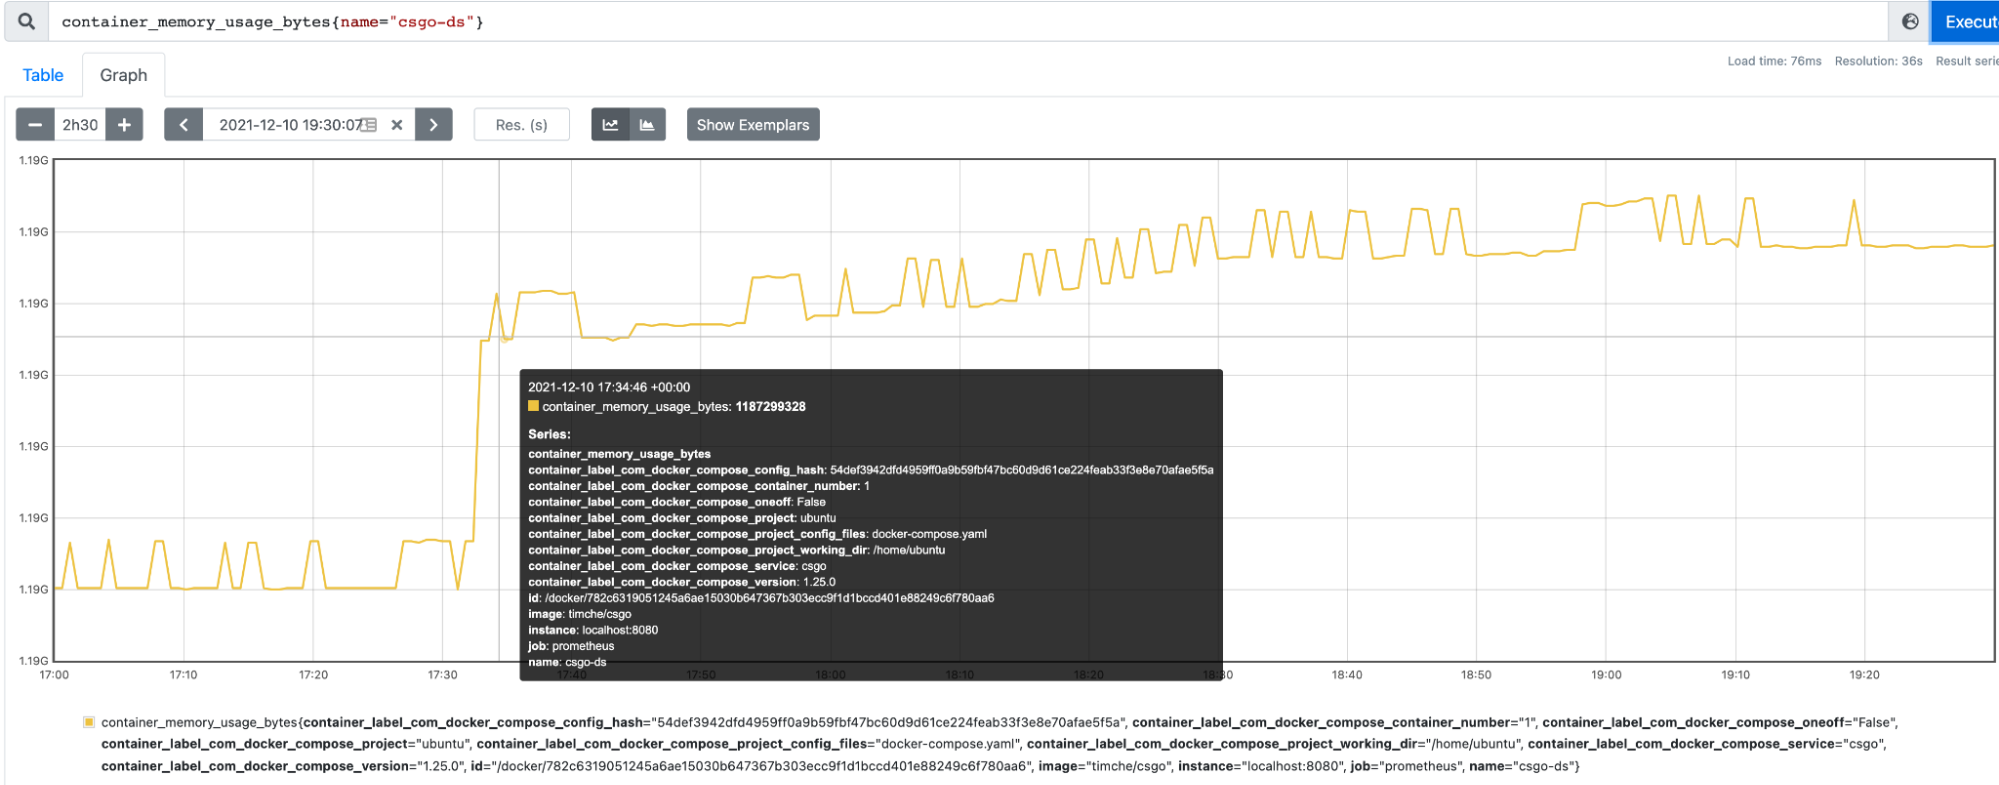
Another interesting metric is the memory used (in seconds) by the CSGO server container.
container_memory_usage_bytes{name="csgo-ds"}
CPU
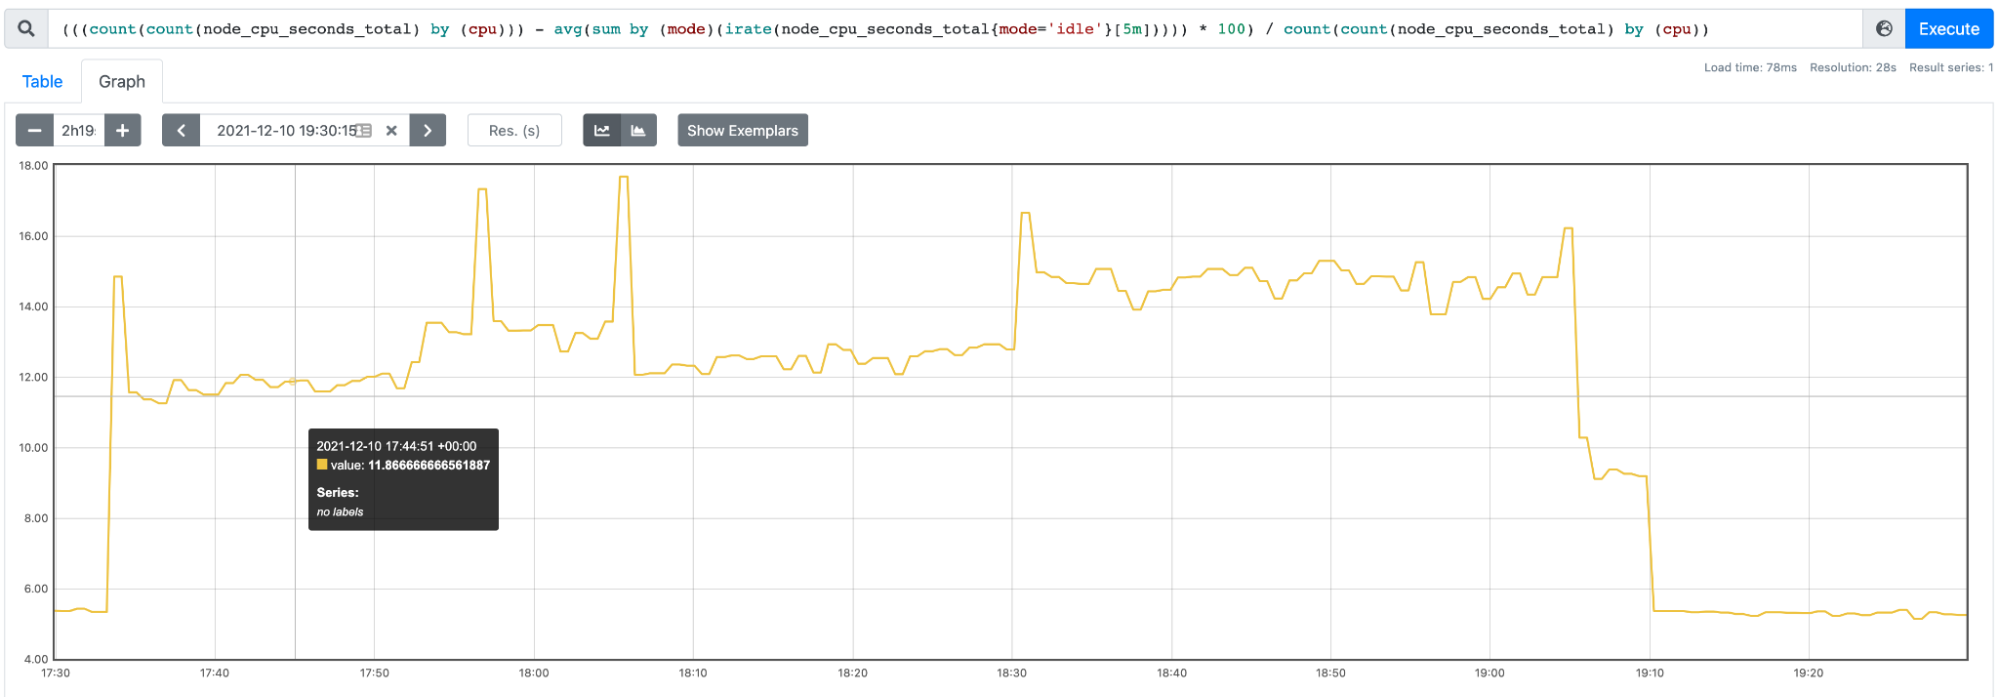
Let's check what the overall CPU usage of the container is, in percentage. Or in other words, how busy the CPU is:
(((count(count(node_cpu_seconds_total) by (cpu))) - avg(sum by (mode)(irate(node_cpu_seconds_total{mode='idle'}[5m])))) * 100) / count(count(node_cpu_seconds_total) by (cpu))
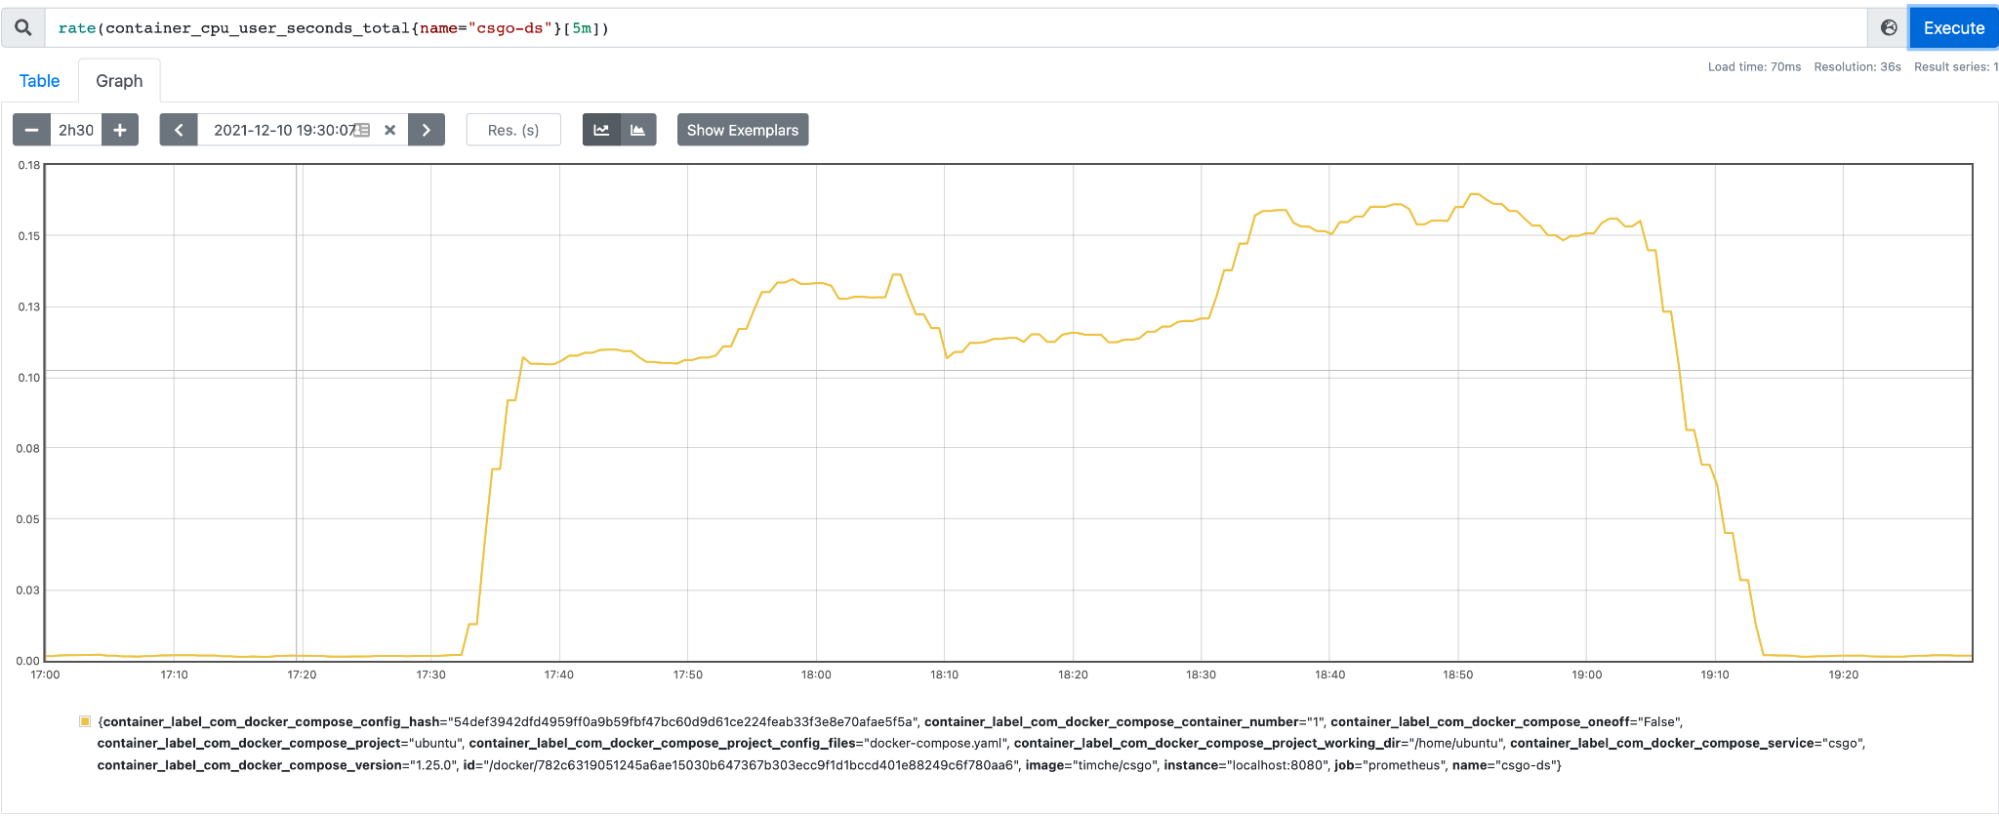
Now, check how much CPU the CSGO server container is using:
rate(container_cpu_user_seconds_total{name="csgo-ds"}[5m])
Wait! Where's the latency?!
We didn't measure the latency because the client connects to the server through UDP, so the server can't know what the latency of the communication is.
Start the match!
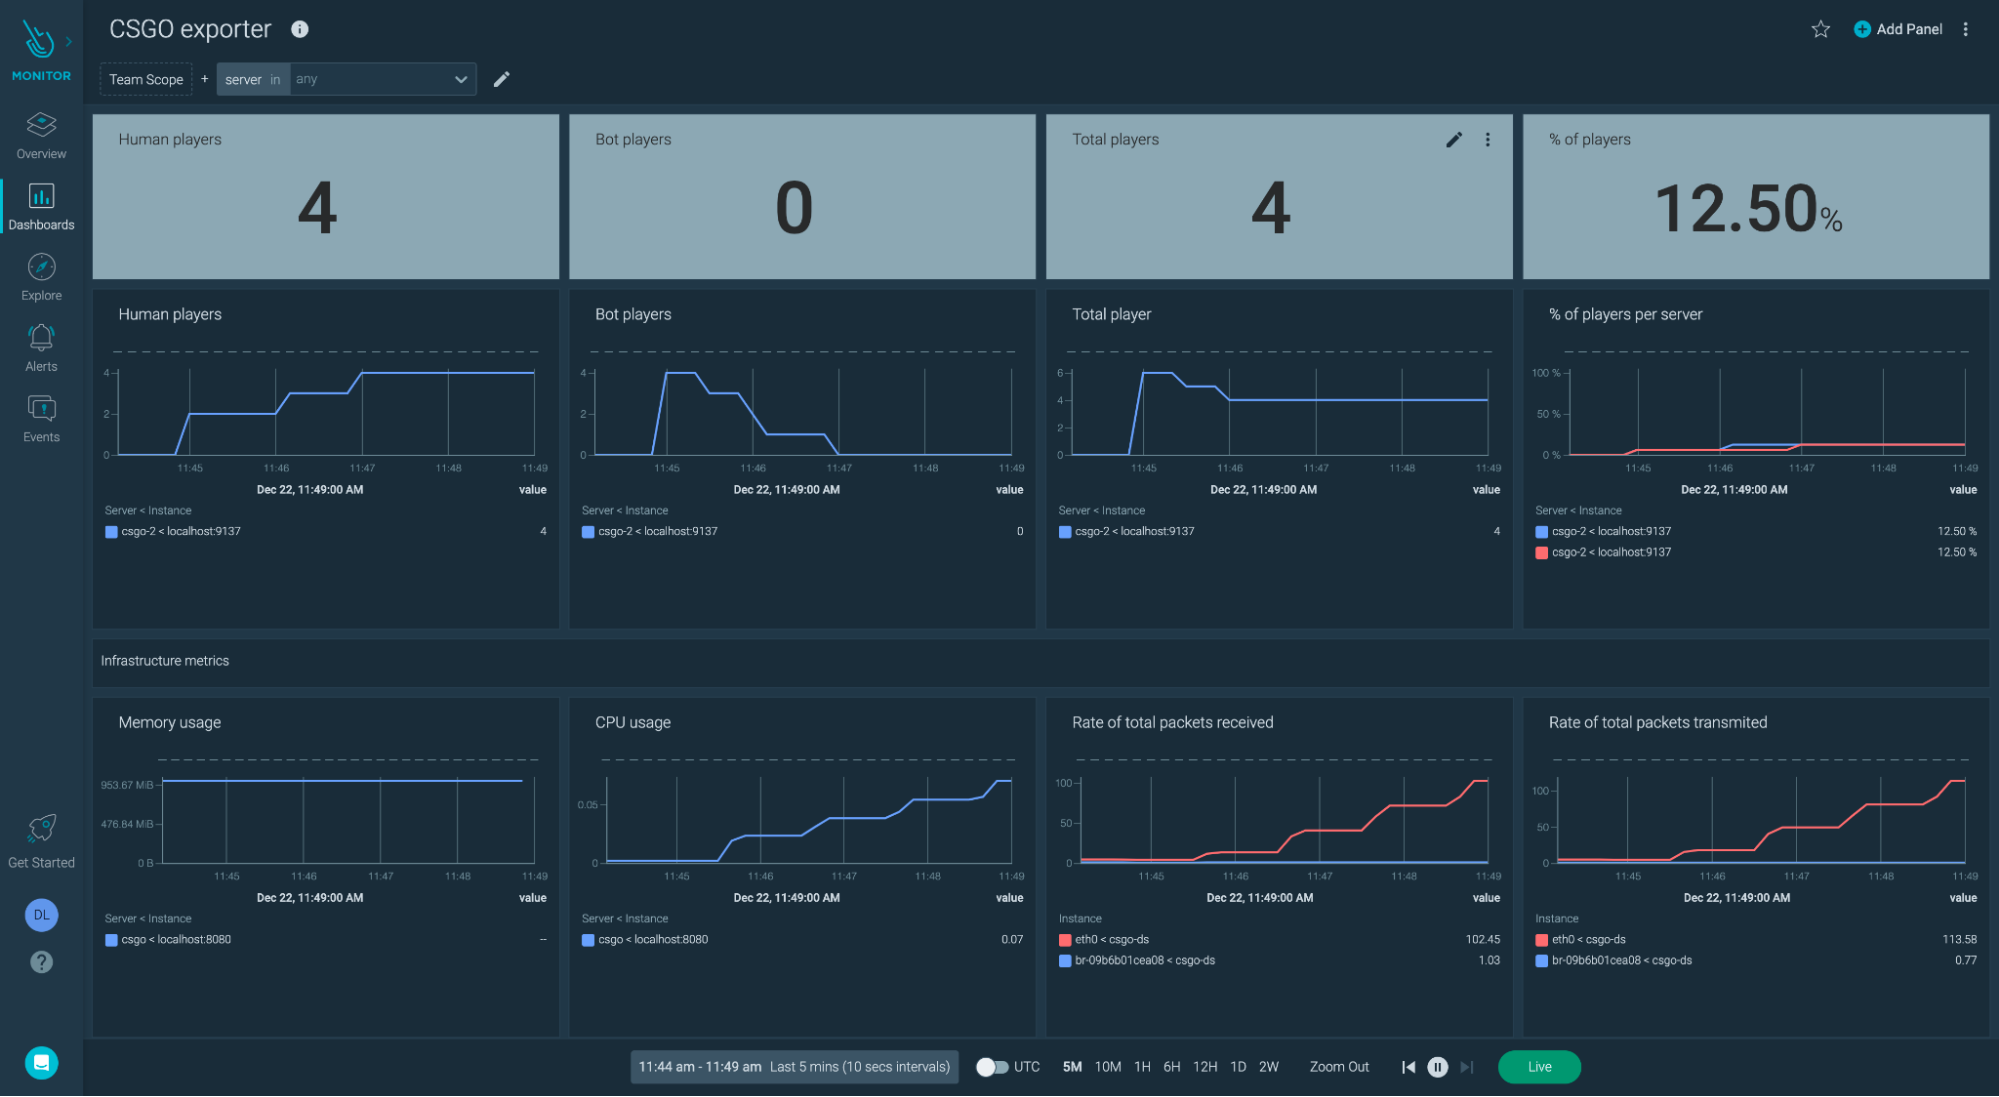
In this article, you learned how to install the CSGO server in a cloud instance, and how to monitor it with Prometheus along with the instance.
Also, you read the list of the most interesting metrics for this project. Now, start the match with your friends and enjoy the Christmas holidays. Merry Christmas and happy new year!!
Register now for the free Sysdig Monitor trial and start monitoring right away with Sysdig's managed Prometheus service.


