


Falco Feeds extends the power of Falco by giving open source-focused companies access to expert-written rules that are continuously updated as new threats are discovered.

In this article, you will learn how to monitor SQL Server with Prometheus. SQL Server is a popular database, which is very straightforward to monitor with a simple Prometheus exporter.
Like all databases, SQL Server has many points of failure, such as delays in transactions or too many connections in the database. We are basing this guide on Golden Signals, a reduced set of metrics that offer a wide view of a service from a user or consumer perspective. This allows you to detect potential problems that might be directly affecting the behavior of the application.
Monitor SQL Server with Prometheus
To monitor SQL Server with Prometheus, we'll use sql_exporter, a specific exporter for SQL Server. This exporter will expose the metrics so Prometheus can get them.
Also, the flexibility of this exporter allows you to create any custom metric depending on your business, so you can monitor almost everything.
To get the metrics in Prometheus, you just need to create a specific job or annotate the pod if you have deployed the exporter in Kubernetes.
Now that you started to monitor SQL Server with Prometheus, let's see what metrics we should keep an eye on and create some alerts.
What you should look at
Is the database up?
You can check if the database is up and running using the up metric.
Let's create a PromQL alert to check that the database is up:
up{job="mssql"} == 0Deadlocks
You can check that there are no deadlocks in your database with the mssql_deadlocks metric. A deadlock occurs when two processes with exclusive locks want to access the same resources. Only one will get access and the other one will be killed by the database.
Let's create an alert if the number of deadlocks increases to five in a one-minute timeframe:
increase(mssql_deadlocks[1m]) > 5Disk space
Not having enough space on the disk will crush your database. For this, you'll use the mssql_disk_space_used_bytes_total metric, combined with mssql_disk_space_available_bytes_total, that returns the disk usage and the total space available, both in bytes.
Let's create an alert if the database is using more than 85% of the available space:
sum(mssql_disk_space_available_bytes_total{job=~"mssql"})/sum(mssql_disk_space_total_bytes_total{job=~"mssql"}) < 0.15Creating custom metrics
It's also possible to create custom queries for monitoring certain things that have to do with your business. You could create a metric for getting the total amount invoiced today for your e-commerce, for example.
For this, you'll need to create a new data entry for the collector in the mssql-metrics-config ConfigMap:
apiVersion: v1
kind: ConfigMap
metadata:
  namespace: mssql
  name: mssql-metrics-config
  labels:
    app: mssql-exporter
data:
  sql_custom_invoice.collector.yml:
    collector_name: sql_custom_invoice
    metrics:
      - metric_name: total_invoiced_today
        type: gauge
        help: 'Get total amount invoiced today.'
        values: [invoiced_today_sum]
        query_ref: total_invoiced_today_query

    queries:
      - query_name: total_invoiced_today_query
        query: |
          SELECT sum(total) AS invoiced_today_sum FROM Invoice where invoiceDate=CAST(GETDATE() AS date);
Then add the collector in the target collectors, in sql_exporter.yml, line 21:
target:
  collectors: [mssql_standard, sql_custom_invoice]
Make sure that the collector file name ends with .collector.yml.
Create a dashboard in a few minutes
In this article, you learned how to monitor SQL Server with Prometheus and identify the key metrics you should look at, with examples. You also learned how to create custom metrics based on your business needs.
All these metrics are available in the dashboards you can download from PromCat. They can be used in Grafana and Sysdig Monitor as well!
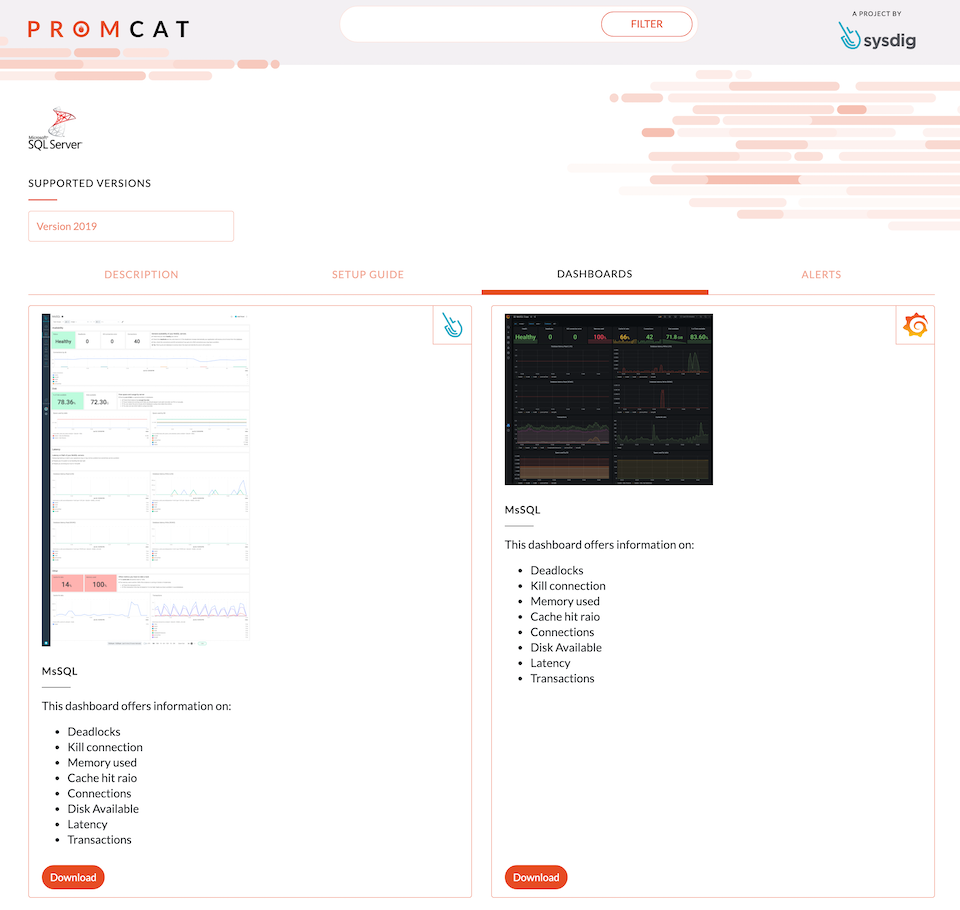
This dashboard will allow you to see the full picture when troubleshooting and performing improvements in our Microsoft SQL Server instance.
If you would like to try this integration, we invite you to sign up for a free trial of Sysdig Monitor.