


Falco Feeds extends the power of Falco by giving open source-focused companies access to expert-written rules that are continuously updated as new threats are discovered.

Many others have written about the challenge of greedy neighbors, especially for virtual machines running in AWS. But now with the shift to containers, the greedy container monitoring problem becomes even more challenging. In many cases you don't care about the overall utilization of the underlying VMs as much as you need to understand resource consumption on a per container or per service basis.
Why does this matter? Maybe a service is not performing well because we assigned too few CPU cycles to it. Or perhaps our service is over-provisioned, and we would like to know if we can shut down nodes (and cut our bills) without performance regressions.
In this post I'm going to show you how you can actually see which containers are getting, say, 300% of allocated CPU and which ones are getting the short end of the stick. But first let's do a deep dive on how resource allocation for containers actually works.
Under the hood – allocating container resources
Containers – and the orchestration tools that manage them – allow you to specify the amount of resources your container/pod/service requires. Orchestration tools can then automatically place your container on hosts that have that amount of resources available.
Allocation of memory and CPU leverages a feature of the kernel named Cgroups – a key building block of containers. Many Cgroup parameters are exposed directly by container runtimes like Docker.
In particular we are interested in these fields of a container configuration:
For example, here is a basic Docker command to set the resources of an Ubuntu container:
$ docker run -it --memory "300M" --cpu-shares=1024 ubuntu:14.04 /bin/bash
Memory Limit is pretty straightforward. If we set it to 512 MiB, an attempt of allocating more memory by the container will let it go Out Of Memory (and killed) or it will be swapped.
CPU usage is more complicated, as there are two kinds of limits you can set:
- Shares are relative weights assigned to a container, it means that the amount of CPU available is equal to the sum of all the shares. Each container receives its own slice, but can consume more if the CPU has cycles that aren't being consumed by the container it was originally allocated to.
- Quota/Period is hard limit based on a percentage of time. You can assign a quota in ms relative to a period, the process will be able to spend on CPU only that fraction of time in a period.
With these basics under our belt, let's go into how we can visualize these resources for better container monitoring.
Visualizing Memory allocation
Let's start with memory, as it's more straightforward. In Sysdig Cloud you can find the percentage of limit used in our new metric memory.limit.used.percent. Charting this metric helps you understand if you provisioned the correct amount of memory for your app.
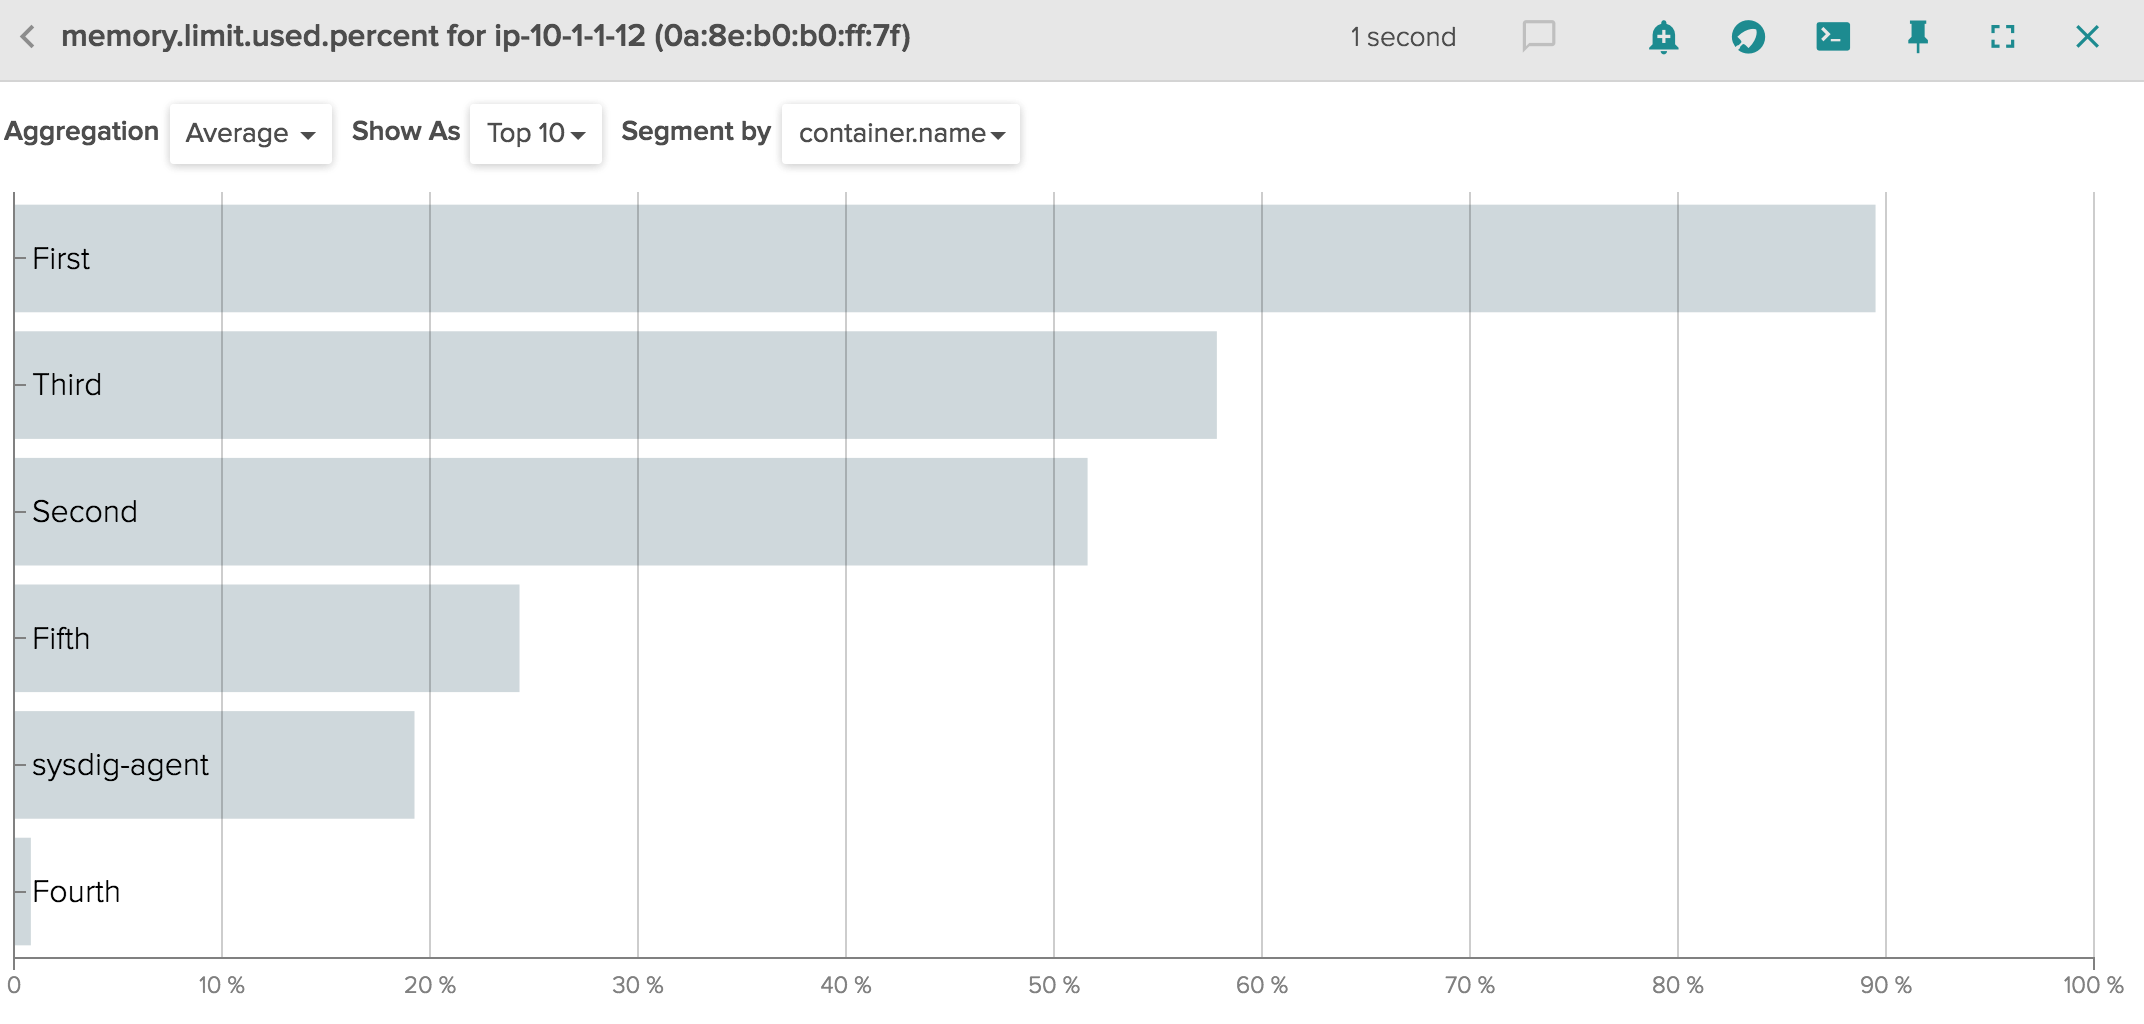
As you can see above, all pods are running well below their allocated memory, and so we're in good shape. You could of course set alerts in Sysdig Cloud to inform you when a container or a pod is approaching its memory limit.
Now let's take a look at CPU, which is a bit more complicated.
Visualizing CPU Shares
For CPU, let's start by visualizing shares. Imagine a host with 1 core and 3 containers using as much as CPU as possible. We assign 1024 shares to one container and 512 shares to the other two. This is what we get:
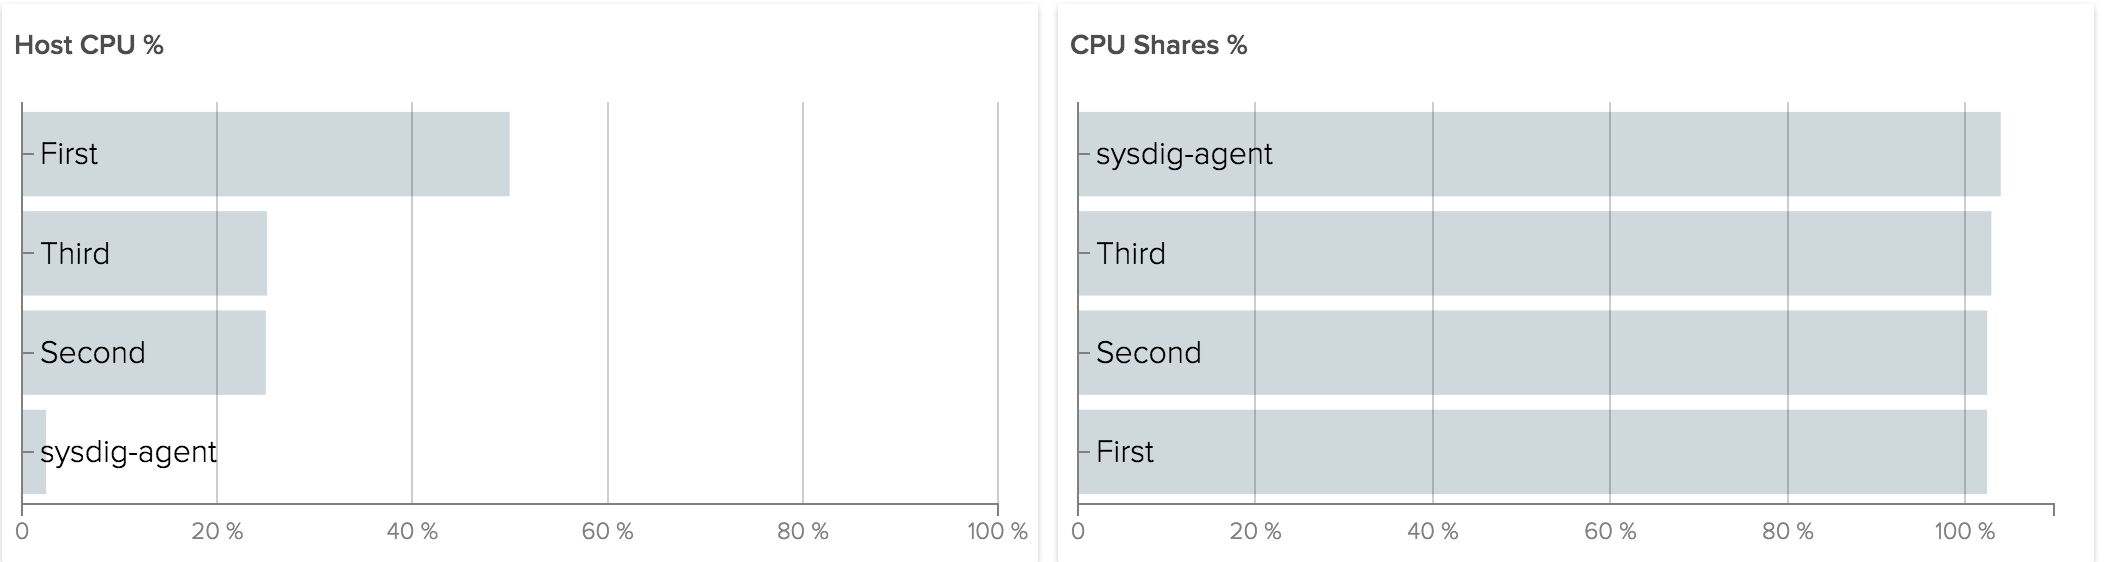
"First" is using 2x Host CPU than others because it has 2x shares. All of them are using 100% of CPU shares assigned. But what happens if "Third" does not need any cpu at all?
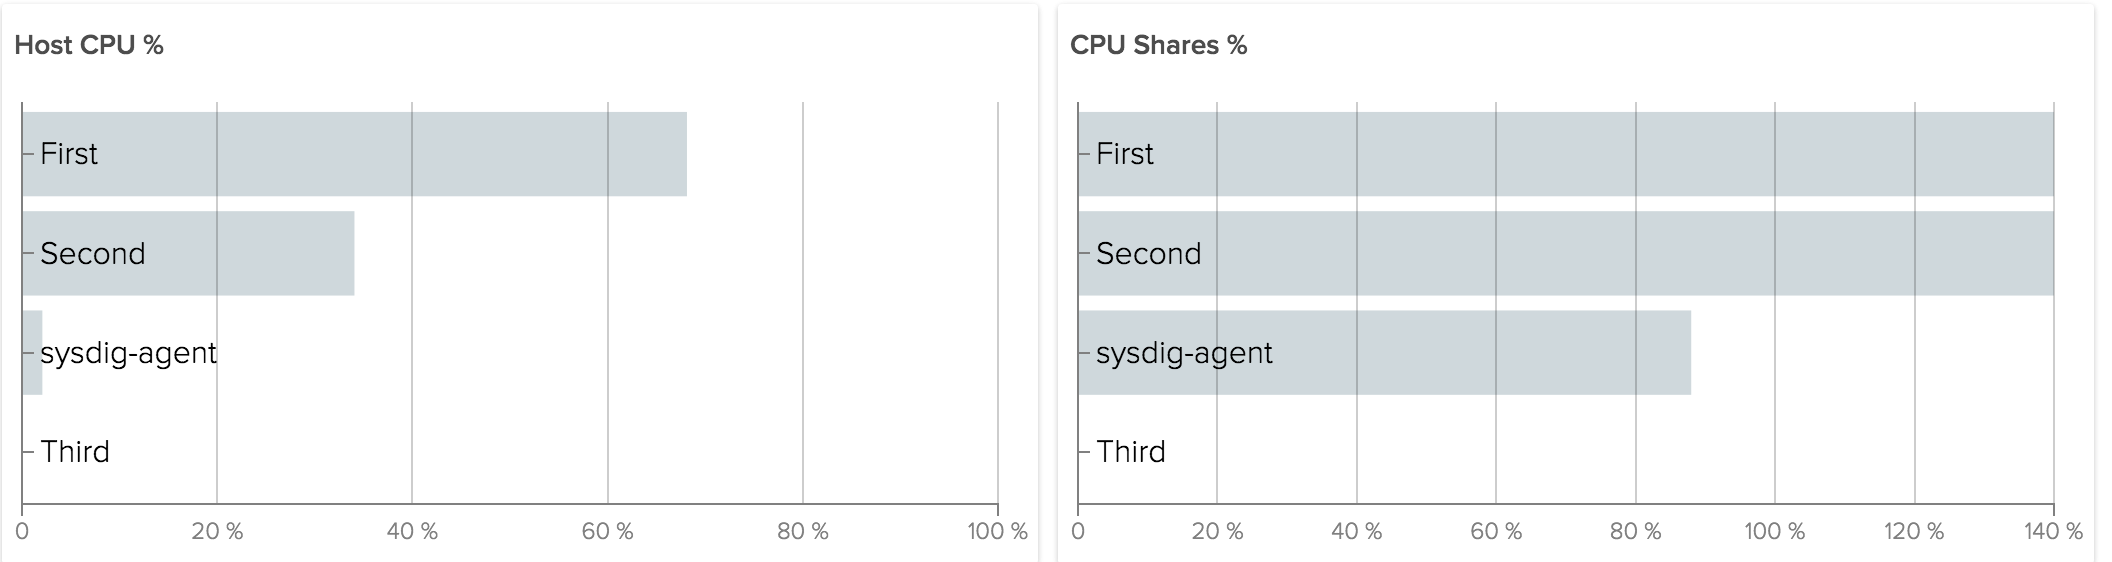
The amount of unused shares are given to others relative to their weight. So if "Third" is not using any of its CPU shares, First and Second instead are using 140% of CPU Shares. In general it's ok to consume more shares than originally allocated, because the kernel tries not to waste CPU.
A percentage of shares used that's consistently over 100 means we are not allocating enough resources to our services. The implication in the example above is that "First" and "Second" were able to consume much more CPU than they were originally allocated. If either of those were, for example, a web server, it likely means we are allocating fewer CPU than it needs to complete current user requests (that's not a good situation). If either were a batch processing job it means the job can use more CPU to finish faster (good, but maybe not critical).
Visualizing CPU Quota
Giving processes the maximum available CPU may be not always be what you want. If your cluster is multi-tenant, or if you just need a safe ceiling for an unpredictable application, you might like to implement a hard limit on CPU utilization. The Linux kernel supports absolute CPU limits with CPU quota. You assign a quota in ms relative to a period, the process will be able to spend on CPU only that fraction of time in a period.
For example let's consider the same case as above, now with a quota of 50ms/100ms for First and 25ms/100ms for Second and Third:
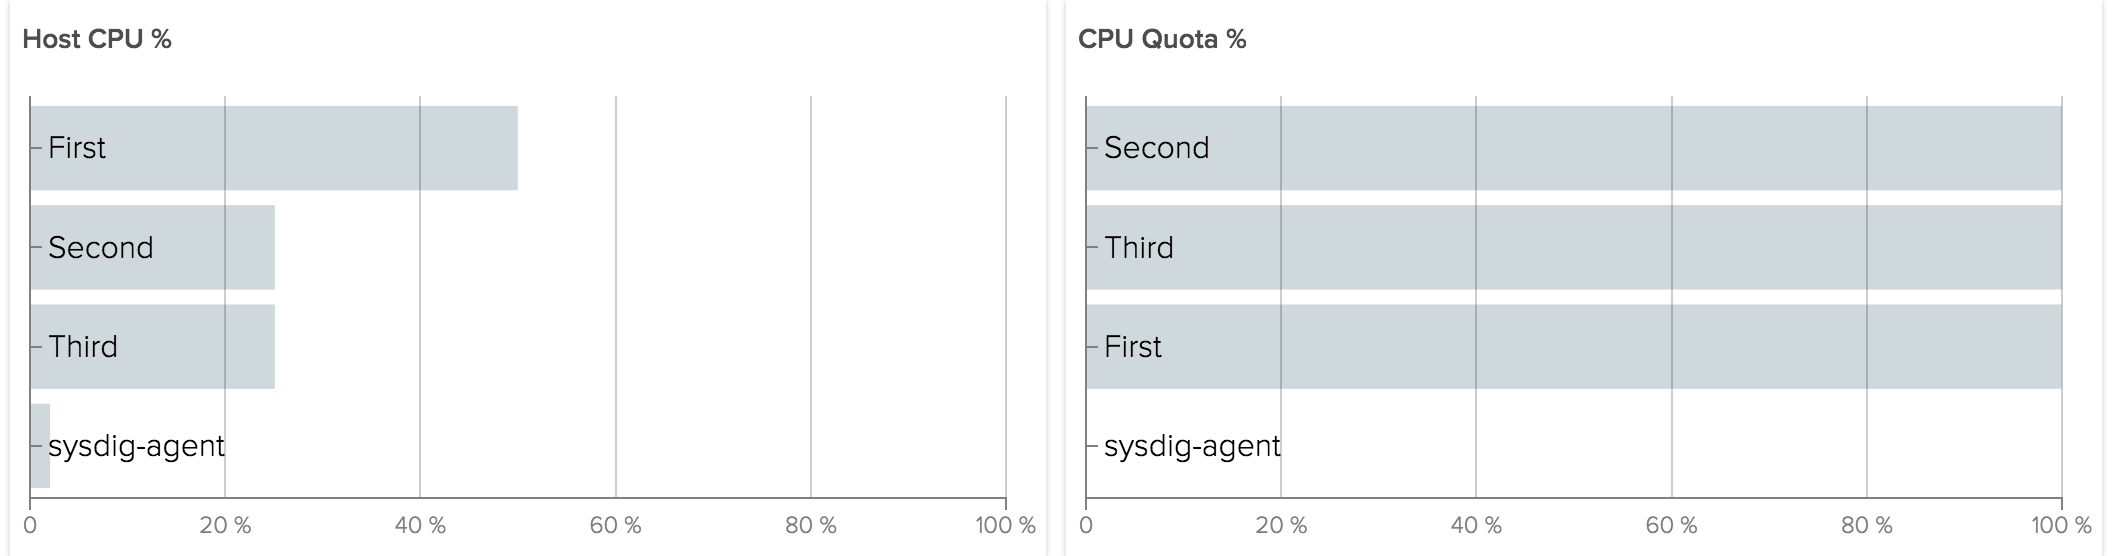
The result is the same as with shares. The difference occurs when Third does not use the CPU allocated to it.
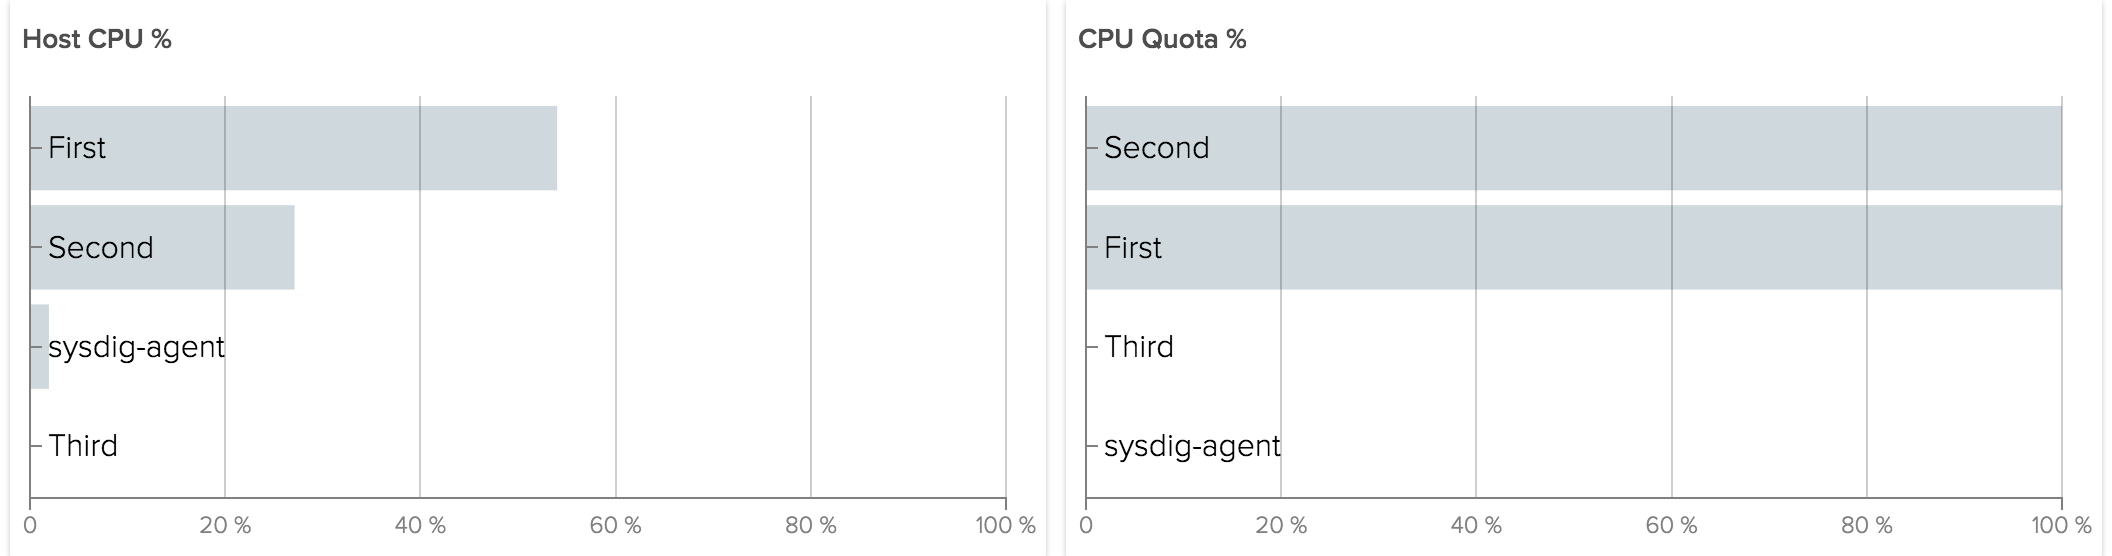
Now instead of giving CPU to other containers, the kernel is enforcing the absolute quota given. The total CPU usage we will see reported for the host will be 75%.
Both these metrics are available in Sysdig Cloud as cpu.shares.used.percent and cpu.quota.used.percent.
Conclusion
Monitoring greedy neighbors is essential to tuning your environment for the best possible performance. With this new feature you will be able to better monitor how resources are used by your apps and act accordingly.
In part 2 of this post, we'll run through some examples of greedy neighbors in an orchestrated environment. Stay tuned – subscribe to our blog and we can update you when the next post is out!
References
http://kubernetes.io/docs/admin/resourcequota/walkthrough/ https://docs.docker.com/engine/reference/run/#runtime-constraints-on-resources https://access.redhat.com/documentation/en-US/Red_Hat_Enterprise_Linux/6/html/Resource_Management_Guide/sec-cpu.html