
Intro
In this post we will cover how to monitor the Java Runtime Environment (JRE). You will learn how to assess the performance of your Java application by profiling its memory usage, the garbage collector metrics, monitoring Java daemon and user threads and other fundamental JRE metrics. We will finish with a real Java JRE troubleshooting example using opensource Sysdig and Docker.
When working on a big Java application, it’s likely that something will eventually fail, misbehave, or maybe you have an OutOfMemoryException that catches you off guard. And if you’re also deploying your Java application as a containerized microservice, monitoring Java in Docker and Kubernetes may present some new and unexpected challenges.
Advanced #Java #JRE monitoring: memory, garbage collector and threads, learn the basic concepts and metrics to watch. Click to tweetMonitoring Java application performance through JRE metrics
The Java Runtime Environment (JRE) that we’ll be discussing today contains a lot of general information about how your application is doing including, CPU usage, number of threads running, number of classes loaded, garbage collector information, memory usage, and other relevant metrics.
Monitoring Java memory usage
One of the most important Java resources to monitor and profile is memory consumption. You need to profile the memory usage over time to avoid leaks and be able to troubleshoot unexpected service degradation.
The memory can be split into two different parts: stack and heap. To monitor Java memory usage, you need to understand the differences between these memory data zones and the specific behavior of each.
Stack
The stack is the part of the memory that contains information about function calls. It’s where local variables get stored and destroyed and operates quickly thanks to its strictly last-in, first-out design.
With memory, it is a simple matter of a move operation and a decrement/increment operation on the stack register. The cost of destroying a variable is free because their memory is just dropped.
We can configure the stack size per thread (each thread has its own stack) with the -Xss<size> parameter:
$ java -Xss18m somejavafile
Code language: JavaScript (javascript)
The stack itself is split into different regions: permanent generation and code cache.
Permanent generation
The permanent generation region of the stack contains metadata required by the JVM to describe classes and methods used in the application. When a class is loaded, the permanent generation is populated with it and its methods. This region is also included in a full garbage collection because when a Classloader dies all its classes must be unloaded.
Code cache
Code cache is a region of the stack where all the native code is stored and compiled by the JIT compiler.
Heap
The heap is the rest of the memory reserved for object allocation.
Normally, when you allocate an object instance in the Heap, that memory must be manually freed when you are not going to use the object anymore. Not doing so can lead to a common problem in languages like C or C++: a memory leak.
A memory leak happens when all the pointers to an allocated object in the heap are lost and the instance can no longer be referred to nor released. This part of the memory cannot be used again until the program is closed. If this happens often in your code, you may reach a moment where no more memory is available for allocation.
In Java, the memory from objects not being referenced by any pointer is released automatically by the garbage collector (GC). However this has its limits as well—references and resources remaining open.
If you allocate memory for an object and keep a reference to it even though you don’t use it anymore, that’s another memory leak scenario you want to avoid.
Also, when you open a resource like a stream and don’t close it, if it goes out of scope it will remain open and continue to consume heap. A good solution to this is to use the “try with resource” blocks that were released with Java 7.
In Java, when you are not able to reserve more memory the JVM throws an exception called java.lang.OutOfMemoryError and terminates the program.
The maximum heap memory allowed per application can be configured when launching the application with the following parameters:
| -Xms | set initial Java heap size |
| -Xmx | set maximum Java heap size |
The heap is also split into several regions including eden space, survivor space, and tenured generation.
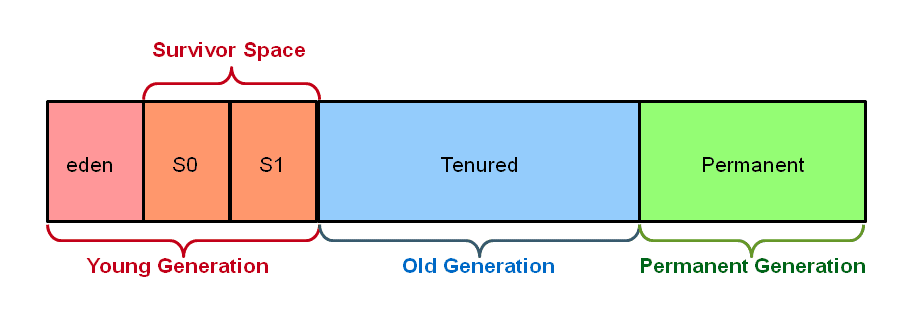
Eden space
This region of the heap is where all new objects are allocated. When an object survives a garbage collection, it’s moved to the survivor space, which is considered part of the Young generation.
Survivor space
When an object survives a garbage collection it’s moved to the survivor space, which is considered part of the young generation.
When the young generation fills up, a minor garbage collection is performed. This collection is optimized with the assumption of a high object mortality rate. It always performs a stop-the-world event, but is a really fast way to clean a young generation that’s full of dead objects.
Tenured generation
Also called the old generation, the tenured generation contains all the long-surviving objects.
When it fills up, a major garbage collection is fired. This is another stop-the-world event but is much more slow because it involves all live objects.
Monitoring the Java garbage collector
The garbage collector is a key component to monitor Java inside Docker and Kubernetes. Correct and predictable GC behaviour will ensure that your pod doesn’t hit the configured limits and get eventually killed and replaced.
Garbage collector
he GC aims to free heap memory that’s not reachable anymore to make it available for enabling new object allocation.
It can be called using System.gc(); but this doesn’t guarantee it’s execution. When the GC is performing, all states from all threads must be saved. If it executes while an object is being allocated, you may break the Java Virtual Machine specification.
The garbage collector consumes computer resources in deciding which memory must be freed, which can lead to overhead and decreased performance.
Most modern garbage collectors try not to make a stop-the-world collection, but this JVM element must be kept in mind—especially if you are creating a real-time application.
There are multiple implementations of garbage collection in Java, which we’ll explore below.
Serial garbage collector
The serial garbage collector is intended to be used in single-thread environments. It is designed for use with simple command-line programs and is not suitable for server environments. A serial GC uses a single thread for collection and performs a stop-the-world event while running.
Parameter: -XX:+UseSerialGC
Parallel garbage collector
Also called a throughput collector, the parallel garbage collector was the default in the JVM from its introduction until Java 9.
Unlike a serial GC, a parallel GC uses multiple threads to run. It also performs a stop-the-world to stop the whole application until the garbage collection is complete.
Parameter: -XX:+UseParallelGC
CMS garbage collector
The concurrent mark sweep (CMS) garbage collector implements a mark-and-sweep algorithm in two steps:
- Mark: perform a tree search to find objects that are being used and marking them as “in use”
- Sweep: those that are not marked as “in use” are considered to be unreachable so their memory is freed and “in use” marks are swept away
With a CMS GC, the whole system must be stopped in order to prevent the tree from being modified and all the memory must be scanned twice.
Parameters: -XX:+UseConcMarkSweepGC and -XX:ParallelCMSThreads=<num>
G1 garbage collector
The garbage-first collector (G1) was introduced in JVM 6 and supported from JVM 7. It was planned to replace the CMS GC and **has been **the default GC since Java 9.
With G1, garbage collection is focused in memory regions with the least amount of live data while global heap collection is performed concurrently to avoid long interruptions.
There are two major differences between the CMS and the G1 GCs:
- G1 is a compacting collector, which simplifies parts of the collector and eliminates fragmentation issues.
- Garbage collection pauses are more predictable and can be configured by the user with G1.
Parameter: -XX:+UseG1GC
Monitoring Java threads
Threads
Creating threads in your application for completing concurrent tasks such as fetching or writing data into a database or a file can improve the performance of your application when you have I/O. However, you can start to run into issues when you have a lot of threads doing concurrent work.
Creating and destroying a thread, as well as saving and restoring the state of the thread, creates significant overhead because of the way finite hardware resources are shared. This produces a general slowdown in the application.
The solution is to limit the number of threads you have running.
Ideally, your computing threads will be separated from I/O threads since those are blocking ones. Try to design your computing threads so they behave as runnable threads most of the time and never block on external events.
There are two types of threads in Java: daemon threads and user threads.
Daemon thread
Daemon threads are service providers to the user threads.
They are created by the JVM. Their life depend on user threads, they are low priority, and they’re used to perform garbage collection and other housekeeping tasks. The JVM will not wait for daemon threads to finish their execution.
User thread
User threads are created by the user or the application. hey are high priority and the JVM will wait until they have finished their tasks.
Monitoring Java with Sysdig opensource: Profiling JRE threads
Imagine you have a container running a Java application and you need to know what threads are running but you don’t have any JMX being exported by the JRE and the container is isolated. With Sysdig, you can monitor what’s going on within the container even with zero previous configuration.
If you don’t have any Java containers running at the moment, you can use the following example:
docker run -d tembleking/java-thread-names
Code language: JavaScript (javascript)
Once this container is running in the background, you can launch a terminal inside a new Sysdig container:
docker run -i -t --name sysdig --privileged -v /var/run/docker.sock:/host/var/run/docker.sock -v /dev:/host/dev -v /proc:/host/proc:ro -v /boot:/host/boot:ro -v /lib/modules:/host/lib/modules:ro -v /usr:/host/usr:ro sysdig/sysdig
Code language: JavaScript (javascript)
Once you get the terminal, you can use the Sysdig cli:
sysdig -c topprocs_cpu container.image = tembleking/java-thread-names
Code language: JavaScript (javascript)
All the running threads with their names will now be displayed on the screen (click to play):
Conclusion
The Java Runtime Environment is the most fundamental source of information for monitoring Java understanding the basic memory data structures and thread behavior is key to track-down non trivial exceptions.
Sysdig technology, both in its open source and commercial versions can easily monitor the JRE. It doesn’t take any instrumentation on the Java application side—just an inspection of the kernel metadata and events. While this is already quite interesting for collecting a static set of metrics, autodiscovery of dynamically appearing JRE and JMX metrics is even more interesting (as in less work and human errors). Learn more about what system-level observability can do for you and find some cool troubleshooting examples here.
In the next chapter of our Ultimate guide to monitoring Java inside Docker and Kubernetes, we will shift from the foundational details of the Java Virtual Machine to the application layer, making use of Java Management Extensions and Managed Beans.