Falco Feeds extends the power of Falco by giving open source-focused companies access to expert-written rules that are continuously updated as new threats are discovered.

Pager fatigue is real. And there's nothing worse than getting woken up in the middle of the night for a useless alert. Sure, memory usage may spike, but you might only want to be jolted awake if database transactions per second drops below a certain threshold AND average request latency increases to an unacceptable amount. We've added multi-condition alerts to Sysdig Cloud to keep users sleeping peacefully through the night.
\r\r
Setting Up a Multi-Condition Alert
\r\r
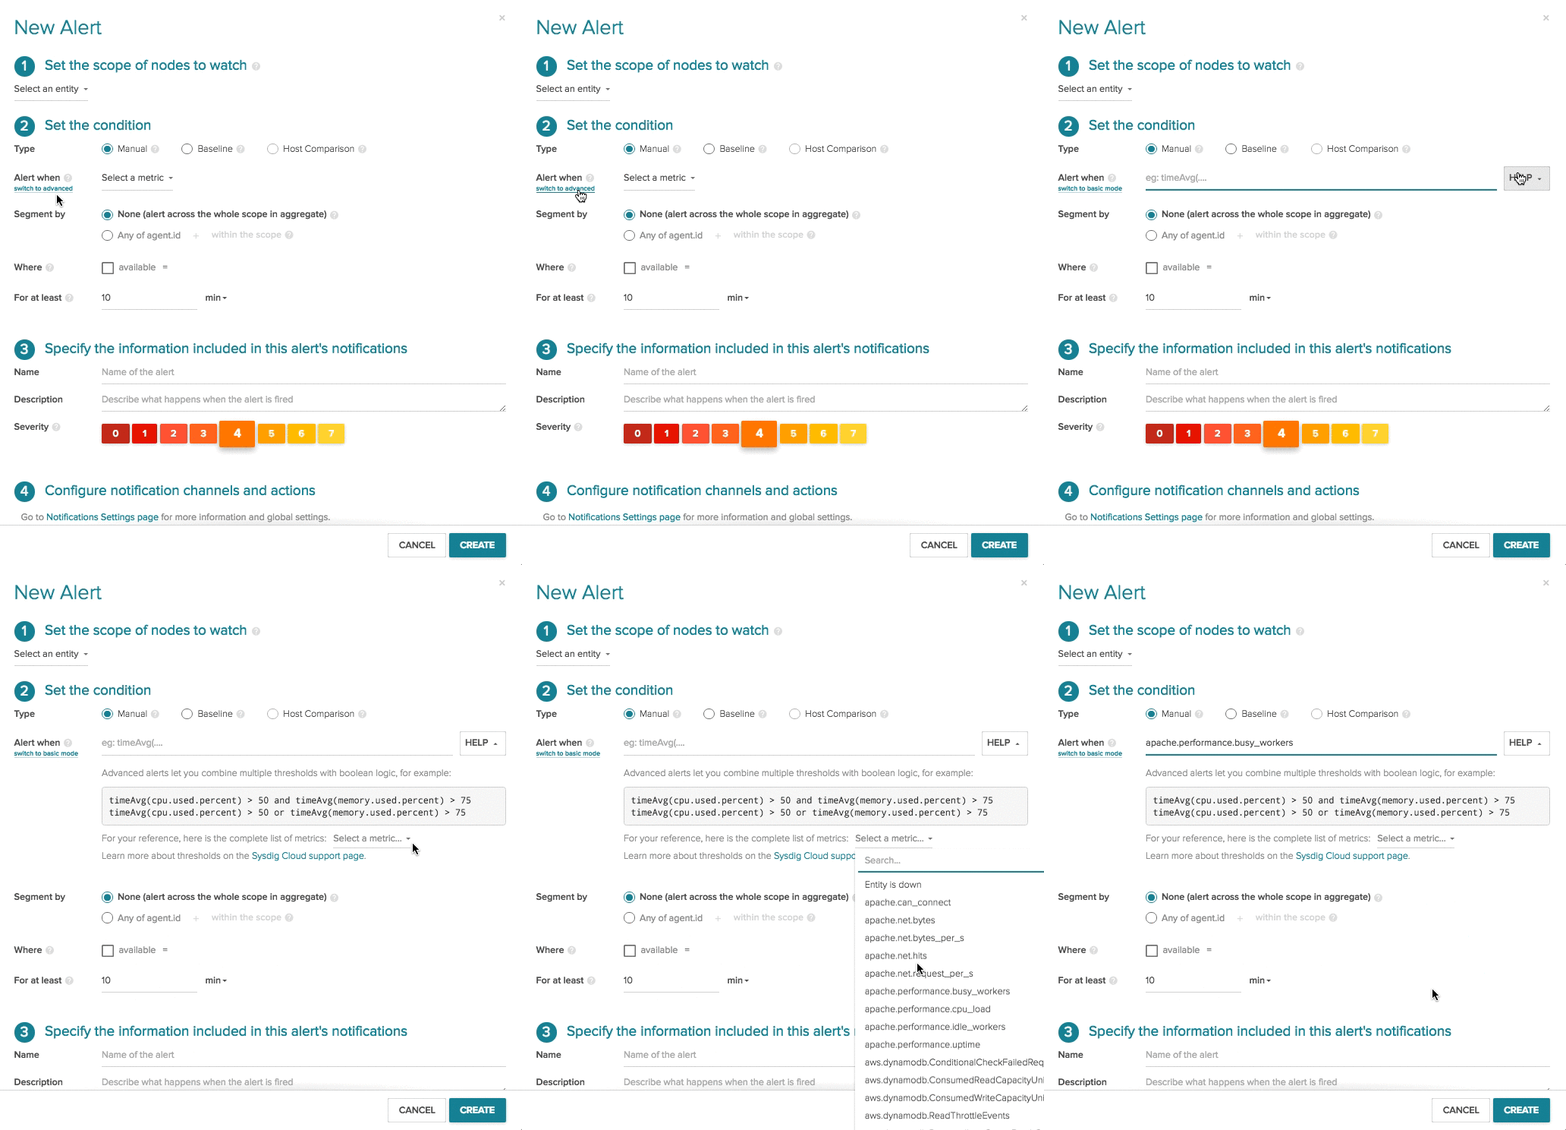
Creating a multi-condition alert is simple and very similar to creating a general alert. To being click on the alert icon in any panel, view, dashboard, or navigate to the alerts tab itself. Once on the alerts menu switch to advanced mode and click on help to get examples and a full list of all metrics.
\r\r

\r\r
Advanced Alerting
\r
For advanced alerts we built a powerful alerting syntax that has all the aggregate function and relational operators you'd expect. Each condition in an alert has five parts:
\r\r
- \r
- Metric \r
- Group aggregation (optional) tell Sysdig Cloud how to aggregate individual data points across a group of nodes. For more details, see the support page on this topic. \r
- Time aggregation – tell Sysdig Cloud how to aggregate individual data points across a stretch of time \r
- Operator \r
- Value So a condition looks like: \r
\r\rgroupAggregation(timeAggregation(metric.name)) operator value\r\r
Here are some examples of advanced alerts:
\r\rtimeAvg(container.count) != 10 \r\r
In this example we know for our test environment we should have exactly 10 containers running at any point in time, so we set the alert to fire if the average container count does not equal 10 during the timespan. Timespan is defined within the UI as the last field within step 2.
\r\rmin(min(cpu.used.percent)) < = 30 OR max(max(cpu.used.percent)) >= 60\r\r
This example shows an alert that functions across a group of nodes. The alert triggers if minimum CPU utilization for any node in the group should not be below 30% or the maximum CPU for any individual node exceeds 60%.
\r\rtimeAvg(cpu.used.percent) > 50 AND (timeAvg(mysql.net.connections) > 20
\r
OR timeAvg(memory.used.percent) > 75)\r\r
In this alert we wanted to capture the health of our mysql database across multiple conditions. So if CPU usage is rising and the subsequent network connections are going up or if memory usage is unacceptable we want to get an alert.
\r\r
Like all Sysdig Cloud alerts, a Sysdig Capture can be initiated when the alert fires. Enabling users with a path to deep system call level details about everything happening on each host when the alert fired.
\r\r
Multi-condition alerts are just another way Sysdig Cloud makes your life easier. Applying multiple conditions to an alert allows you to fine-tune alert specificity, and then also allows you to get more detailed in playbooks for alert remediation.


