


Falco Feeds extends the power of Falco by giving open source-focused companies access to expert-written rules that are continuously updated as new threats are discovered.

We had a chance to catch up with Kenan Sulayman, who runs some of the biggest Tor servers in the world. Read on to learn about server monitoring for high-throughput environments, network visibility, and optimizing application code versus the network.
Monitoring Tor exit nodes
Tor is short for The Onion Router (thus the logo) and was initially a worldwide network of servers developed with the U.S. Navy that enabled people to browse the internet anonymously. Now, it's a non-profit organization whose main purpose is the research and development of online privacy tools.The Tor network disguises your identity by moving your traffic across different Tor servers, and encrypting that traffic so it isn't traced back to you. Anyone who tries would see traffic coming from random nodes on the Tor network, rather than your computer.
Server Environment & Sysdig discovery
"Our environment is quite different than most cloud environments out there," notes Kenan. "We're co-located in data centers across Europe: primarily the Netherlands, with failovers in Romania and France – always colocated with major internet peering points where 10 gigabit uplinks are available. Traffic to our servers regularly hits 150 MB/s and more, which means we're pushing multiple hundreds of terabytes per month.""We run the Tor application on multiple servers and use a distributed file system to continuously backup, mitigating unexpected downtimes. We also offer an DNS service. Tor servers basically get ranked on reputation, and reputation is based on how effectively we respond to requests and how stable we are in terms of uptime, concurrent connections and overall network capacity."But at the scale we operate, even the smallest percentage points in changes to system performance can have a huge overall impact to service performance. I needed a system that would help me monitor this performance at the server level, but also give me insight into the performance of other applications that might impact overall system performance."I originally ran across Sysdig's open source project and was attracted by the kernel module. I wanted a way to see every command executed on my host, detecting any kind of anomalous activity, and sysdig did a great job of giving me that visibility.""When I saw that the commercial product gave me the ability to capture, visualize, and alert on that same information across multiple hosts, I was really excited to give it a shot."
Monitoring Large-Scale networks
Kenan described his use of Sysdig's monitoring platform: "Sysdig in general has done a great job instrumenting everything. Not only can I monitor my servers' health, but also my applications, containers and the network performance. We recently got a huge spike of traffic, over 250MB/s on each server, a total of over 800MB/s across all servers. Because we handled it well, we increased our server reputation in the Tor network and then we got even more traffic. Sysdig comfortably handled the load.""Sysdig makes it easy to create dashboards focused on any part of my system. For example, this one shows a network-based view for monitoring one particular Tor server:
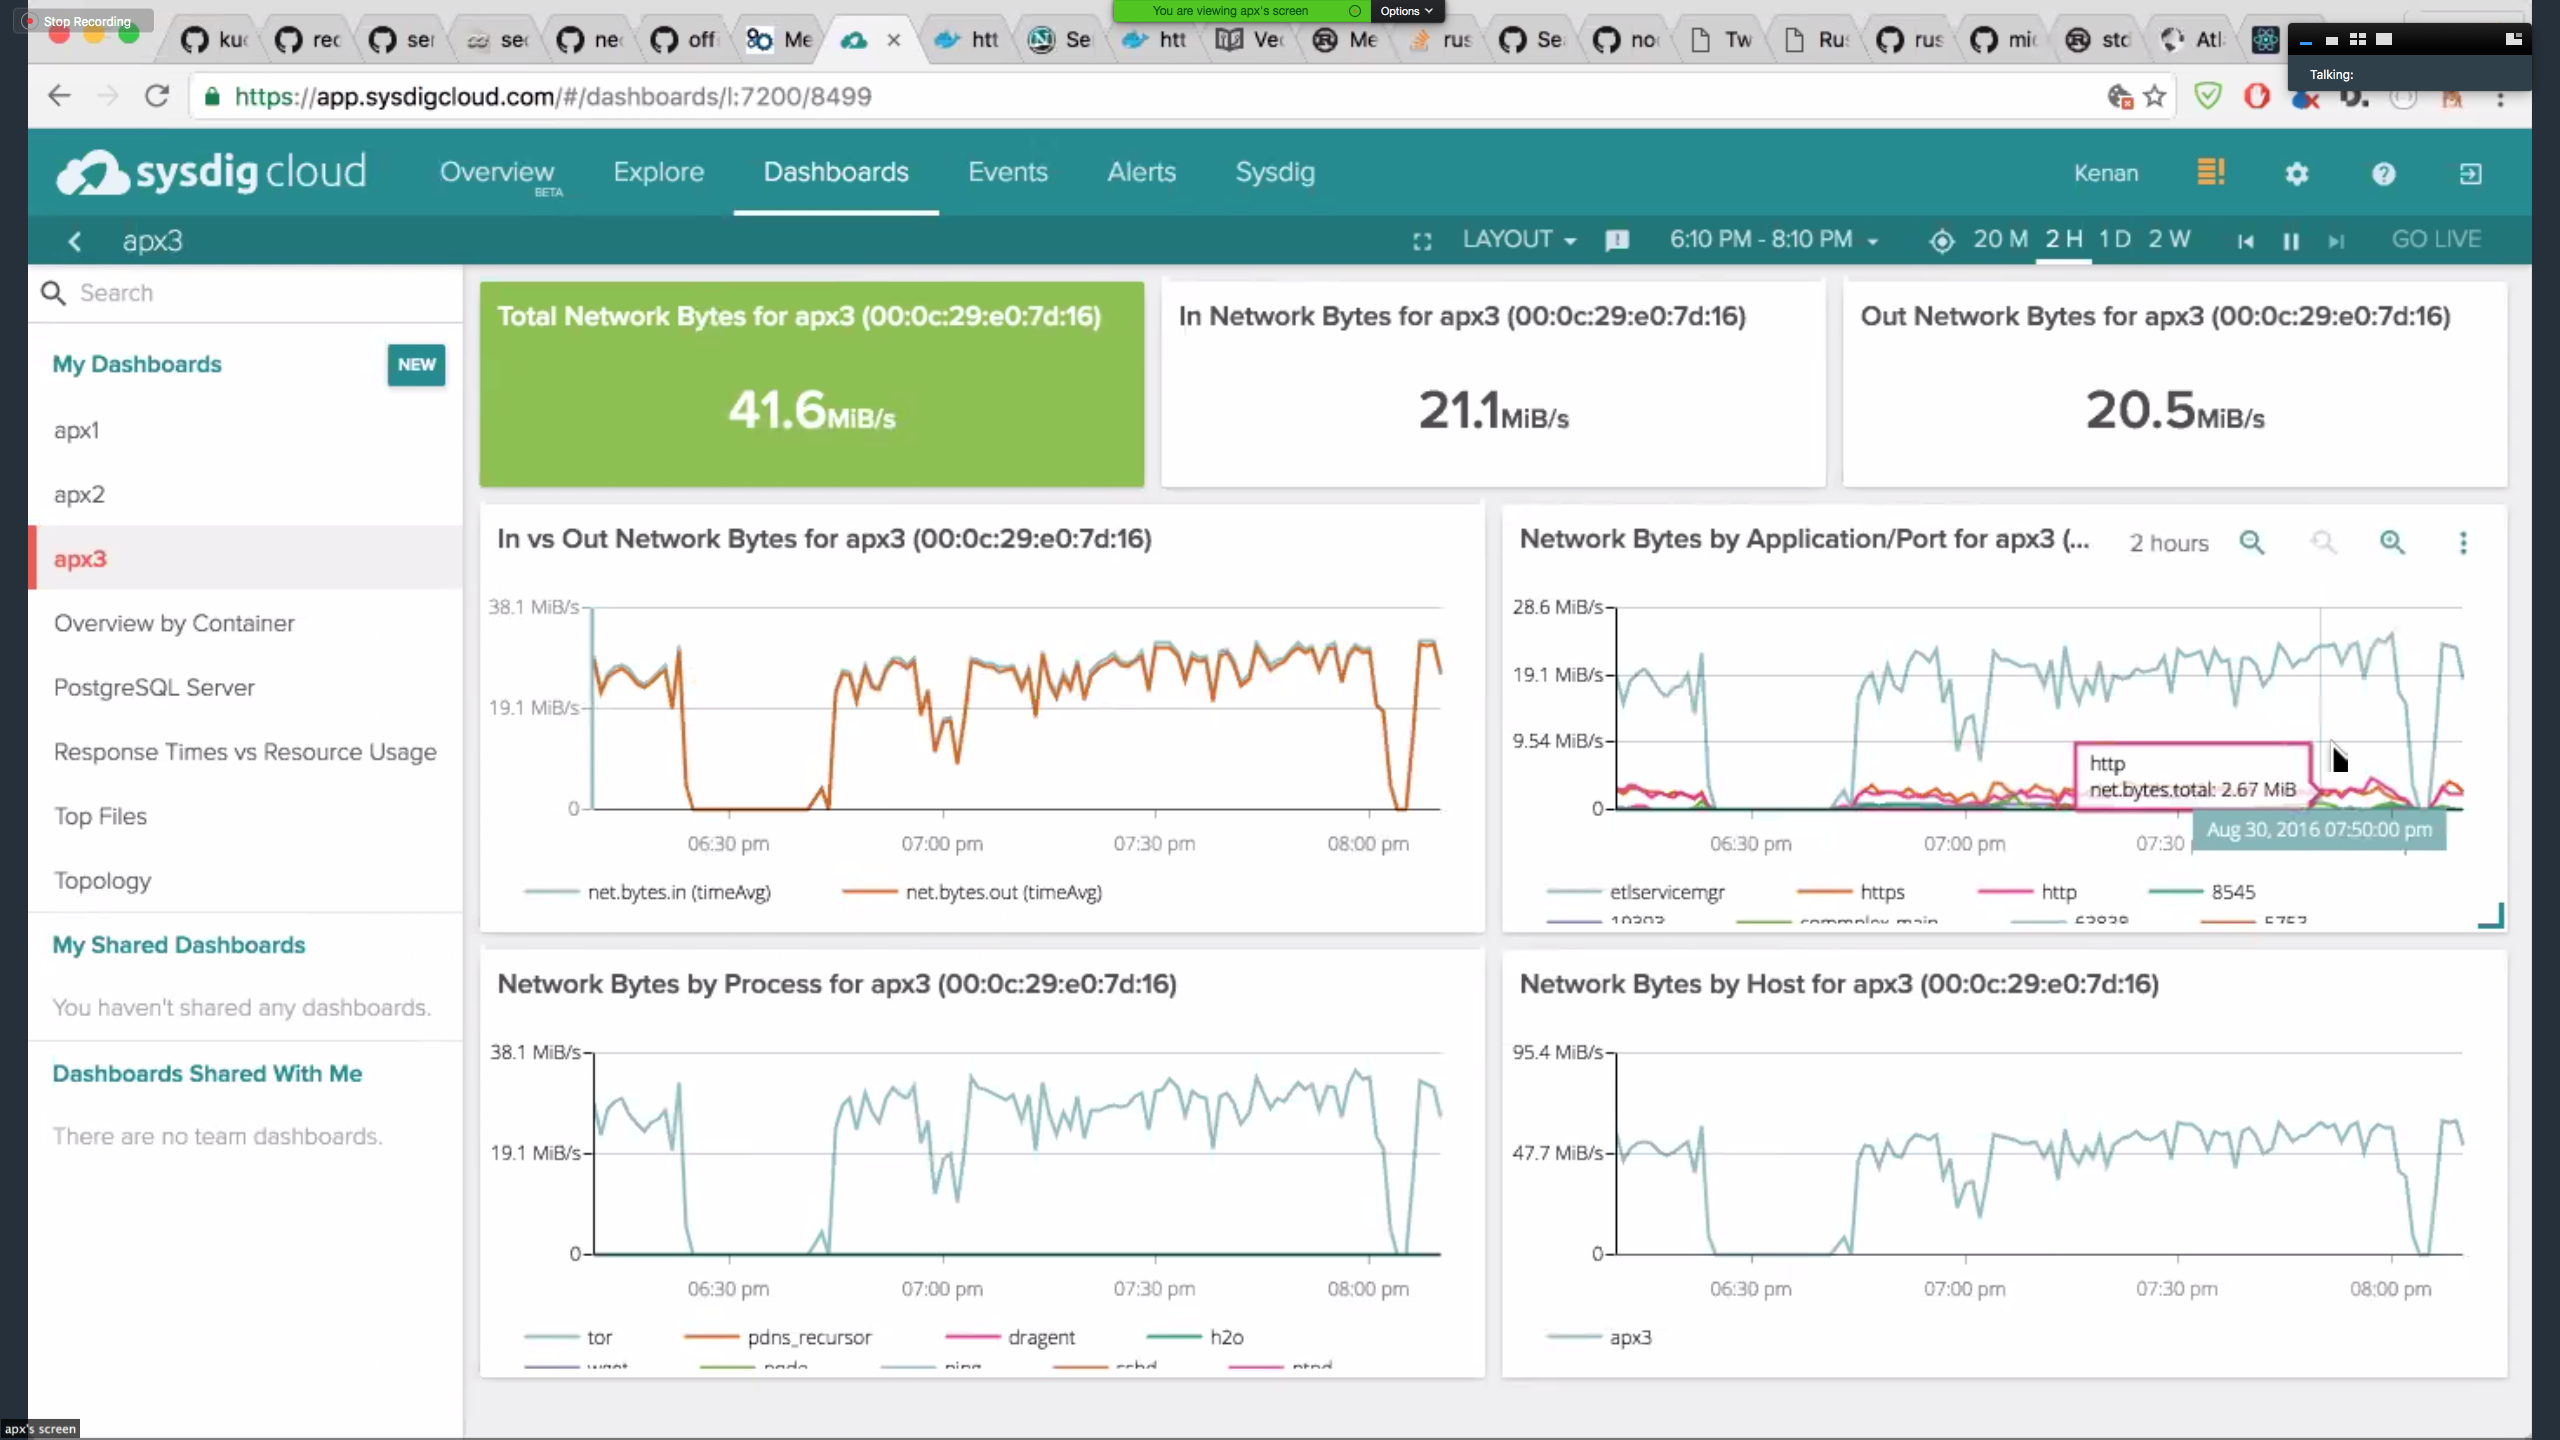
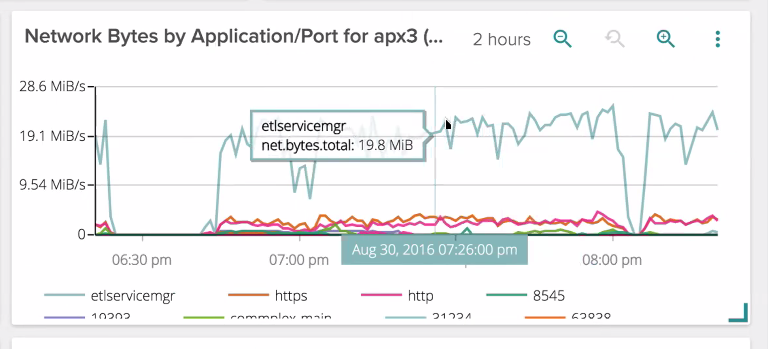
Kenan continued, "It's also powerful to be able monitor server traffic segmented by port. This helps distinguishing between traffic that is forwarded to other Tor nodes and traffic that goes to the clear internet. Being a directory server, my servers can help other servers find out about the network. For example, below I can see traffic coming in from other Tor servers (etlservicemgr, port 9001)."
Improving application processing
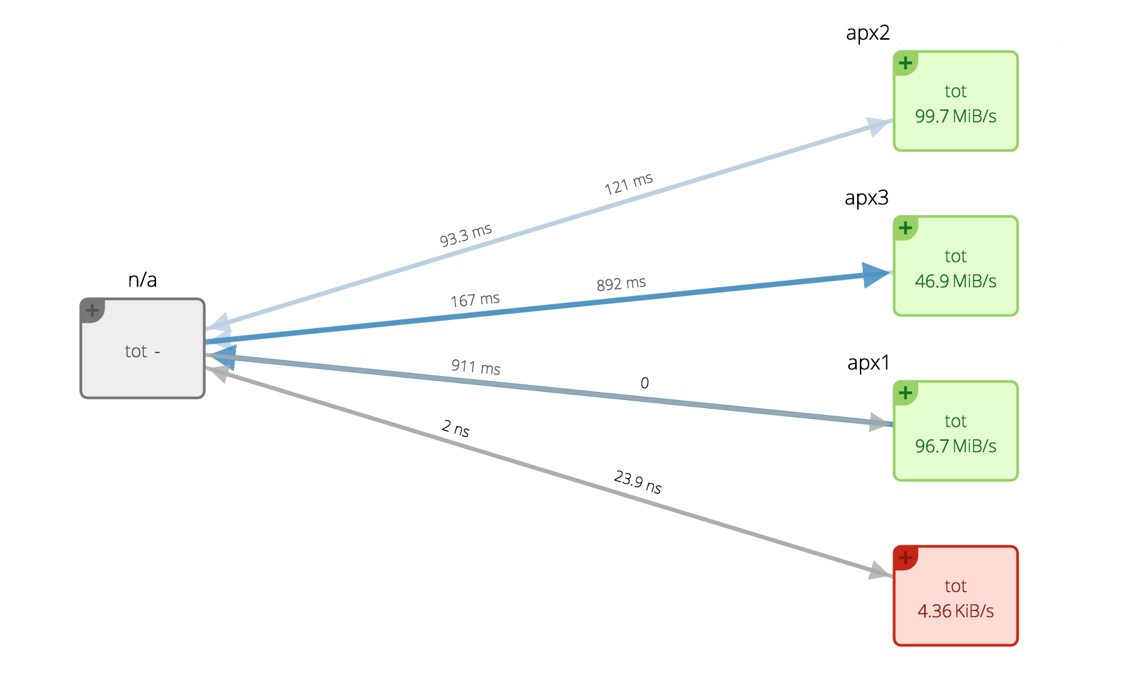
"I have one server on which I'm running a database. With Sysdig, I can monitor the database and the Tor nodes separately. This gives me a clear view on my server and allows me to improve overall performance step-by-step. When I was using New Relic it just told me about the latencies to my servers – with Sysdig I can even see how long it took for my servers to process each request. Sysdig makes debugging incredibly easy – I don't need to spend as much time on the server or digging into logs. It's much less often that I have to ssh to the servers themselves."
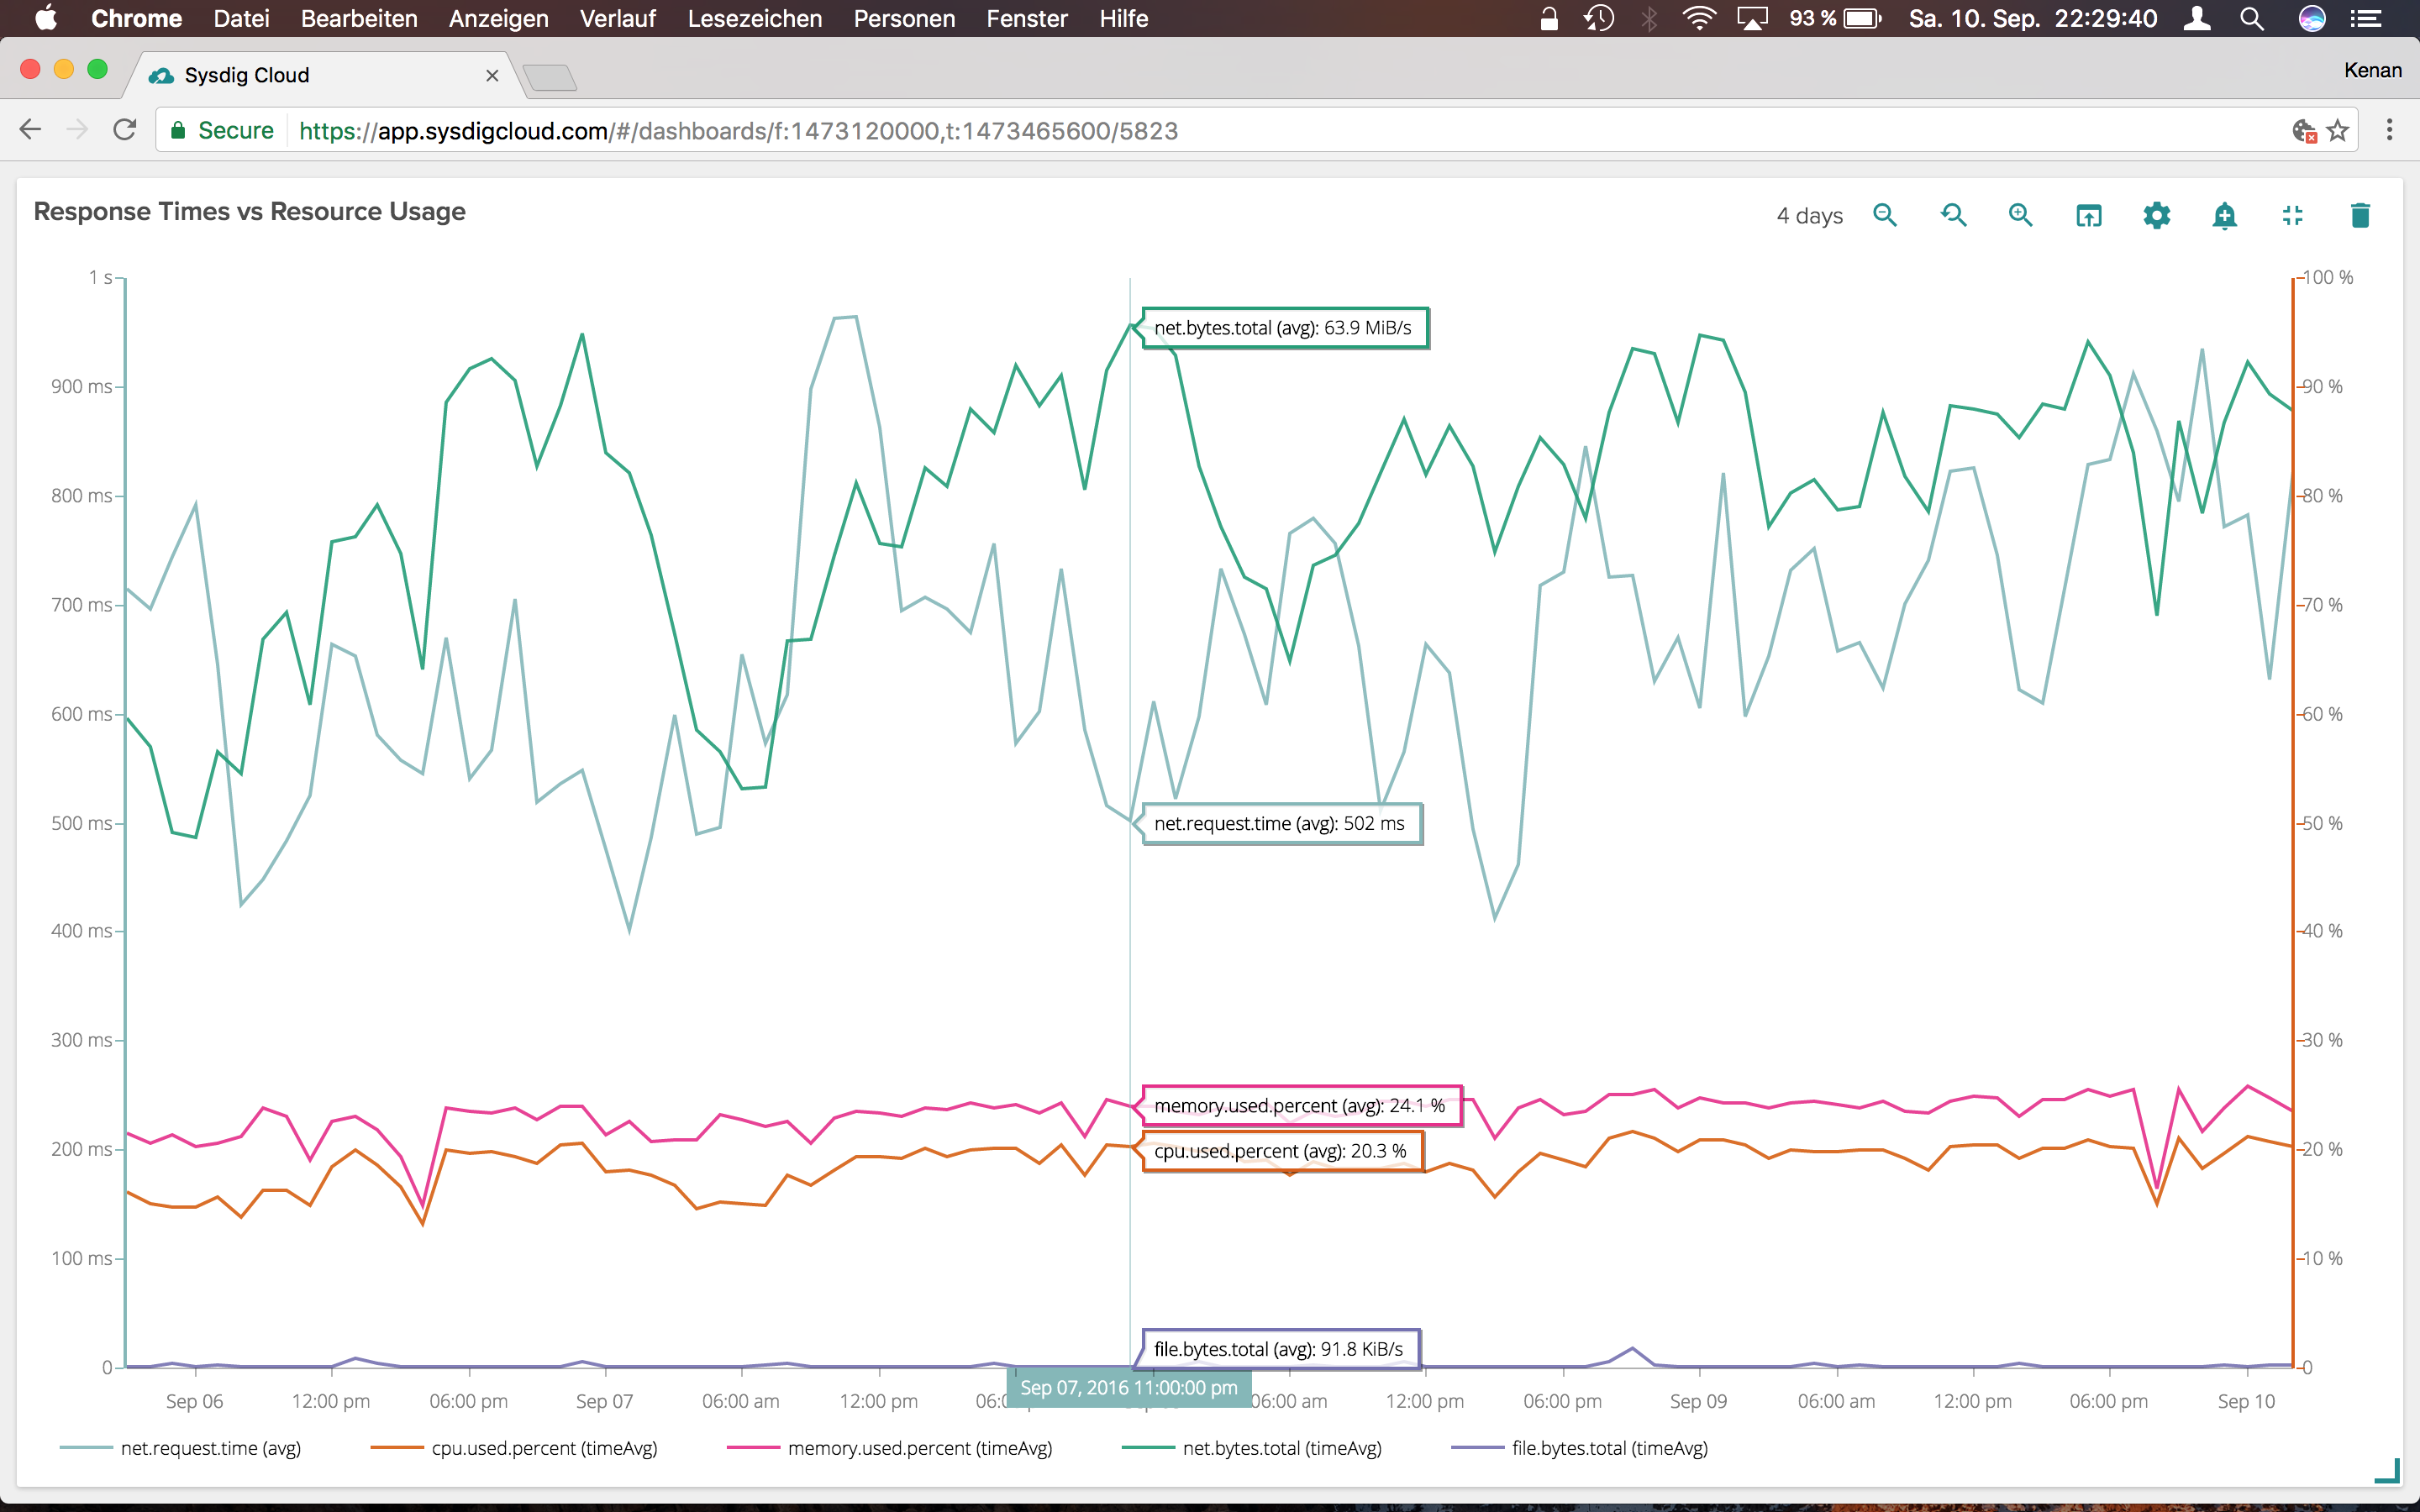
Response time vs resource usage
I wanted to be able to relate underlying resource usage with user's performance. There are a lot of complicated things for what we're doing, which can result in processing time ranging from 50ms to multiple seconds. There are usually between 800 and 3000 concurrent connections. And on top of it, the time or traffic per connection can vary greatly. When the request time goes through the roof (open connections) throughput goes down. I also can see that downloading is memory heavy, while managing a higher number of network connections is CPU related.
Monitoring exception handling
Kenan noted that he also runs self-hosted Sentry, but runs them in Docker containers. "Sysdig is known for Docker monitoring, so this was a natural fit. Sysdig can monitor that – shows me CPU utilization per container, and even gets down to the use of file descriptors. This is important to me because it can have impact on the overall throughput. If Sentry is using too many resources, I can suspend it as I see fit."
Securing systems with Sysdig Falco
"I also need to monitor closely to see if anyone is tampering with my system," notes Kenan. "For example, in case of a breach – when unexpected commands are executed or devices inserted into the physical server, I need to be able see that activity. For that, I use Sysdig's open source activity monitor, Falco, in addition to Sysdig monitoring. It allows me to set rules and get alerts when I see activities that indicate someone is tampering with my system. Unauthorized access or anomalous file reads and writes are immediately flagged for me. I'm looking forward to seeing Falco integrated into Sysdig's main offering for more robust alerting, and correlating security events with external connections.
Conclusion: Debug less, Fewer monitoring tools to manage, and Improve more
Kenan reflected on the use of Sysdig, and the value it brings to him. "The time that I save with Sysdig through debugging is huge – it means I can spent more time maintaining on a high level and write code for side projects. It's so much more cost effective than running a bunch of different manual system monitoring and APM tools. It was so easy to dump the other tools and just use Sysdig."