Falco Feeds extends the power of Falco by giving open source-focused companies access to expert-written rules that are continuously updated as new threats are discovered.

Cloud security operates on a different paradigm compared to traditional IT security. For example, it involves multiple contextual layers such as cloud services, containers and Kubernetes that require specialized insights. The challenge is even harder when the organization is affected by compliance requirements, and is compounded by the sheer volume of data that becomes a major concern for any organization. Failing to effectively manage it leads to costly inefficiencies and risks.
Sysdig's Cloud native application protection platform (CNAPP) was created with the objective of streamlining how companies secure their cloud infrastructure and applications, enabling them to gain control over rapidly changing environments.
However, it is common for Security Operations Center (SOC) teams to often juggle multiple security platforms and sources, generating complex data streams that need to be managed, correlated, and stored. Cribl and Sysdig are the perfect combination to bring complete cloud visibility while optimally managing storage costs and the agility to embrace any changes that the businesses may require.
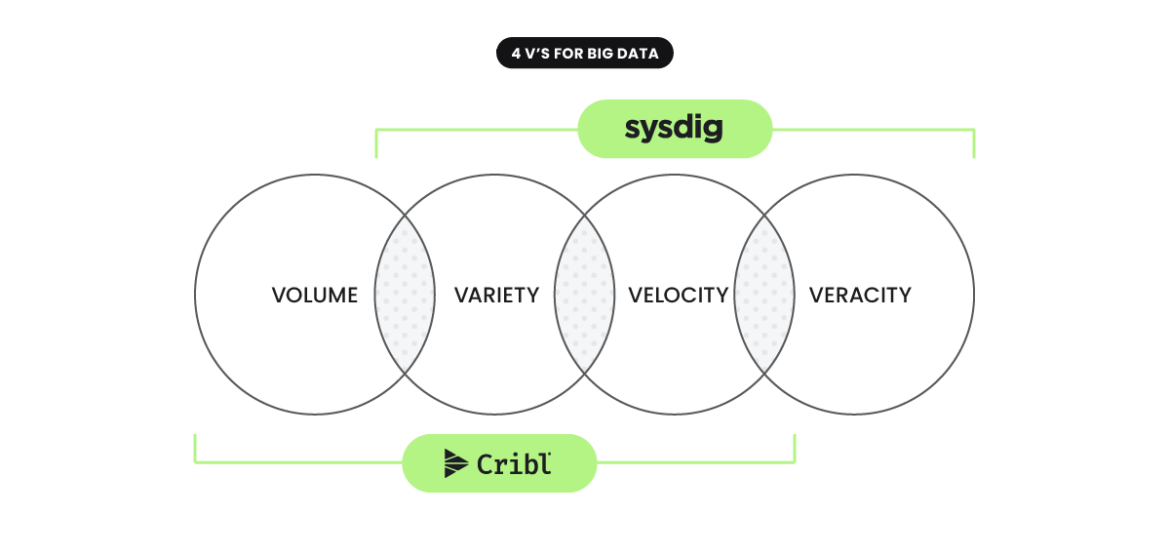
Value of cloud security signals for SIEM, SOAR and Data Lakes
CNAPPs emerged as the "eyes of the security system" within cloud environments that once were full of blind spots. Furthermore, cloud security solutions feed rich, contextual signals into other platforms, security solutions like SIEMs, SOARs, or storage solutions like Data Lakes.
With Sysdig's cloud security engine, relevant events can be filtered and highlighted, contributing to SOC efficiency. Now you can shift focus away from common logs to detect actual relevant incidents, evaluate the severity or inspect its cloud context to make decisions.
Directing CNAPP data into SIEM, Data Lakes – or both – opens up endless possibilities for security analytics, threat hunting, and machine learning-driven anomaly detection. With CNAPP, security analysts can reduce alert fatigue and focus on what matters most – protecting cloud applications.
What is Cribl?
Cribl is a powerful SaaS platform that changed how the data is managed. It enables organizations to filter, tweak, and route data dynamically with precision. The architecture is flexible and supports multiple data sources and destinations. For example, it can sift through the data and reduce it before forwarding to a SIEM or data lake, generating important cost reduction compared to traditional SIEM connections.
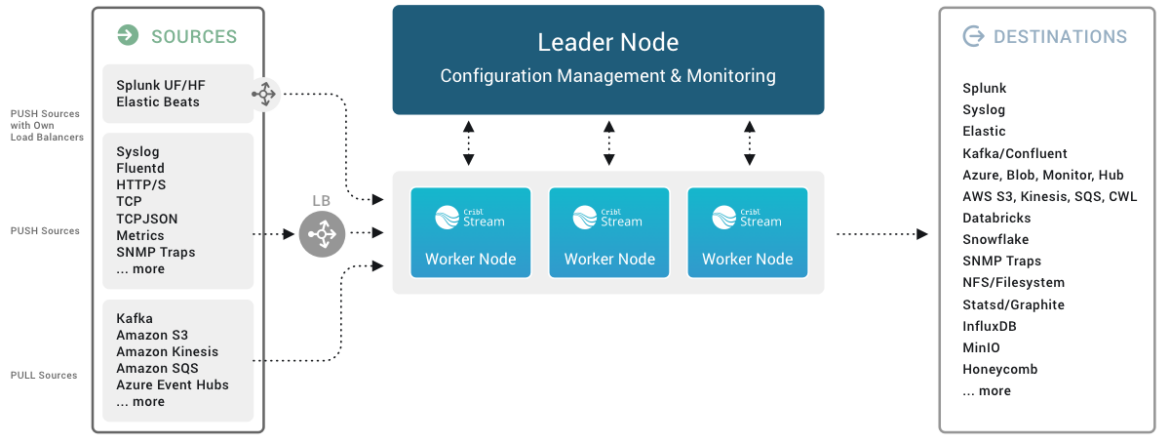
In essence, Cribl empowers organizations to not only manage their data more effectively but also to unlock its full potential, driving smarter decisions and faster responses in rapidly changing environments.
Some of the top Cribl use cases are:
- Optimization of storage costs by applying reduction, sampling or aggregation techniques.
- Selectively route data to more cost-effective storage systems or multiple destinations.
- Feed data lake, external or the Cribl Datalake itself.
- Search and Analyze Data at Source.
- Enrich with context, or change the shape, size or quality of data.
- Replay data from low cost storage.
Why combine Sysdig and Cribl?
Security teams and ITOps are teams that are inherently synergistic in nature. Our customers often leverage this synergy to achieve key outcomes.
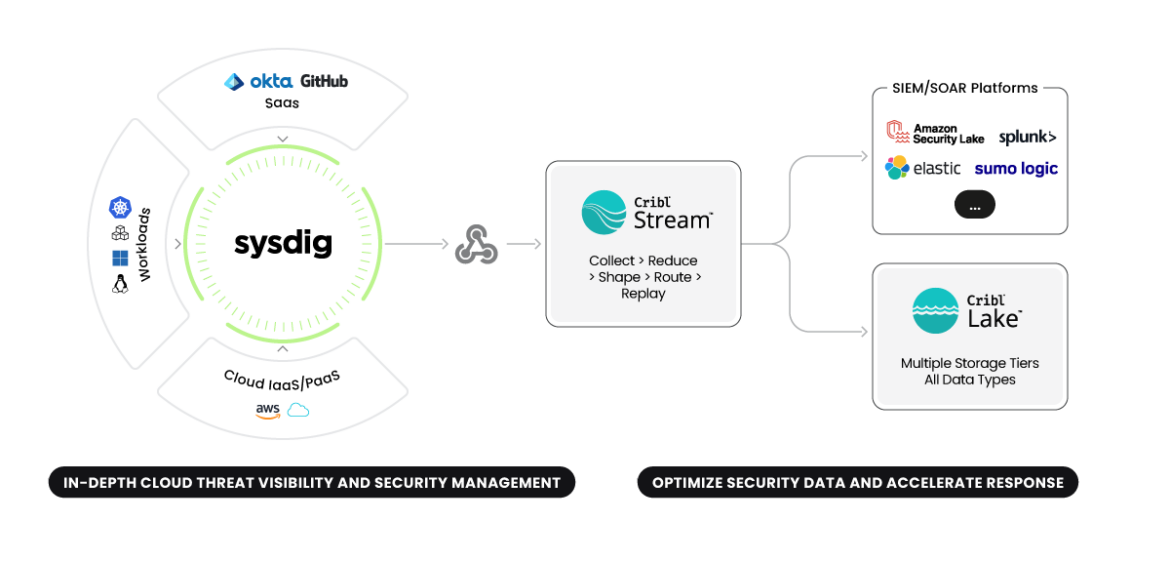
Intelligent data reduction: Sysdig's routinely updated threat intelligence rules discern what events are relevant under the context and the granularity that cloud security requires. This reduces considerably the amount of data that has to be stored vs raw logs. Cribl adds on top of this process an additional security data optimization gate, allowing customers to shape this data to their particular needs.
Dynamic storage optimization: The new paradigm is to split data dynamically in the event it requires different access profiles instead of storing a ton of data together.
Flexible Configurations: If yesterday our SOC team aimed to set up an enterprise SIEM connected to multiple sources like a WAF and SASE, today they might be considering a distributed SIEM combined with a Data Lake. Or perhaps they're exploring the possibility of onboarding a new cloud provider or moving specific workloads back on-prem for compliance reasons. The key here is flexibility—and Cribl excels at providing that.
Hands on testing of the Sysdig-Cribl integration
In order to emulate a real world multi-cloud environment, we set up a sandbox with several cloud accounts from different providers, some computing instances, Kubernetes clusters, and deployed a few automations to generate varied events periodically. We plugged Sysdig to ingest cloud audit logs, and instrumented instances and Kubernetes clusters to get CWPP signals.
Access Sysdig's official documentation for step-by-step guidance on integrating with Cribl
Prerequisites
- A Sysdig account populated with some data. We enabled all the policies to deliberately generate as many events as possible. This is the opposite of what our customers should do, but is great for testing purposes.
- A Cribl Stream account.
Use case A: Enhance efficiency of Sysdig data for Splunk/SIEM
We chose Splunk for this blog post demonstration but you can connect it to any destination such as Chronicle, Sentinel, or Sumo, just to mention some.
Setting up this integration is pretty straightforward just by following the intuitive Cribl User Interface and its embedded tips. We are going to use Sysdig Event Forwarder to send Falco findings to Cribl.
While we outline a quick manual approach in this post, Cribl customers can also leverage Cribl packs for Sysdig to configure it faster.
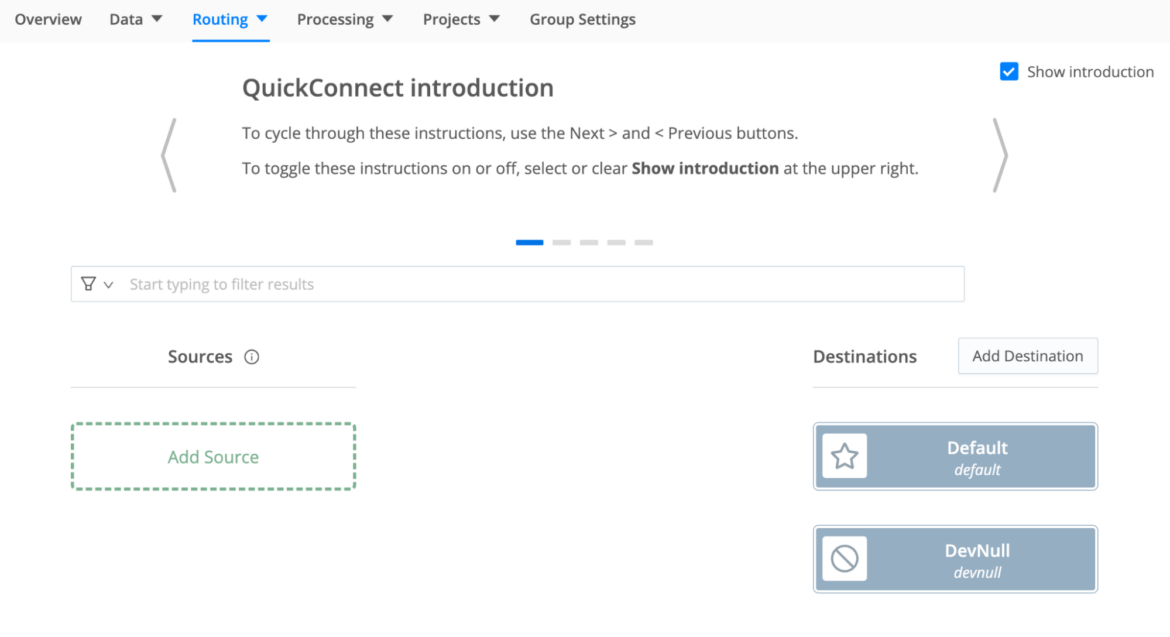
Step One>> Configure the worker, a source, and a destination in Cribl Stream
- From the Cribl UI: Browse to Worker Groups and choose Default. Go to the Routing tab and select QuickConnect
- Click the Add Source button, and choose http, set the desired port and save it.
- Once created you can configure throughput settings. We left it OOTB for this example. Please copy the agent HTTP url.
- Create a new Destination (For example Splunk Single Instance), configure it accordingly, test it and save.
- Click the (+) icon and drag to connect this source to the previously created Splunk destination. Choose the pipeline option when the pipeline form is presented. From that prompt Add Pipeline > Create New Pipeline. Type in "Sysdig" as the pipeline name and save it.
- At this point you should have a source connected to a destination, with a pipeline in the
middle.
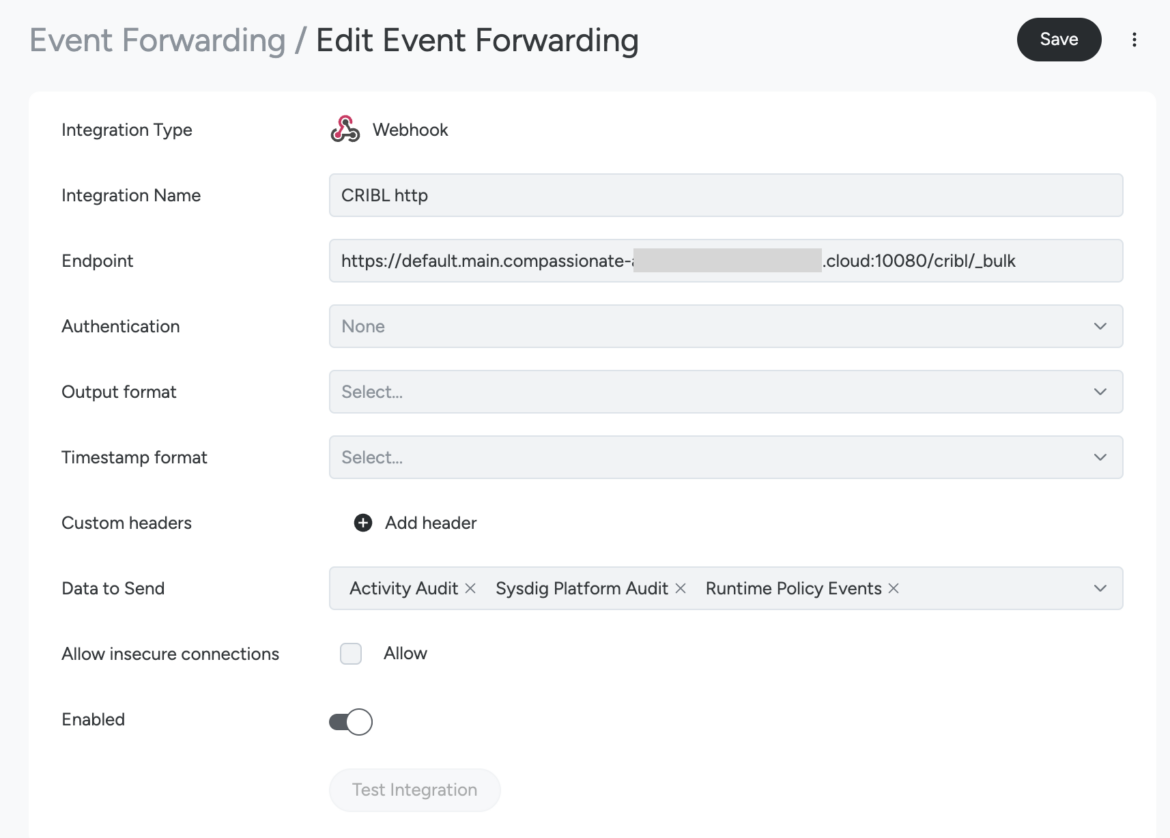
Step Two>> Create a new Sysdig Event Forwarder
- From the Sysdig Console: Go to the Integrations option from your Sysdig console menu and from there to Event Forwarding.
- Click the Add Integration button, choose Webhook from the dropdown menu.
- Configure the Event Forwarding Webhook form. Adding an authentication method is strongly recommended. Fill the Endpoint field by pasting the worker url provided by Cribl Stream when we configured the http source.
- Select the Data to Send (Runtime Policy Events if you want to share Sysdig Falco findings and threats from any source like AWS, GCP, Azure, or Kubernetes, Linux and Windows Instances, etc.).
- Click the Test Integration button to check that Sysdig can forward data to your Cribl worker with success.
- Save the new Event Forwarder. From now onwards, Sysdig will forward all the selected events to Cribl.
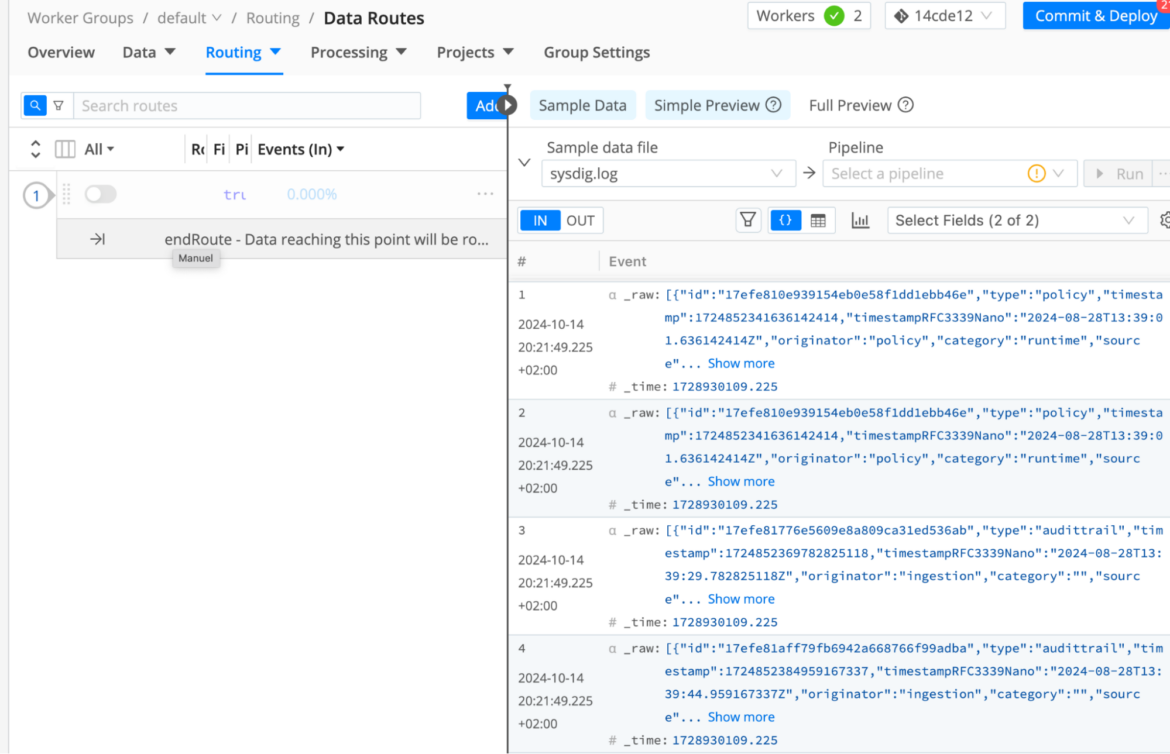
Step Three>> Monitor the data traveling from Sysdig to Cribl
- At this point, Sysdig is forwarding all the runtime findings to our Cribl default worker. Let's see it in action.
- Browse to Worker Groups > Routing > Data Routes and go to the right tab called Sample Data. There we can click to retrieve a "Simple" Preview and check Sysdig entries.
- An alternative way to check the integration in action is going to Monitoring > Overview to review the streaming charts in real time
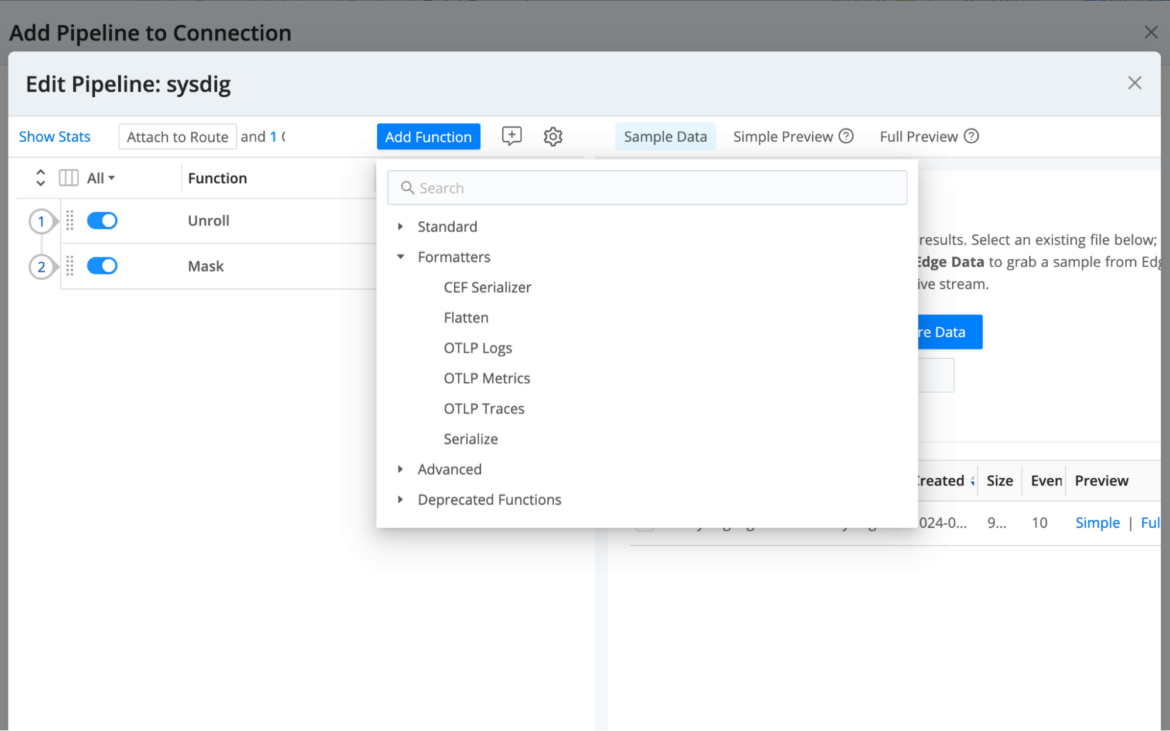
Step Four>> Configure a Cribl Pipeline for optimization or dynamic routing
We might want to use Cribl to route Sysdig data "as is". However, as mentioned before, Cribl enables data transformation with techniques like suppression, sampling, replacing or parsing, among others.
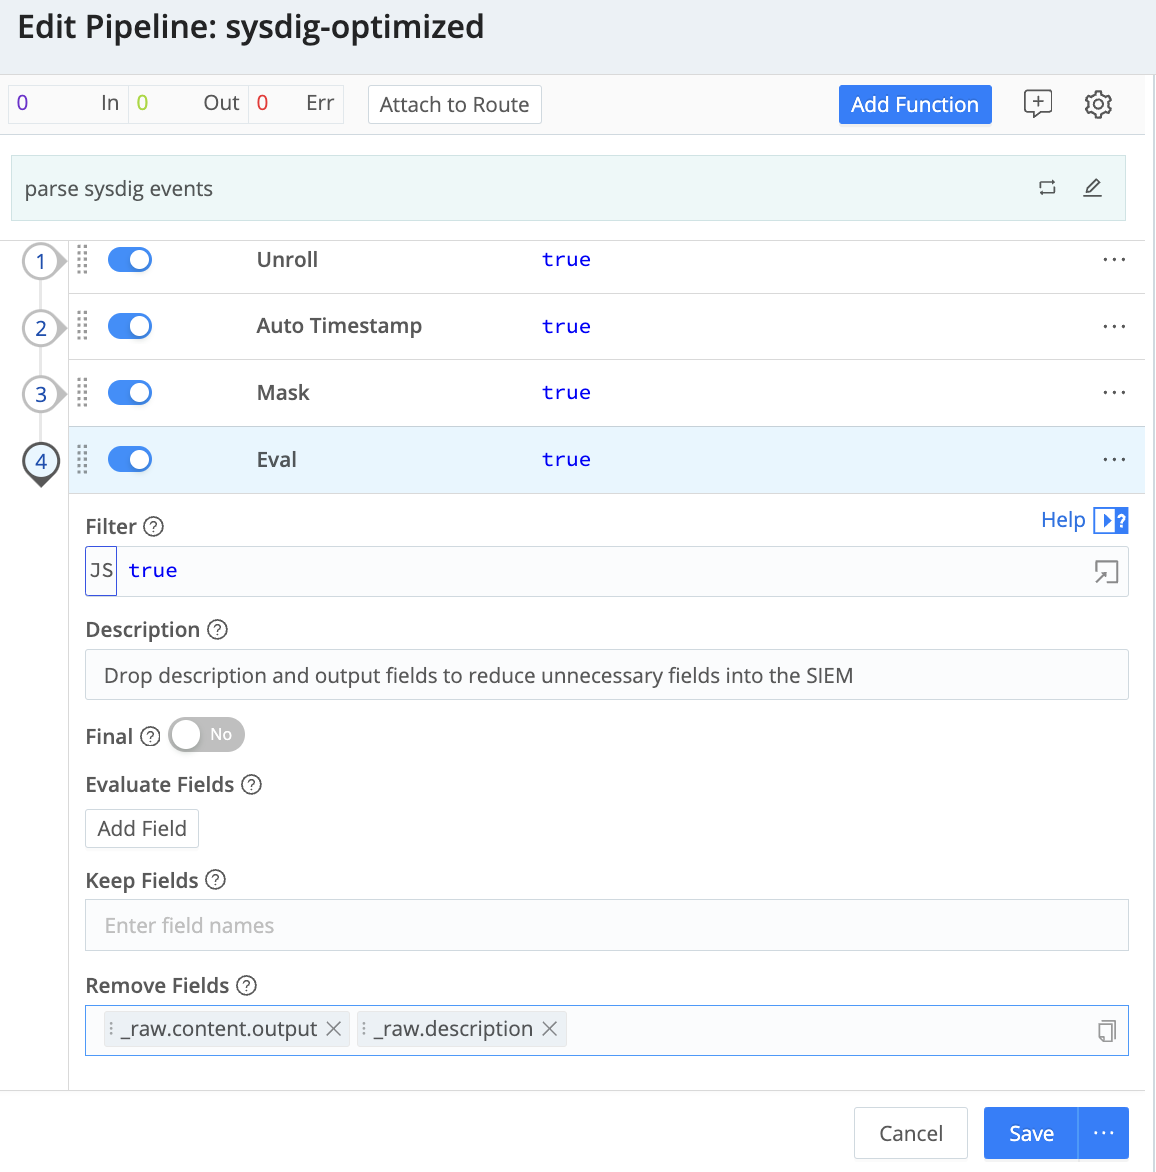
Optimization: To demonstrate how easy it is to add functions to the transformation process, let's remove a couple of fields that we would prefer not to store (in this example we are using an eval function to get rid of content.output and content.description)
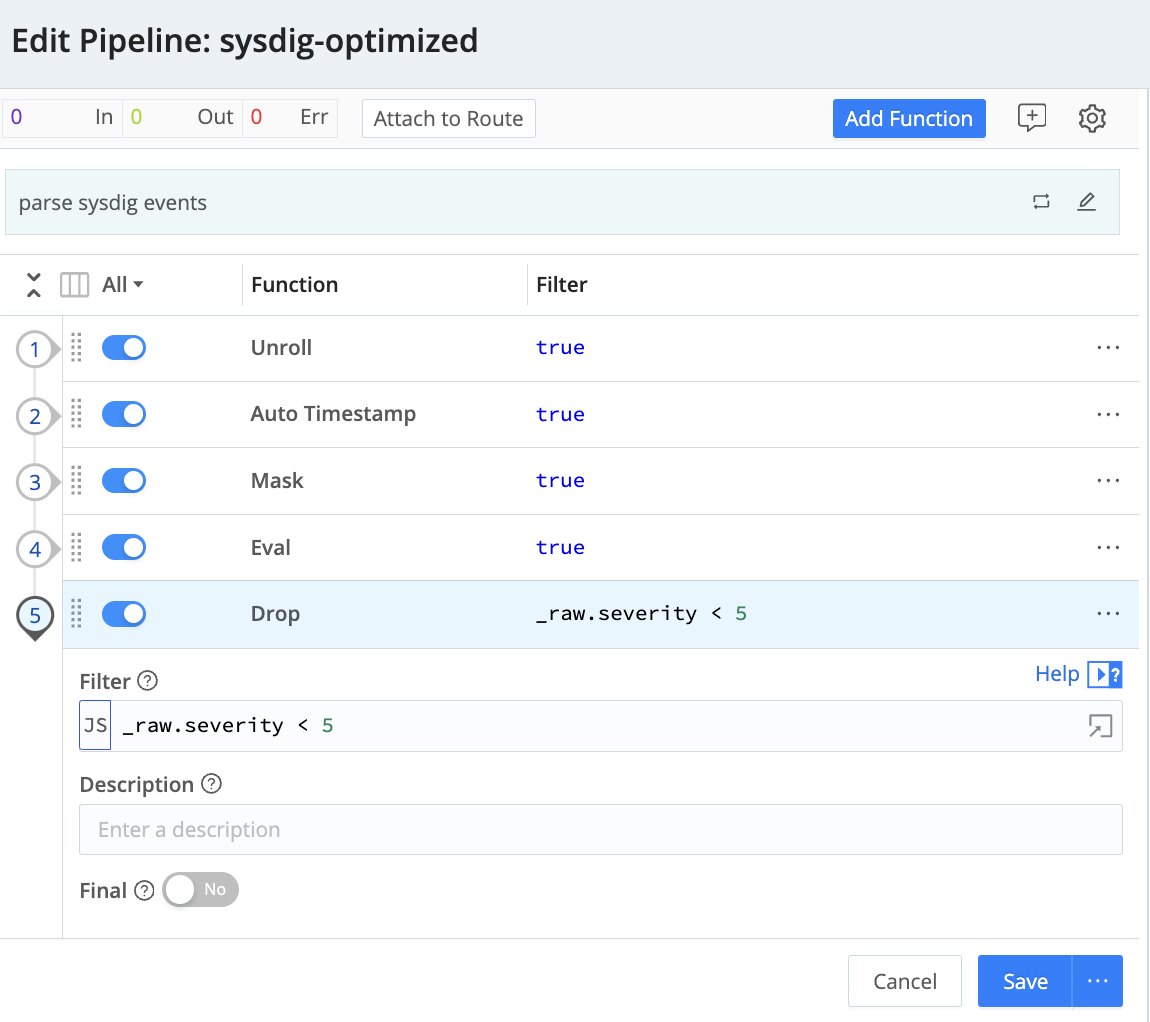
Dynamic routing: Suppose you want to persist only the most critical findings in your SIEM, storing the rest of the events in a cheaper storage like a Data Lake. Just create two pipelines and add a Drop function to suppress any events whose severity is less than 5 (High and Critical)
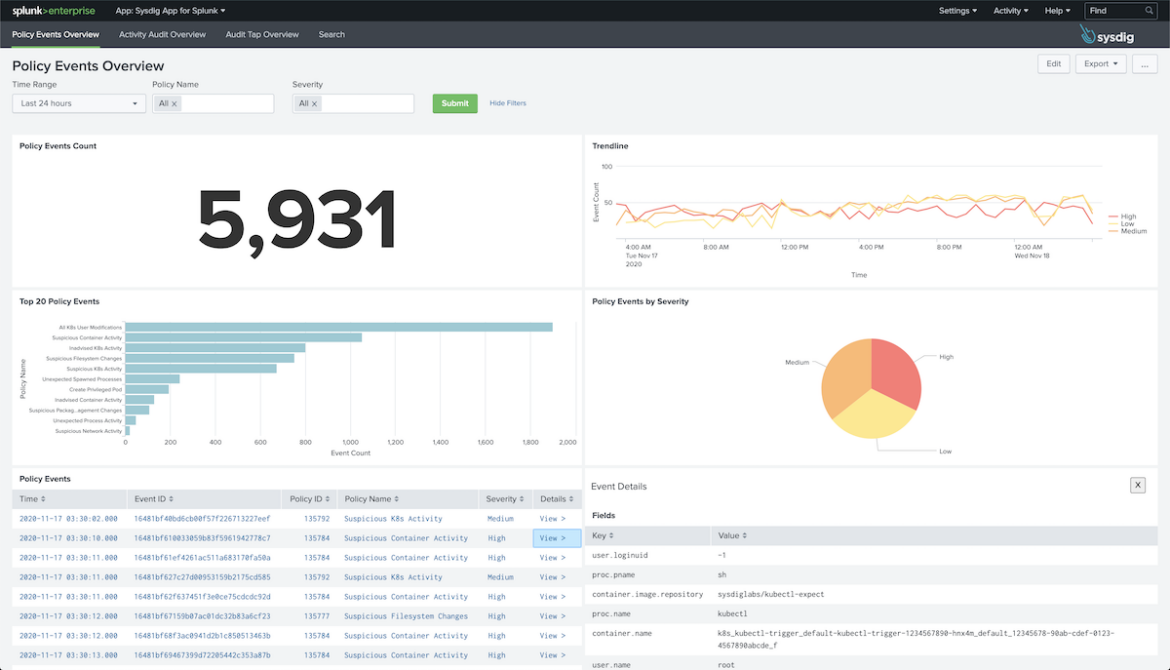
Step Five>> Verify that the data is beginning to appear in Splunk
Use case B: Squeeze Sysdig data with Cribl Data Lake
Step 1>> Add a new destination
- Access to Cribl Streams, browse to Route and Quick Connect again.
- Add Destination and choose Cribl Lake, reuse the previous pipeline or create a new one.
- Connect the Sysdig source to the Cribl Lake destination.
- Go to Cribl Lake, Datasets and check that the integration is associated with the default events (here you can also change the retention period if you want to).
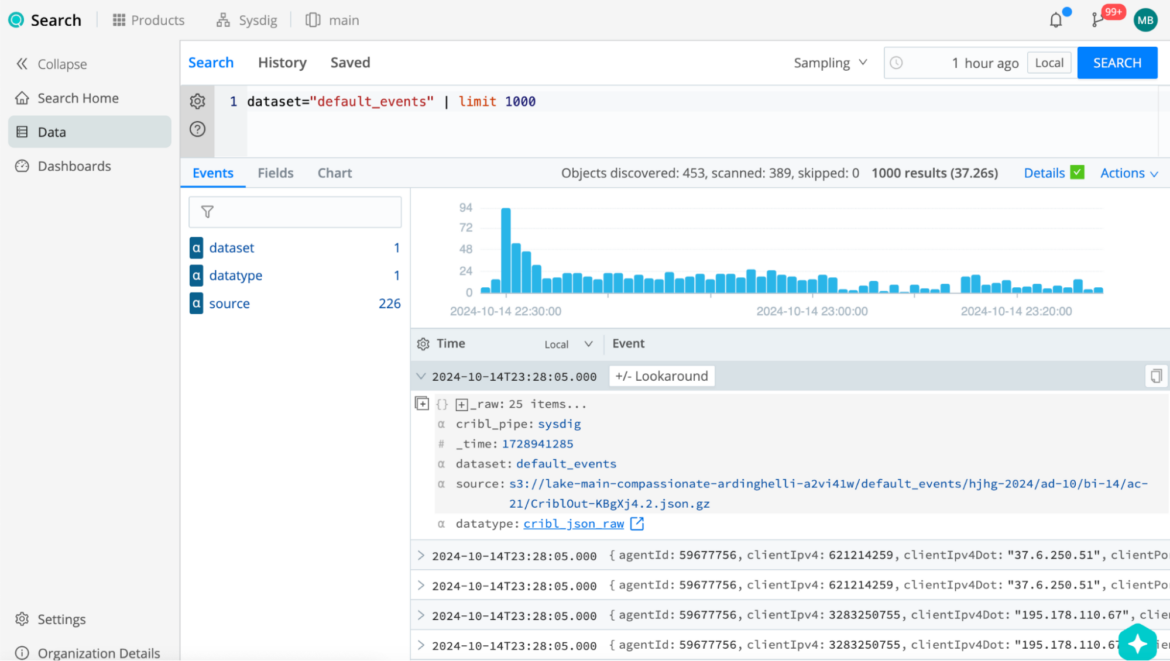
Step Two>> Query the Data Lake
- From the Cribl Lake, Datasets screen, click the corresponding Search button from default events.
- Set the time window to the desired time (i.e. 24 hours) and test some queries in the search box.
Let's try some useful queries:
dataset="default_events" | extract type=json | where type == 'policy' and source ==
'syscall' and labels["cloudProvider.name"] == 'gcp'
Request all the CWPP events running in a GCP project.
dataset="default_events" | extract type=json | where type == 'policy' and source ==
'awscloudtrail' | summarize count()
Request all the CDR events from AWS Cloudtrail.
dataset="default_events" | extract type=json | where type == 'policy' and source ==
'syscall' | dedup by labels["host.hostName"]
Request CWPP events, deduplicating by hostname.
Step Three>> Build a Sysdig Dashboard
Once again, although we explain it step by step here, you can reuse the Cribl packs for Sysdig to speed up the process.
- From the main menu, browse to Cribl Search > Dashboards and click the button Add Dashboard, set the desired Name, and Save.
- From the top right three dots, choose Edit. Once the dashboard is in edit mode, click Add > Visualization. Set the Title, Search Query, and time window.
- For our sample Sysdig Dashboard we created the following 7 visualization elements:
- Test the new dashboard (make sure that you have enough historic data to get the charts drawn properly).
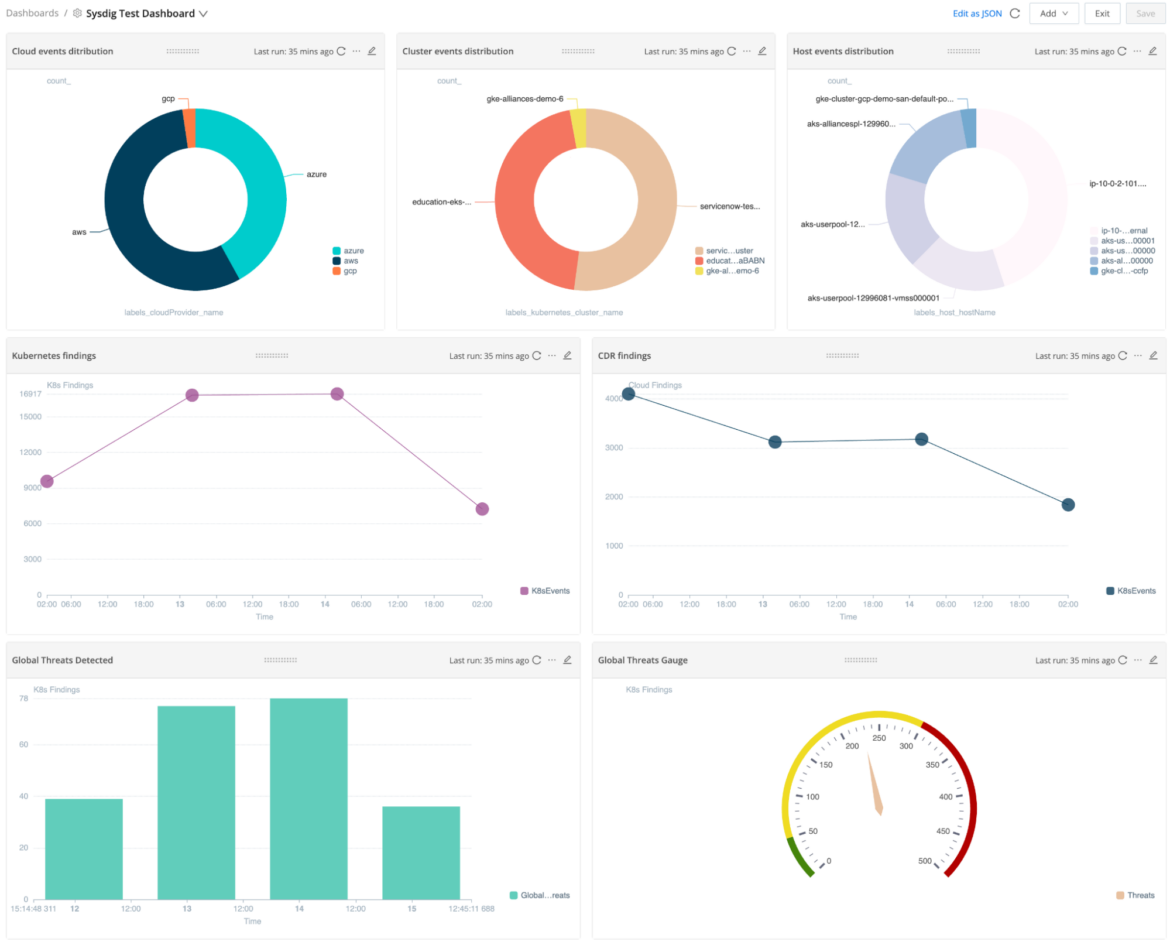
- You can play around with the dashboard and try options like Open In Search or Export visualization to PNG.
Conclusion
This integration provides a powerful solution for managing the complexities of cloud security data at scale. By combining Sysdig's robust security insights with Cribl's data routing and optimization capabilities, security teams can streamline their workflows and reduce storage costs, while increasing their resilience.
Important Links:
- Documentation for Sysdig-Cribl Integration
- Sysdig-Cribl Partnership page

