
Happy New Year 2017 to everyone! The cold hasn’t frozen our development pace, and during the last 3 months we have kept working hard on improvements to Sysdig Monitor. As is our tradition, we’re really excited to round up all the great stuff we’ve done into our Winter Release notes.
Let’s do a quick run-down on the most important features and where possible we will link you to deeper information on how to use the features.
Container monitoring for teams
In November we announced Sysdig Teams to make easier monitoring containers and microservices in teams. Sysdig leverages Kubernetes (and other container orchestration tools) metadata to understand how your infrastructure is deployed; next step has been to automatically define visibility and access control based on the information that orchestration platform already has.
Users in multiple scenarios like running microservices apps, running PaaS for different teams within their organization, or with strong security requirements or data access restrictions are loving it! Read more about Sysdig Teams on Introducing Sysdig teams – service-based access control for simpler and more secure Kubernetes & Docker monitoring or checkout this 2 minute video for a quick intro:
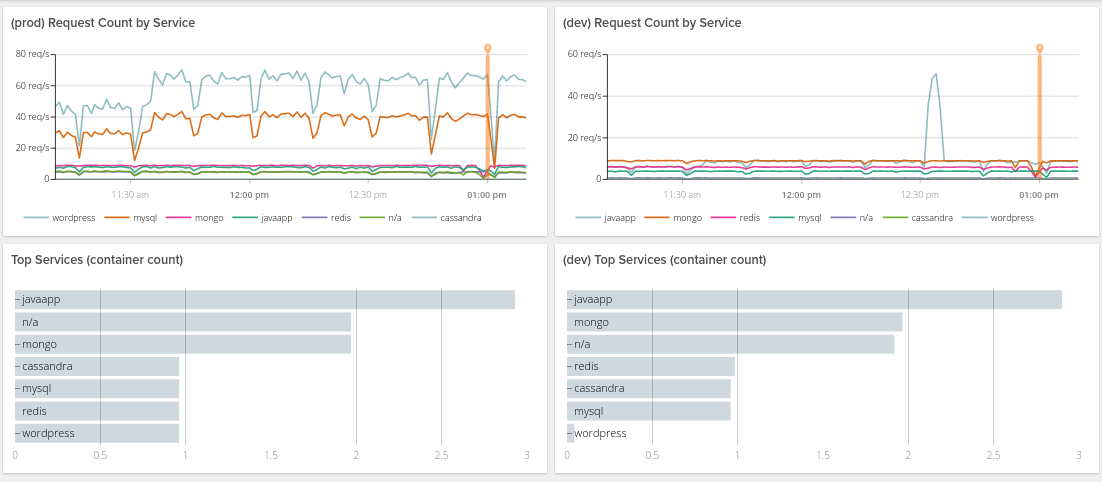
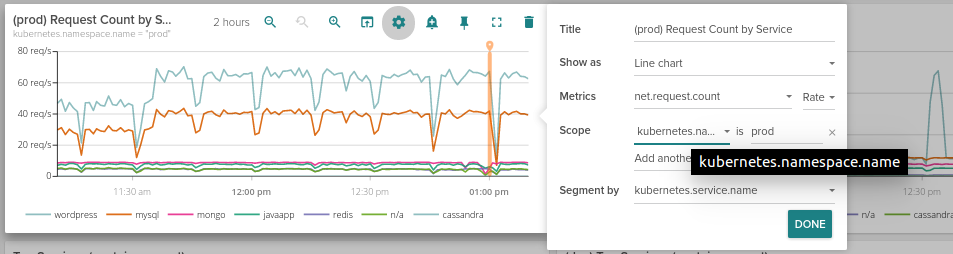
Dashboard panels scopes
This was a heavily requested feature: now each panel in any dashboard can individually set their metrics scope. Click on the gear icon on the panel and a configuration UI like in alerts will allow you to set the conditions that define the metrics included in the panel.
Making alerting easier
Alert configuration interface has been redesigned to make easier and more straightforward to configure alert parameters.
An updown process allows to define: the title, description, severity. The metric to alert on Alert when, the trigger conditions on Aggregated across and Segment by applies the conditions separately across each configured segment. There is a configurable wait time with Over the last and Across allows to specify if we want unique alerts for each segment or one for each.
As before you can send alerts to different notifications channels and trigger Sysdig captures for out of band diagnosis and troubleshooting. Captures default to 15 seconds long now.
New accounts and new teams in Sysdig Monitor will see some new alerts created by default although disabled. These cover the basic operating system monitoring with alerts on metrics like disk, CPU, memory and IO.
Custom App checks per container configuration
You can now define custom App checks configuration for every container. This allows to delegate monitoring configuration to the application teams. A variable called SYSDIG_AGENT_CONF will be checked for each monitored process, its parents and the Docker container. The value of this variable should follow the same syntax than on dragent.yaml, for example add to your Dockerfile or Pod definition:
ENV SYSDIG_AGENT_CONF {app_checks: [{ name: redisdb, pattern: {comm: redis-server}, conf: { host: 127.0.0.1, port: 6379, password: protected} }] }.
This is available from Sysdig Monitor agent 0.43.0 so remember to keep your agents updated to the last version, here is how to do it.
Improved metrics time traveling
Time navigation UI has been improved to make it easier to jump back and forward in time, selecting different graphing periods, from the last 10 seconds to 2 weeks time. Introducing exactly the date you want to visualize can be done before rendering the dashboard and old metrics gets consolidated and if the time selected needs to be slightly readjusted to match the consolidation, we will let you know in the UI.
Some other features
New metrics, MORE metrics, and metadata tags
There are a bunch of new metrics that you can monitor, and new tags to be used within your monitoring configuration like container.image.id. See the full list here.
File system usage metrics have been updated: fs.root.used.percent contains the usage of the root filesystem while fs.largest.used.percent is the usage of the largest file system, previously we had fs.used.percent that was the sum of all filesystems in use.
There are also new default limits on the metrics the agent sends to Sysdig Monitor: 300 beans per process, 500 metrics per process and 500 metrics per host.
Rate aggregation available
A new rate aggregation setting is available in addition to existing Average, Sum and Min/Max options. Rate returns the average value of the metric across the time period being evaluated. This is typically used in always increasing counter metrics like network traffic, file I/O, etc. This can be used both in graphs and alerts.
Sysdig in Rancher Catalog
Open source Sysdig and Sysdig Monitor are now both available in the Rancher Catalog. The Rancher Catalog is an awesome service provided with the Rancher platform that lets you one-click deploy popular applications directly into your stack. So now, with the power of Sysdig + Rancher, in just a couple seconds you can have deep, container-native visibility and monitoring deployed across your entire infrastructure.
Sysdig Monitor status page
We want you to always have the latest on Sysdig Monitor’s uptime status, performance, and recent events. That’s why we launched a status page where we’ll keep you continually updated. Remember you can also keep updated on product features through the What’s New page and RSS.
OpsGenie notification channel
We now have a native alerting integration with OpsGenie.
Invoices in the App
Dealing with invoices is not a gratifying task, that’s why if you need the latest or any old invoices for your billing department you can get them a few clicks aways within the Sysdig Monitor app.
Have you tried any of these new features yet? We would love to hear from you on @sysdig, we love feedback and features request, help us to shape the future of container monitoring and troubleshooting!