Falco Feeds extends the power of Falco by giving open source-focused companies access to expert-written rules that are continuously updated as new threats are discovered.

Measuring latency within my code is something that I do very very often. Occasionally I resort to tools like profilers to help me out but, honestly, most of the time I just put timers in my code and print the results to the console or a log file. The reasons are:
\r\r
- \r
- Running a profiler requires quite a bit of setup, which often is not justified or I'm too lazy to do \r
- A profiler tends to give me a very noisy output, like the full execution stack, while I usually only want to focus on a few specific portion of code \r
\r\r
I bet that this sounds pretty familiar to you. And I bet that, if you're lazy like I am, you're going to be interested in how to profile your software and systems with less effort. Read on!
\r\r
We are going to learn how to use a functionality recently added to sysdig, tracers, to easily take measurements inside your code and then analyze them. To ground the story, I'll use a real use case: Is the aggregate functionality introduced in MongoDB 2.2 faster than doing a traditional map-reduce call? If yes, how much better is it?
\r\r
Setup First of all, I need to deploy Mongo. Docker is my friend here:
\r\r$> docker run --name mongotest -d mongo \r\r
Now I need some data for the queries. I can create it using the ruby
\r\r
Faker library. For example, this scripts creates 30,000 simulated customer entries:
\r\rrequire 'faker'\r
require 'mongo'\r
\r
include Mongo\r
\r
client = MongoClient.new(ENV['MONGODB'], 27017)\r
db = client["test"]\r
collection = db["customers"]\r
\r
30000.times do\r
collection.insert({\r
:first_name => Faker::Name.first_name,\r
:last_name => Faker::Name.last_name,\r
:city => Faker::Address.city,\r
:country_code => Faker::Address.country_code,\r
:orders_count => Random.rand(10)+1\r
})\r
end\r
\r\r
Now let's execute the script:
\r\r$> MONGODB= ruby filldata.rb\r\r
And voila, we have a MongoDB backend with a bunch of data to play with!
\r\r
Instrumentation
\r\r
Now I'm going to create two scripts that each get the sum of the orders grouped by country code. However, the scripts leverage different underlying MongoDB facilities. The first one uses `map_reduce:"`
\r\rrequire 'mongo'\r
include Mongo\r
\r
$stdout.sync = true\r
\r
client = MongoClient.new(ENV['MONGODB'], 27017)\r
db = client["test"]\r
collection = db["customers"]\r
\r
loop do\r
print ">:t:map-reduce::n" # Mark the beginning of the query\r
\r
collection.map_reduce("function() { emit(this.country_code, this.orders_count) }",\r
"function(key,values) { return Array.sum(values) }", { :out => { :inline => true }, :raw => true});\r
\r
print "<:t:map-reduce::n" # Mark the end of the query\r
end\r
\r\r
While the second one uses aggregate:
\r\rrequire 'mongo'\r
include Mongo\r
\r
$stdout.sync = true\r
\r
client = MongoClient.new(ENV['MONGODB'], 27017)\r
db = client["test"]\r
collection = db["customers"]\r
\r
loop do\r
print ">:t:aggregate::n" # Mark the beginning of the query\r
\r
collection.aggregate( [\r
{ "$match" => {}},\r
{ "$group" => {\r
"_id" => "$country_code",\r
"value" => { "$sum" => "$orders_count" }\r
}\r
}\r
])\r
\r
print "<:t:aggregate::n" # Mark the end of the query\r
end\r
\r\r
Notice anything particular in these scripts? Yes, those prints in the code are sysdig tracers:
\r\rprint "<:t:aggregate::n" # Mark the end of the query\r\r
In this case, tracers do the following:
\r\r
- \r
- They mark the beginning and the end of a span. > is the beginning, and < is the end \r
- They give it a unique ID.t in this case means "use the thread ID as the span ID", which is an easy way to get a unique number across executions \r
- They also give it a name "map-reduce" is the name in the first script, "aggregate" in the second one. \r
\r\r
You can read the tracers manual for the details but, as you can see, it's pretty straightforward.
\r\r
When you write these strings to /dev/null and sysdig is running, sysdig captures them, decodes them and does the measurement magic for you.
\r\r
So let's run the scripts and redirect their output to /dev/null:
\r\r$> MONGODB= ruby query_agg.rb > /dev/null &\r
$> MONGODB= ruby query_mr.rb > /dev/null &\r
\r\r
Timing Analysis
\r\r
Sysdig lets me run my analysis live, as the scripts are running. This time however, I'm going to take a capture file:
\r\r$> sudo sysdig -w mongo.scap\r\r
Download the capture file and you will be able to practice what I describe in this blog post on your machine.
\r\r
Let's open the capture file with Csysdig:
\r\r$> csysdig -r mongo.scap\r\r
Let's take a high level look at the latencies, by selecting the Traces Summary view (F2 → Traces Summary):
\r\r

\r\r
This gives us the number of hits and timing information for the two types of queries that we instrumented. It's evident that aggregate is much faster, more than 6 times on average.
\r\r
Now let's switch to a spectrogram view (F2 → Traces Spectrogram):
\r\r

\r\r
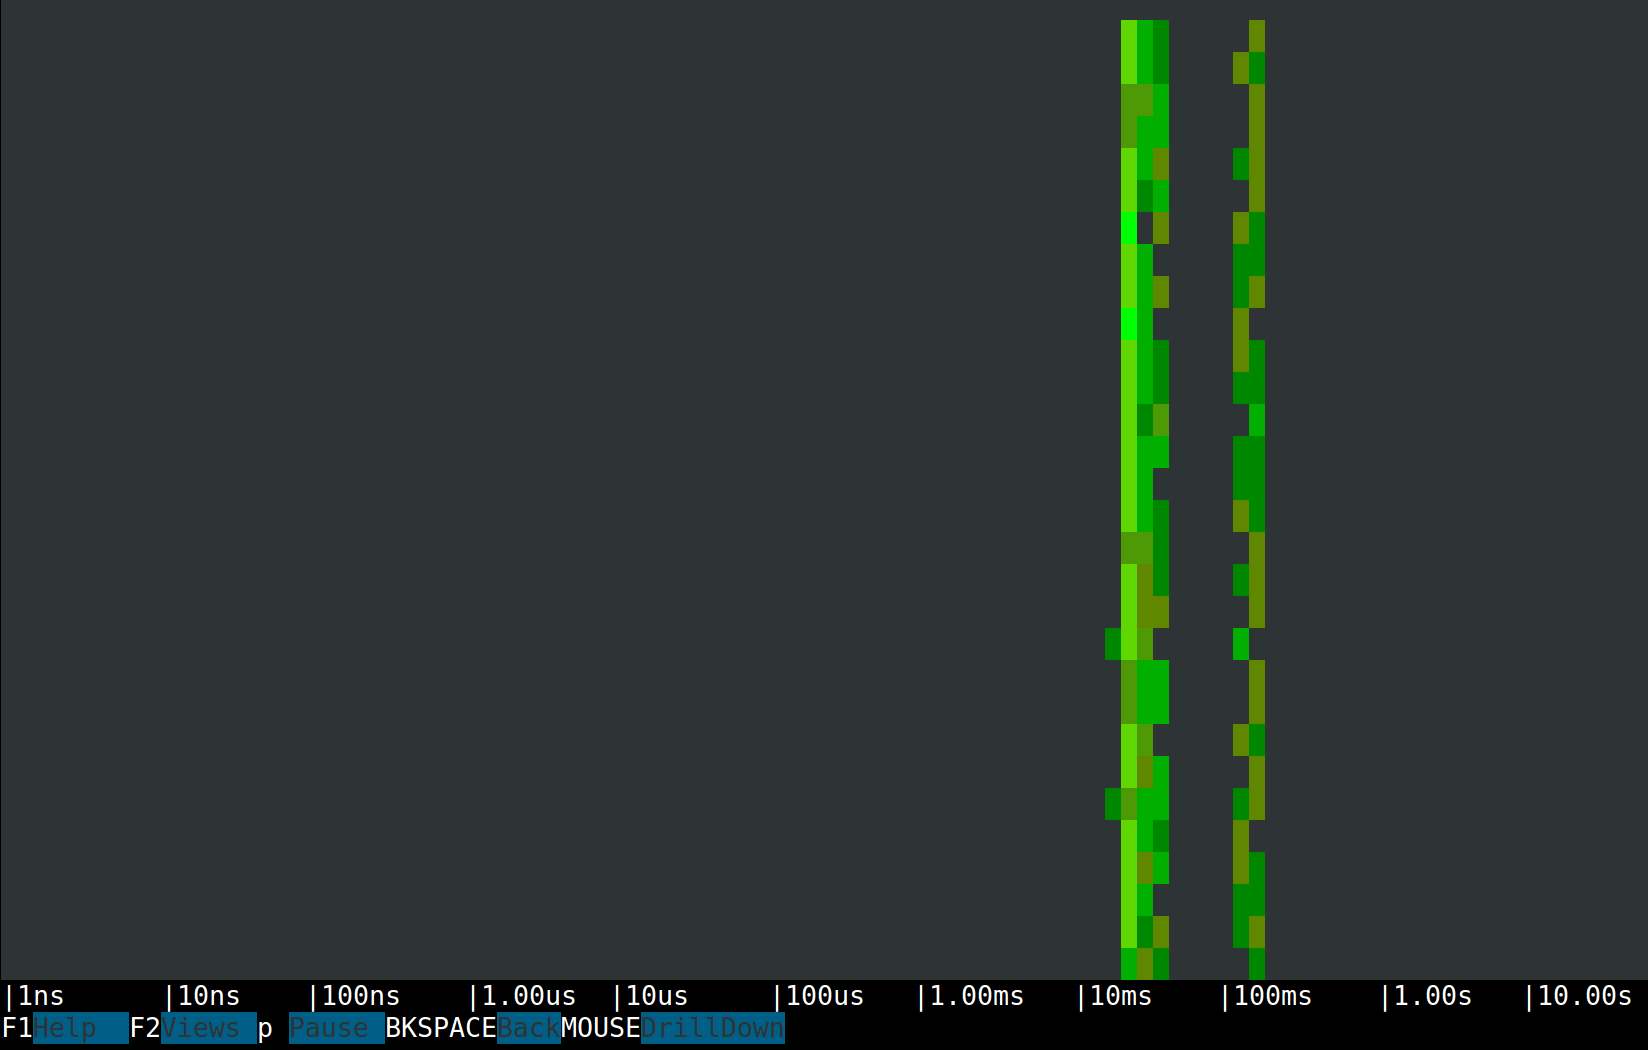
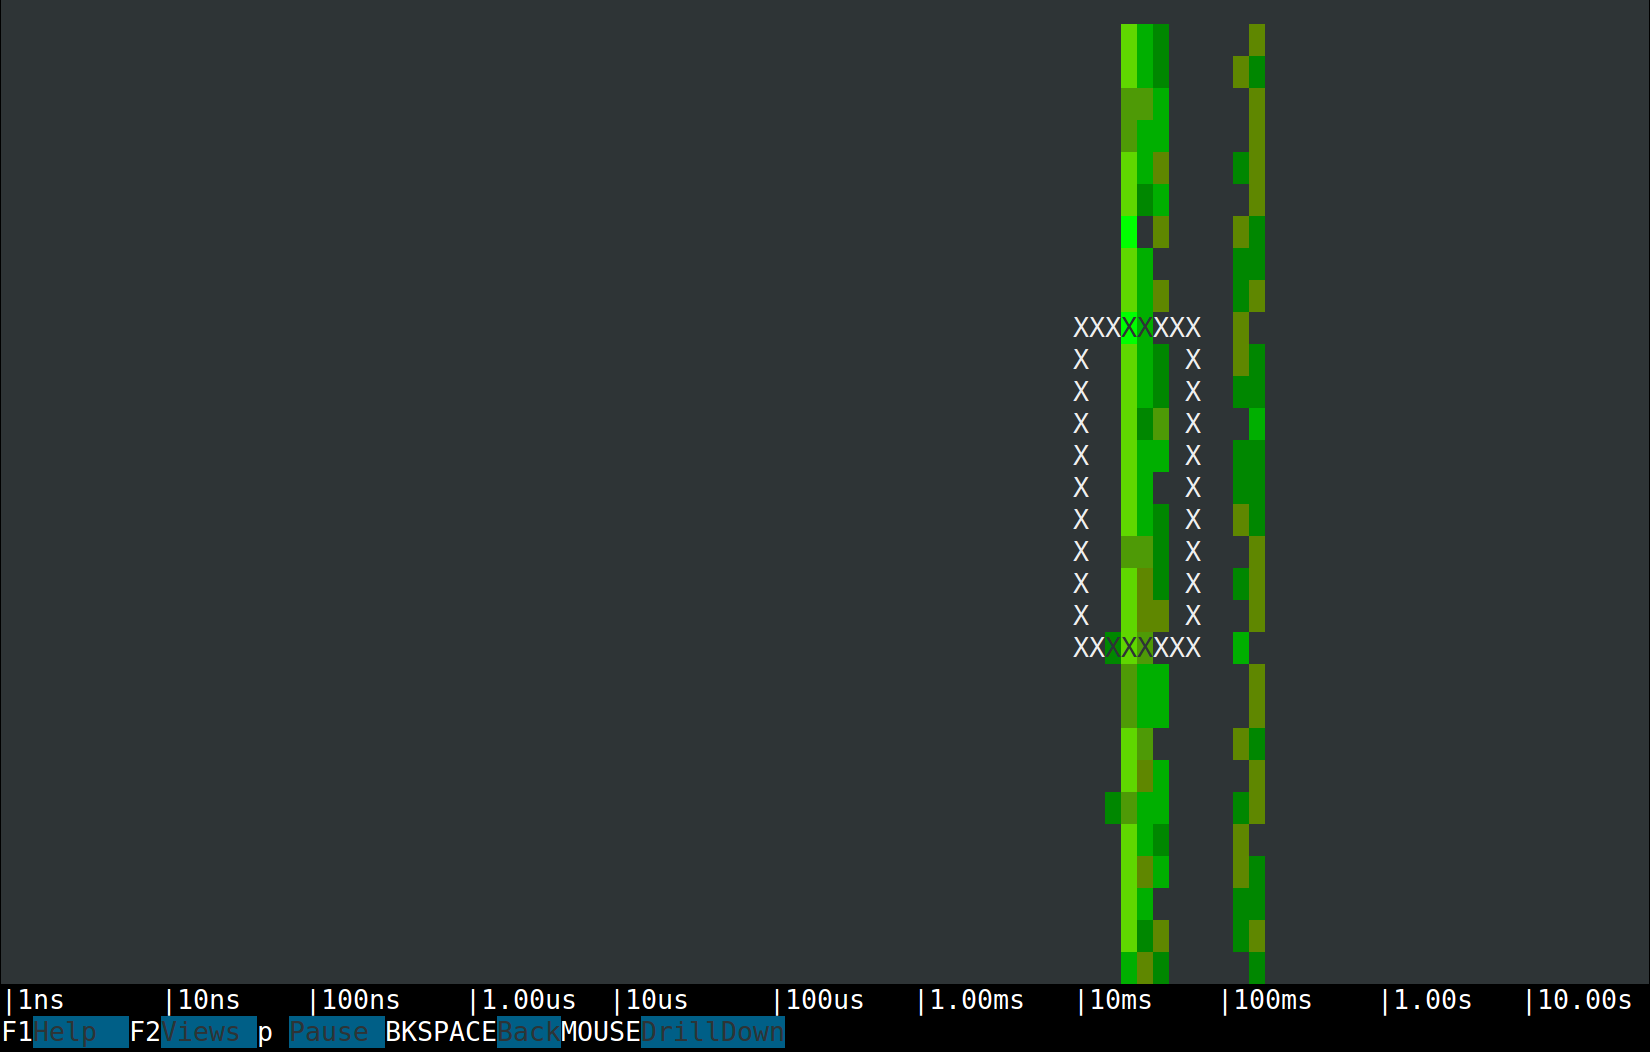
Spectrograms allow us to visualize the latencies of almost anything. In sysdig they are often used for measuring system calls, and now we can use them for trace spans as well.What we see is two clear latency bands, one in the tens of milliseconds and one in the hundreds of milliseconds. This is consistent with the output of the Traces Summary view, so my thesis is that the left band is made by aggregate requests, while the right band is all map-reduce requests. Proving the thesis is just a mouse click away. The Csysdig spectrogram allows me to make a selection and drill down to see inside it. So let's drill down into the left band:
\r\r

\r\r
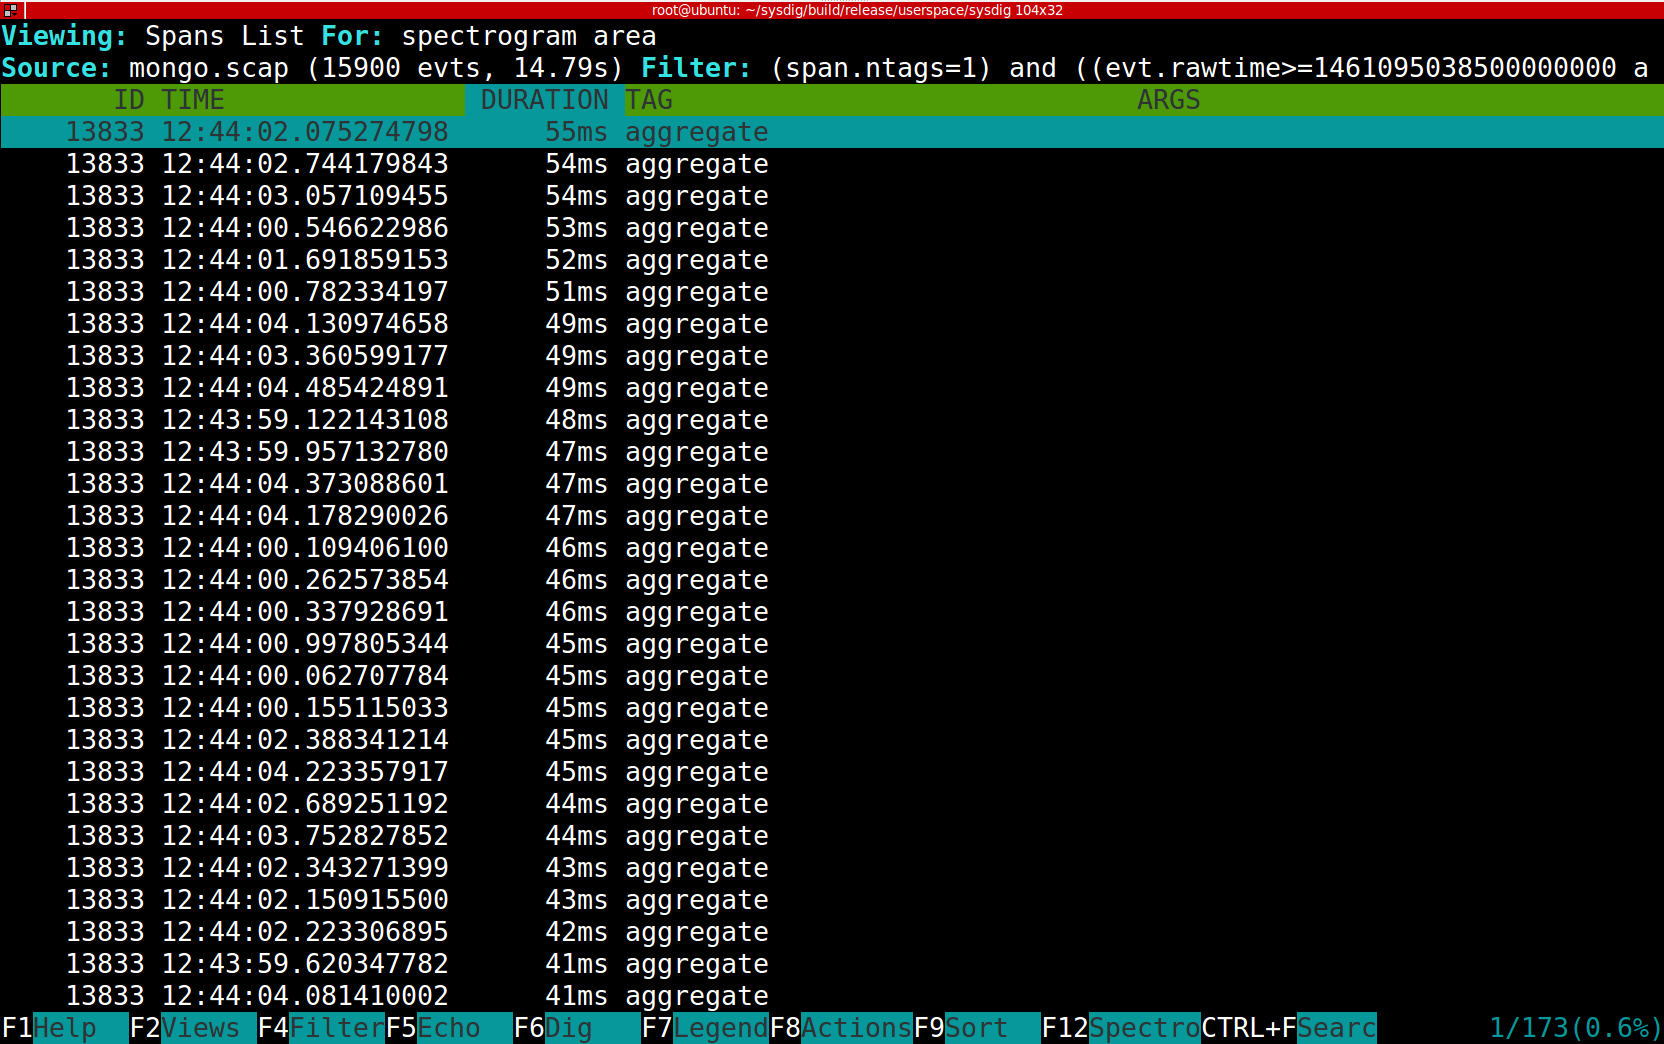
The result is shown in this picture and it's exactly what I expected:
\r\r

\r\r
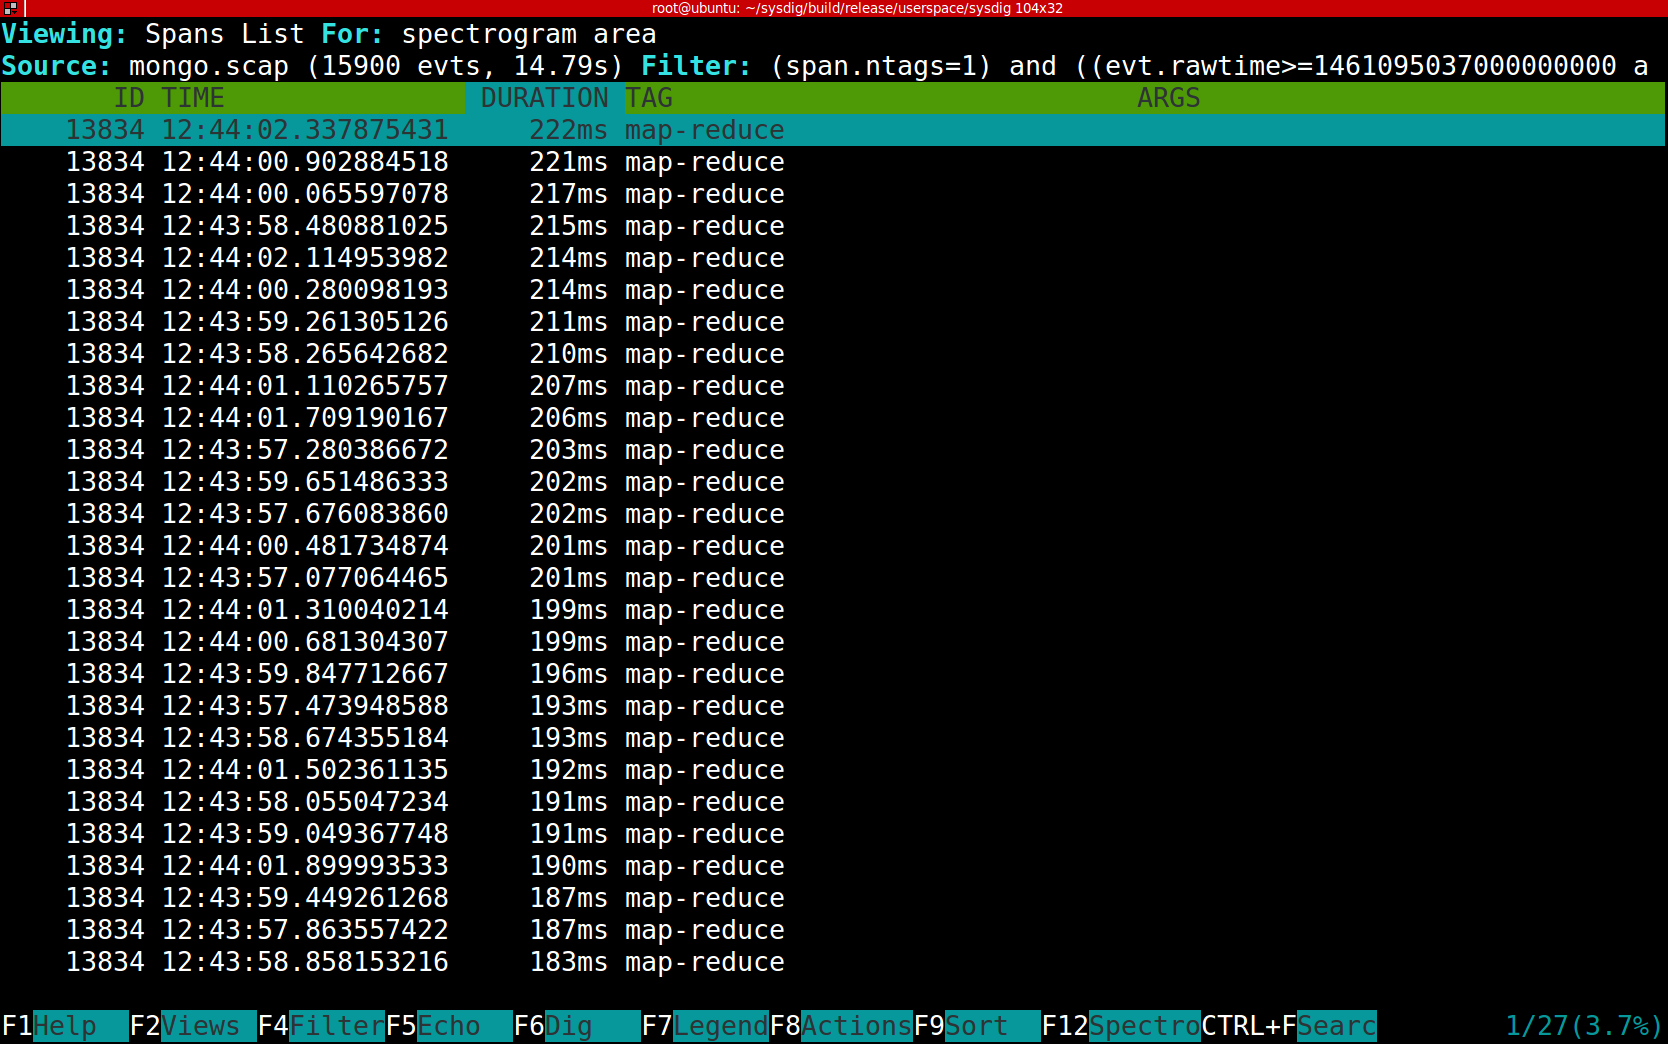
The right band contains only map-reduce requests, and each of them takes much longer:
\r\r

\r\r
Span-Based Resource Monitoring
\r\r
Once our app is instrumented with sysdig tracers, we can leverage full sysdig functionality in a span-aware way. For example, let's compare the network bandwidth utilization of the two query options. There are several ways to do it with sysdig, but this time I'm going to use the echo_fd chisel and just filter I/O from the map-reduce spans:
\r\r$> sysdig -r mongo.scap -c echo_fds evtin.span.tags=map-reduce\r
\r
------ Write 234B to 172.17.42.1:33431->172.17.0.28:27017 (ruby)\r
....m...............test.$cmd..............mapreduce.....customers..map.G...:...\r
------ Read 16B from 172.17.42.1:33431->172.17.0.28:27017 (ruby)\r
.$......m.......\r
------ Read 20B from 172.17.42.1:33431->172.17.0.28:27017 (ruby)\r
....................\r
------ Read 4B from 172.17.42.1:33431->172.17.0.28:27017 (ruby)\r
.#..\r
------ Read 8.99KB from 172.17.42.1:33431->172.17.0.28:27017 (ruby)\r
.results..#...0. ...._id.....AD..value........@..1. ...._id.....AE..value.......\r
\r
\r\r
The snippet above isolates a single query. We can see that there's a 191 byte request buffer and then another 4 buffers sent back from Mongo, for a total of 9480 bytes.
\r\r
Now let's try with aggregate:
\r\r$> sysdig -r mongo.scap -c echo_fds evtin.span.tags=aggregate\r
\r
------ Write 184B to 172.17.42.1:33430->172.17.0.28:27017 (ruby)\r
....+...............test.$cmd..............aggregate.....customers..pipeline.q..\r
------ Read 16B from 172.17.42.1:33430->172.17.0.28:27017 (ruby)\r
.&......+.......\r
------ Read 20B from 172.17.42.1:33430->172.17.0.28:27017 (ruby)\r
....................\r
------ Read 4B from 172.17.42.1:33430->172.17.0.28:27017 (ruby)\r
.&..\r
------ Read 7.96KB from 172.17.42.1:33430->172.17.0.28:27017 (ruby)\r
.waitedMS..........result..&...0.#...._id.....ET..orders_count.......1.#...._id.\r
\r
\r\r
Quite a bit smaller! A total of 8375 bytes, or around 12% better.
\r\r
Conclusion
\r\r
The first, obvious conclusion is: laziness pays off! Tracers are an easier method of profiling just about anything: methods in your software, file access, network transactions…anything. The second conclusion is: use aggregate and not map-reduce in your mongo queries. It will be much faster and save you network bandwidth.
\r\r
I hope that the measuring techniques explained in this blog post can be a useful addition to your toolbelt. We designed them to be as frictionless as possible but at the same time support common development use cases, especially in containerized environments.
\r\r
The whole stack described in the post is open source and very easy to install. Give it a try and let us you know what you think.


