


Falco Feeds extends the power of Falco by giving open source-focused companies access to expert-written rules that are continuously updated as new threats are discovered.

The following is a Docker container OOM (out of memory) troubleshooting story by one of our customer engineers here at Sysdig. Learn how he found out why Nginx + PHP-FPM was leaking memory using Sysdig Monitor, Sysdig open-source and gdb.
Containers might be one of the quickest adopted enterprise technologies of all time. Any new technology shift coupled with rapid adoption means you've got to get up to speed REALLY fast. We know this learning curve may be steep, and have opened up live chat to our Customer Success & Sales Engineering teams so we can give customers direct access to container management best practices, troubleshooting experts, and a friend who can help them on their container journey. We'll be sharing the wealth here with troubleshooting stories live from the field starting with a container OOM (out of memory) issue.
A major hosting provider running typical LAMP stack wrote in about unexpected container OOM events that kept happening on their systems seemingly without a valid reason. In this case their MySQL container kept getting killed by the kernel.
The initial suspicion from the customer was that our agent was utilizing a lot of memory and causing container OOM events on their hosts. Naturally we decided to investigate the customer's issue using both Sysdig Monitor and Sysdig open-source. First things first, let's try to reproduce the issue to understand what is going on.
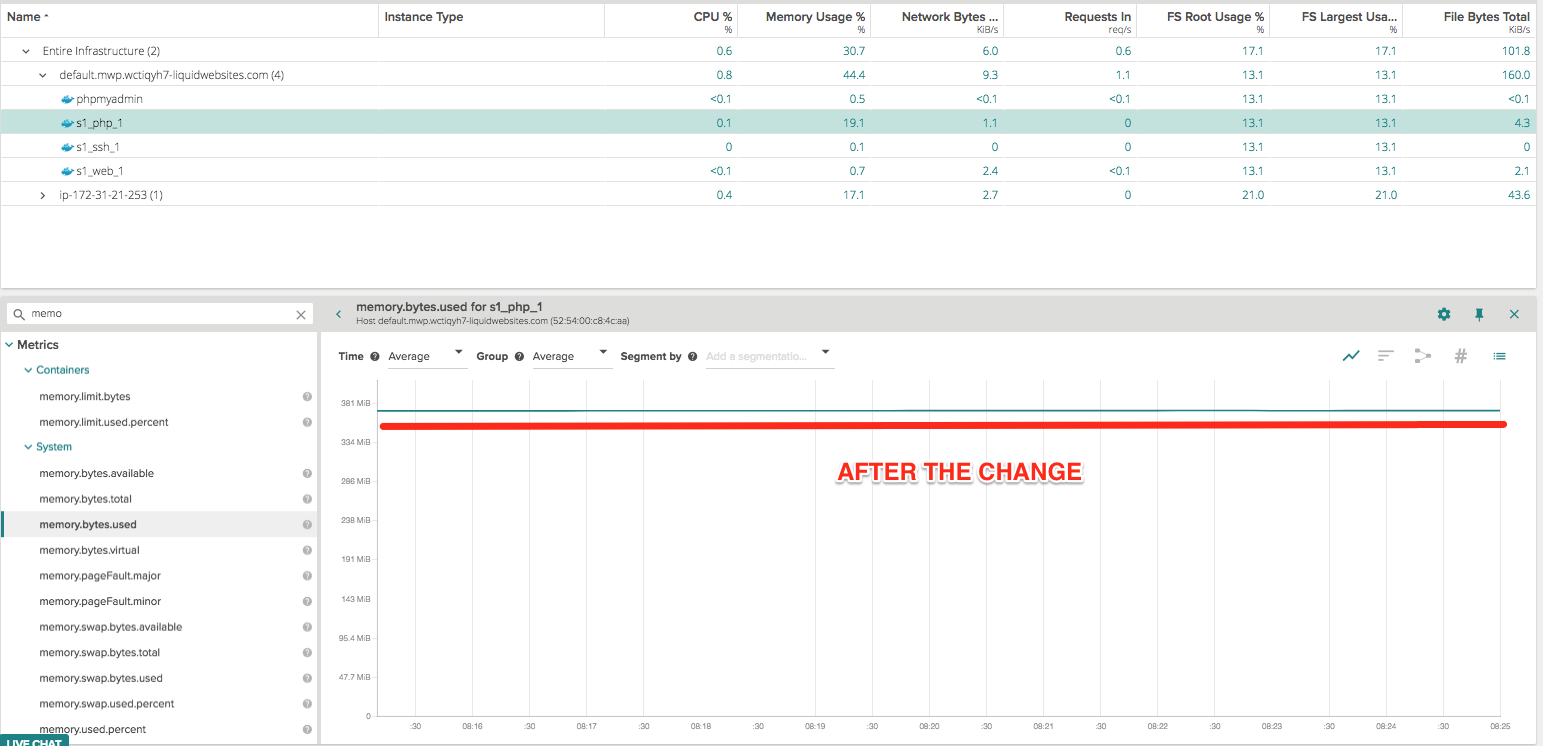
As we first jump into Sysdig Monitor to see what is reported by the host which had the OOM event happening, we see the host memory.bytes.used clearly on the rise: Hunting down a real life #Docker OOM scenario by following its syscall trail with Sysdig Monitor Click to tweet
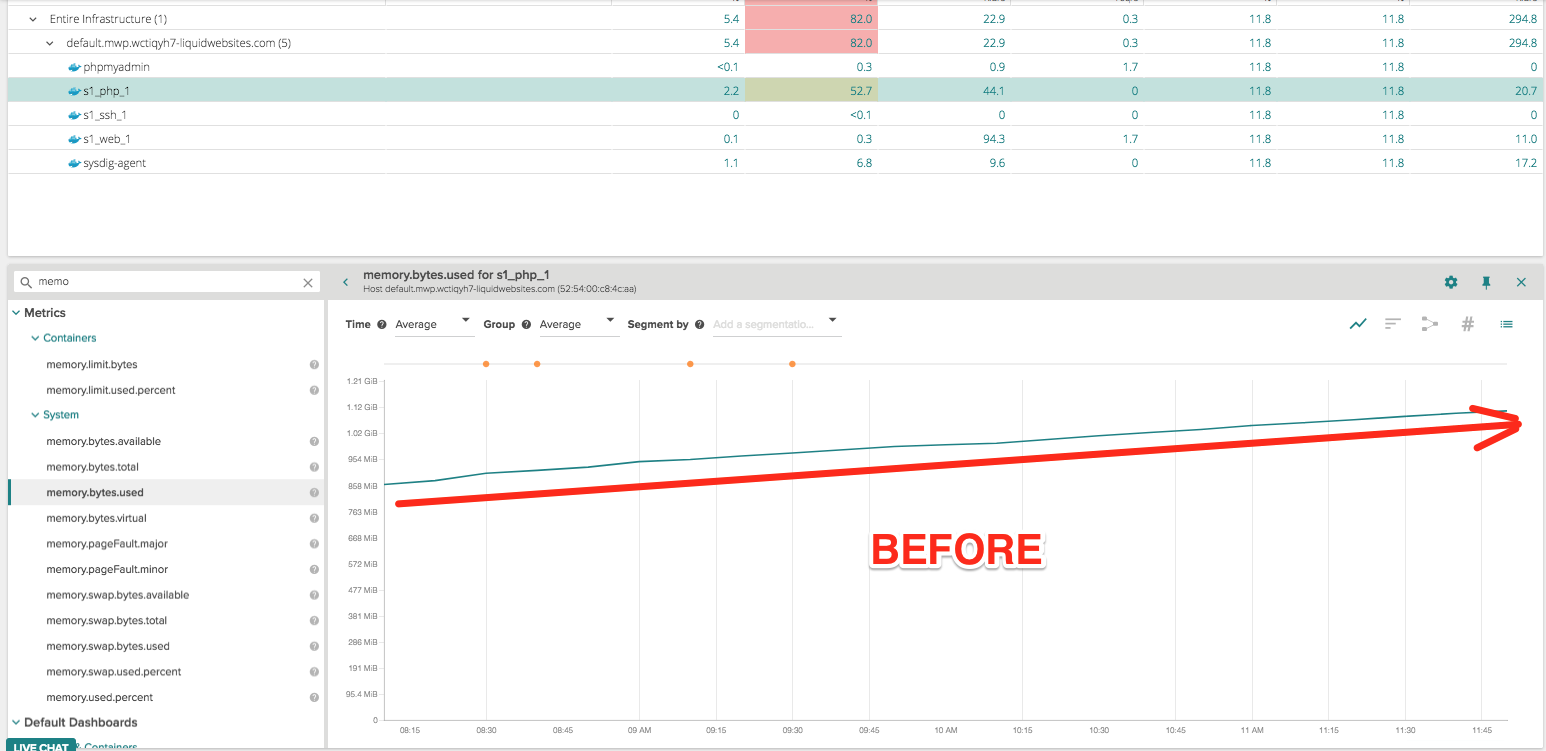
Their application is containerized so let's first segment by container.name to see what container is contributing to the memory growth: we can see s1_php_1 is growing in residential memory use while s1_web1_1 remains consistently low and the MySQL container did not increase its memory usage.
To get more insights on what's going on, we decide to take a Sysdig capture which will create a file with all the system events. This will allow us to analyze what is our agent doing and why PHP-FPM container is eating the memory.
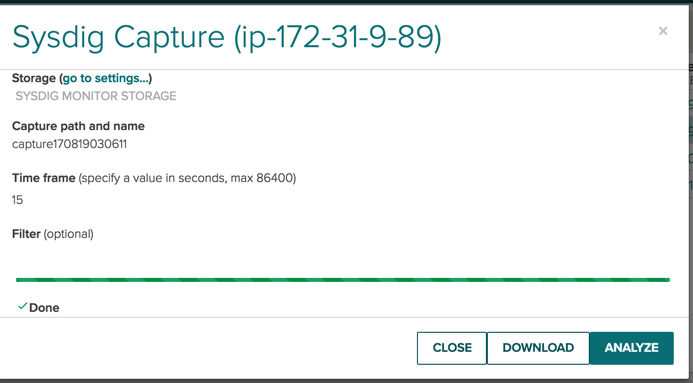
After downloading the file, we can open the capture with sysdig cli, filter on the PHP-FPM container and analyze all the file I/O activity with the echo_fds chisel:
sysdig -r capture170819032246-1503181393420.scap container.name=s1_php_1 -c echo_fds
Immediately we will see something is wrong: 404 errors are never a good sign. In this case it is clear that 404 is returned to two requests
----- Write 58B to   pipe:[3992672] (php-fpm)
127.0.0.1 -  19/Aug/2017:22:23:12 +0000 "GET /status" 404
------ Write 168B to   127.0.0.1:35264->127.0.0.1:9000 (php-fpm)

Primary script unknown
kStatus: 404 Not Found
X-Powered-By: PHP
------ Read 8B from   127.0.0.1:35264->127.0.0.1:9000 (php-fpm)
------ Read 8B from   127.0.0.1:35264->127.0.0.1:9000 (php-fpm)
------ Read 8B from   127.0.0.1:35266->127.0.0.1:9000 (php-fpm)
------ Read 8B from   127.0.0.1:35266->127.0.0.1:9000 (php-fpm)
------ Read 8B from   127.0.0.1:35266->127.0.0.1:9000 (php-fpm)
------ Read 304B from   127.0.0.1:35266->127.0.0.1:9000 (php-fpm)
CONTENT_LENGTH0CONTENT_TYPESERVER_NAMElocalhostREMOTE_ADDR127.0.0.1SCR
------ Read 8B from   127.0.0.1:35266->127.0.0.1:9000 (php-fpm)
------ Write 56B to   pipe:[3992672] (php-fpm)
127.0.0.1 -  19/Aug/2017:22:23:12 +0000 "GET /ping" 404
------ Write 168B to   127.0.0.1:35266->127.0.0.1:9000 (php-fpm)

Primary script unknown
kStatus: 404 Not Found
X-Powered-By: PHP
------ Read 8B from   127.0.0.1:35266->127.0.0.1:9000 (php-fpm)
------ Read 8B from   127.0.0.1:35266->127.0.0.1:9000 (php-fpm)
------ Read 8B from   127.0.0.1:35268->127.0.0.1:9000 (php-fpm)
------ Read 8B from   127.0.0.1:35268->127.0.0.1:9000 (php-fpm)
------ Read 8B from   127.0.0.1:35268->127.0.0.1:9000 (php-fpm)
:
------ Read 320B from   127.0.0.1:35268->127.0.0.1:9000 (php-fpm)
CONTENT_LENGTH0CONTENT_TYPESERVER_NAMElocalhostREMOTE_ADDR127.0.0.1SCR
------ Read 8B from   127.0.0.1:35268->127.0.0.1:9000 (php-fpm)
Code language: JavaScript (javascript)
GET /status and GET /ping which are initiated by Sysdig Monitor Ngnix AppCheck.
So, what do we know so far:
The Nginx AppCheck is trying to get the status metrics of Nginx running in s1_web_1 container, but Nginx is passing this request to the PHP-FPM running in the s1_php_1 container instead of returning metrics.
But this still doesn't answer our questions:
- Why is memory utilization growing for this container?
- Who is requesting and not releasing the memory?
Since memory can be allocated by multiple types of system calls , let's try first to find out which of the requests causing the container OOM problem. We troubleshoot further using our open source tool Sysdig and look for residential memory sizes for all process which includes php in its name.
sysdig -s 2000 -A -pc  "evt.type in (brk,mmap)  and  proc.name contains php "


1409831 20:49:54.464412513 0 s1_php_1 (3257e0a01572) php-fpm (3532:21) > brk addr=556341D6F000
1409832 20:49:54.464416248 0 s1_php_1 (3257e0a01572) php-fpm (3532:21) brk res=556341D6F000 vm_size=767128 vm_rss=394508 vm_swap=22048
1409855 20:49:54.464470456 0 s1_php_1 (3257e0a01572) php-fpm (3532:21) > mmap addr=0 length=264 prot=1(PROT_READ) flags=1(MAP_SHARED) fd=9(f>/var/www/html/wp-content/plugins/bj-lazy-load/inc/compat/opera-mini.php) offset=0
1409856 20:49:54.464473864 0 s1_php_1 (3257e0a01572) php-fpm (3532:21) mmap res=7FF9E2A3D000 vm_size=767132 vm_rss=394508 vm_swap=22048
1409891 20:49:54.464538246 0 s1_php_1 (3257e0a01572) php-fpm (3532:21) > mmap addr=0 length=245 prot=1(PROT_READ) flags=1(MAP_SHARED) fd=9(f>f>/var/www/html/wp-content/plugins/bj-lazy-load/inc/compat/wp-print.php) offset=0
1409892 20:49:54.464540660 0 s1_php_1 (3257e0a01572) php-fpm (3532:21) mmap res=7FF9E2A3D000 vm_size=767132 vm_rss=394512 vm_swap=22048
1409925 20:49:54.464585580 0 s1_php_1 (3257e0a01572) php-fpm (3532:21) > mmap addr=0 length=233 prot=1(PROT_READ) flags=1(MAP_SHARED) fd=9(f>f>/var/www/html/wp-content/plugins/bj-lazy-load/inc/compat/wptouch.php) offset=0
1409926 20:49:54.464587676 0 s1_php_1 (3257e0a01572) php-fpm (3532:21) mmap res=7FF9E2A3D000 vm_size=767132 vm_rss=394512 vm_swap=22048
1409959 20:49:54.464629549 0 s1_php_1 (3257e0a01572) php-fpm (3532:21) > mmap addr=0 length=285 prot=1(PROT_READ) flags=1(MAP_SHARED) fd=9(f>f>/var/www/html/wp-content/plugins/bj-lazy-load/inc/compat/mobilepress.php) offset=0
1409960 20:49:54.464631433 0 s1_php_1 (3257e0a01572) php-fpm (3532:21) mmap res=7FF9E2A3D000 vm_size=767132 vm_rss=394512 vm_swap=22048
1410413 20:49:54.465196243 0 s1_php_1 (3257e0a01572) php-fpm (3532:21) > mmap addr=0 length=2896 prot=1(PROT_READ) flags=1(MAP_SHARED) fd=9(f>f>/var/www/html/wp-includes/template-loader.php) offset=0
1410414 20:49:54.465199366 0 s1_php_1 (3257e0a01572) php-fpm (3532:21) mmap res=7FF9E2A3D000 vm_size=767132 vm_rss=394512 vm_swap=22048
1411487 20:49:54.466370148 0 s1_php_1 (3257e0a01572) php-fpm (3532:21) > brk addr=556341D66000
f>
Code language: HTML, XML (xml)
It is easy to see that we cannot blame mmap, as residential memory remained static 394512B, however with brk call we added 4 bytes (394508 grew to 394512).
Now, we can just concentrate on the brk calls:
sysdig -s 2000 -A -pc -p "%proc.vmrss" "evt.type=brk and  proc.name contains php "
Code language: PHP (php)
(in bytes)
14624
35224
38024
40088
Just to make sure we are on the right path it would not hurt to verify our findings with htop.
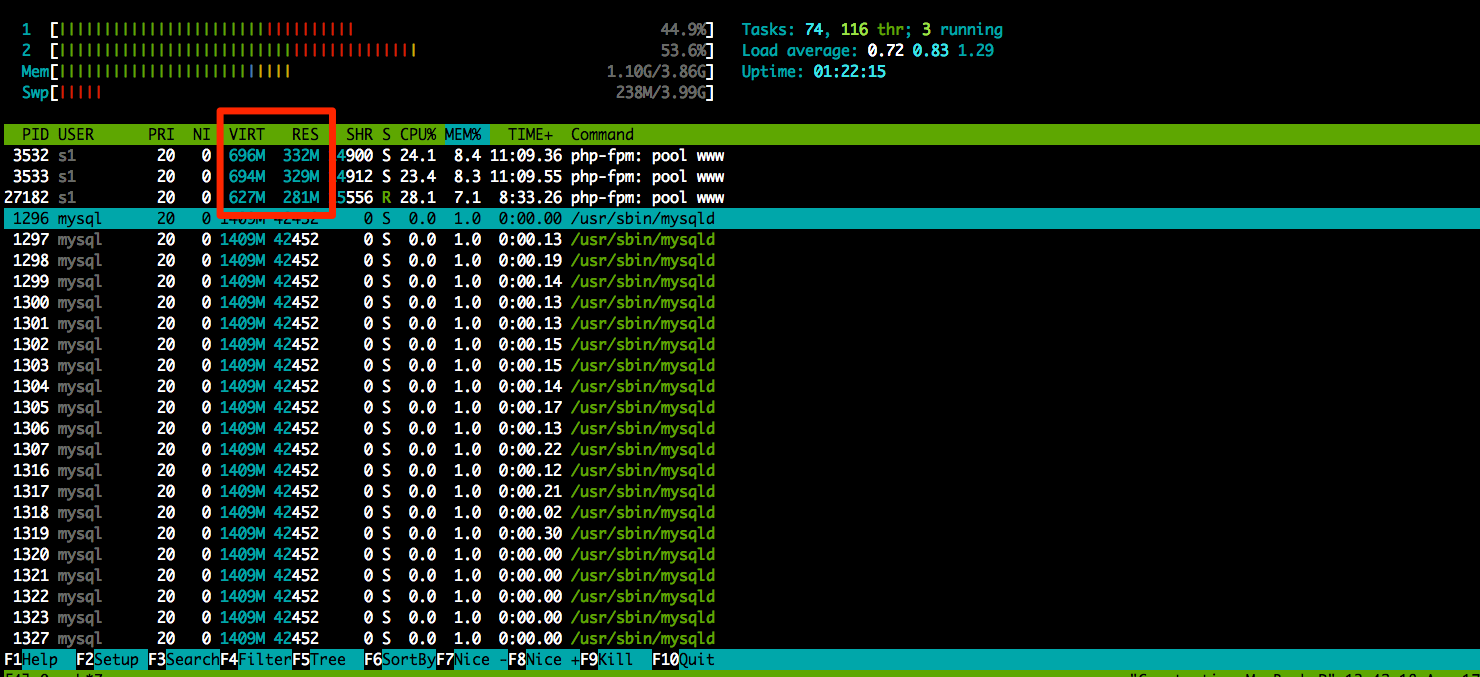
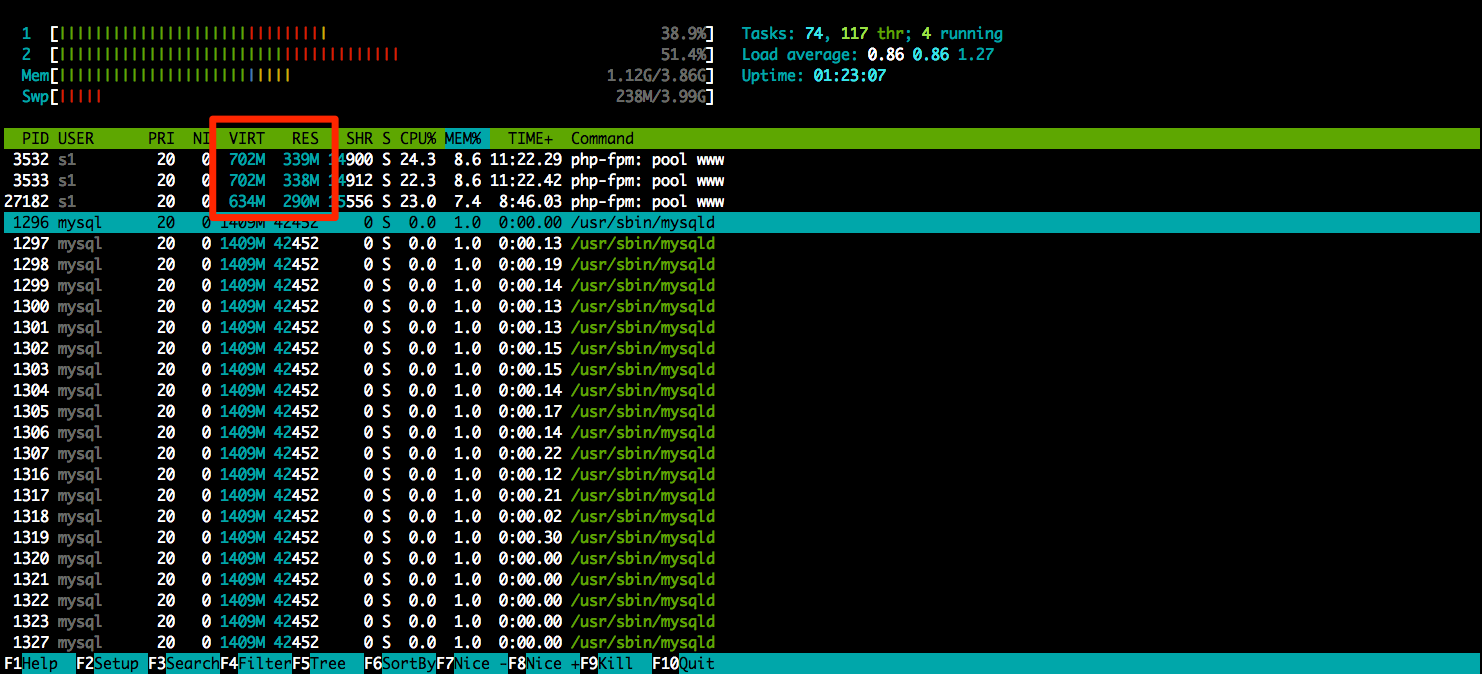
OK, so now, without a doubt, processes with PIDs 3532,3533 and 27182 are growing in size. But why?
At this point it's time to use some heavy ammunition and go beyond system calls. We restarted the PHP container in the privileged mode and installed gdb inside the container (the host OS does not have the required PHP libraries). Also we ran this Docker container with OS pid space so we can address PIDs directly.
Now let try to find out what is happening when brk call is received by using catch syscall brk:
(gdb) attach 3532
Attaching to process 3532
…
[ Boilerplate output removed ]
…
(gdb) catch syscall brk
Catchpoint 1 (syscall 'brk' [12])
(gdb) c
Continuing.
Catchpoint 1 (returned from syscall brk), 0x00007f842ea770ac in __brk (addr=0x55a5681df000) at ../sysdeps/unix/sysv/linux/x86_64/brk.c:31
31 in ../sysdeps/unix/sysv/linux/x86_64/brk.c
BINGO! we caught the memory consuming call. What is it?
(gdb) bt
#0  0x00007f842ea770ac in __brk (addr=0x55a5681df000) at ../sysdeps/unix/sysv/linux/x86_64/brk.c:31
#1  0x00007f842ea77146 in __GI___sbrk (increment=135168) at sbrk.c:53
#2  0x00007f842ea147a9 in __GI___default_morecore (increment=) at morecore.c:47
#3  0x00007f842ea10954 in sysmalloc (av=0x7f842ed3b620 , nb=4112) at malloc.c:2462
#4  _int_malloc (av=0x7f842ed3b620 , bytes=4096) at malloc.c:3800
#5  0x00007f842ea12020 in __GI___libc_malloc (bytes=4096) at malloc.c:2891
#6  0x00007f84300bf19b in ?? () from /lib/x86_64-linux-gnu/libpcre.so.3
#7  0x00007f84300dc7ed in ?? () from /lib/x86_64-linux-gnu/libpcre.so.3
#8  0x00007f84300d4a39 in ?? () from /lib/x86_64-linux-gnu/libpcre.so.3
#9  0x00007f84300d63f1 in ?? () from /lib/x86_64-linux-gnu/libpcre.so.3
#10 0x00007f84300d3eb4 in ?? () from /lib/x86_64-linux-gnu/libpcre.so.3
#11 0x00007f84300d63f1 in ?? () from /lib/x86_64-linux-gnu/libpcre.so.3
#12 0x00007f84300e05af in ?? () from /lib/x86_64-linux-gnu/libpcre.so.3
#13 0x00007f84300e54a5 in pcre_study () from /lib/x86_64-linux-gnu/libpcre.so.3
#14 0x000055a5669479c0 in pcre_get_compiled_regex_cache ()
#15 0x000055a5669491d6 in ?? ()
#16 0x00007f842a969675 in xdebug_execute_internal (current_execute_data=0x7f842b013510, return_value=0x7f842b0134d0) at /tmp/pear/temp/xdebug/xdebug.c:2202
#17 0x000055a566cad0e0 in ?? ()
#18 0x000055a566c6822b in execute_ex ()
#19 0x00007f842a968b46 in xdebug_execute_ex (execute_data=0x7f842b013290) at /tmp/pear/temp/xdebug/xdebug.c:2050
#20 0x00007f842ae47f88 in ?? () from /usr/local/ioncube/ioncube_loader_lin_7.0.so
#21 0x000055a566cad20d in ?? ()
#22 0x000055a566c6822b in execute_ex ()
#23 0x00007f842a968b46 in xdebug_execute_ex (execute_data=0x7f842b013200) at /tmp/pear/temp/xdebug/xdebug.c:2050
#24 0x00007f842ae47f88 in ?? () from /usr/local/ioncube/ioncube_loader_lin_7.0.so
#25 0x000055a566cad20d in ?? ()
#26 0x000055a566c6822b in execute_ex ()
#27 0x00007f842a968b46 in xdebug_execute_ex (execute_data=0x7f842b013150) at /tmp/pear/temp/xdebug/xdebug.c:2050
---Type return> to continue, or q return>return> to quit---
#28 0x00007f842ae47f88 in ?? () from /usr/local/ioncube/ioncube_loader_lin_7.0.so
#29 0x000055a566cad20d in ?? ()
#30 0x000055a566c6822b in execute_ex ()
#31 0x00007f842a968b46 in xdebug_execute_ex (execute_data=0x7f842b0130b0) at /tmp/pear/temp/xdebug/xdebug.c:2050
#32 0x00007f842ae47f88 in ?? () from /usr/local/ioncube/ioncube_loader_lin_7.0.so
#33 0x000055a566cb995c in ?? ()
#34 0x000055a566c6822b in execute_ex ()
#35 0x00007f842a968b46 in xdebug_execute_ex (execute_data=0x7f842b013030) at /tmp/pear/temp/xdebug/xdebug.c:2050
#36 0x00007f842ae47f88 in ?? () from /usr/local/ioncube/ioncube_loader_lin_7.0.so
#37 0x000055a566cbcfc7 in zend_execute ()
#38 0x000055a566c27ed3 in zend_execute_scripts ()
#39 0x000055a566bc7570 in php_execute_script ()
#40 0x000055a566907b43 in ?? ()
#41 0x00007f842e9b7b45 in __libc_start_main (main=0x55a566906d40, argc=1, argv=0x7ffc0d969708, init=, fini=,
    rtld_fini=, stack_end=0x7ffc0d9696f8) at libc-start.c:287
#42 0x000055a56690898d in _start ()
(gdb)
return>
Code language: PHP (php)
A quick Google search for ioncube and php brings us to ioncube.com. Ideally we would like to see the source code for ioncube and fix the issue but since this is a commercial extension available in binary only we can only try to disable it. Let's disable the ioncube plugin in PHP, restart the container docker restart s1_php_1 and check the result again (note the PID of PHP process changed after the restart go the PHP container):
sysdig -s 2000 -A evt.type!=brk and proc.pid=18496 -p "%proc.vmrss"
No more leak!
36924
36924
36924
36924
36924
36924
36924
Conclusion
Troubleshooting has always been an art and not a science. With containers even the most brilliant artists need new tools and materials to make sure their creations can be shared with the world.
Limits in container resources usage would have prevented this memory leak from affecting other containers in the same host, we encourage to use those when possible.
For full visibility into what is actually going on inside your containers pick up the right tools. Sysdig Monitor and Sysdig open-source is a great combo to understand what's happening inside your containers. Want to see this yourself? Get started with Sysdig open-source with this web course and sign-up for a 14 days Sysdig Monitor free trial.