


Falco Feeds extends the power of Falco by giving open source-focused companies access to expert-written rules that are continuously updated as new threats are discovered.

We're excited to see that DC/OS platform has gone open source. What's more we're fortunate enough to have been invited along for the ride! This post will give you a short overview of what's happening, why it matters, and how Sysdig is involved.
\r\r
What is DC/OS?
\r\r
DC/OS (Data Center Operating System) was originally created by Mesosphere. It takes two key open source projects, Mesos and Marathon, and enables you to abstract away distributed resources into one "pool" of memory, compute, and disk. DC/OS bundles additional services such as mesos-dns, tooling like a CLI, a GUI, a repository for the packages that you want to run, and frameworks like Marathon (a.k.a. distributed init), Chronos (a.k.a. distributed cron), and more. The end result is a simple, packaged way to run complex distributed applications with or without containers.
\r\r
\r\r
*All the power of DC/OS, now open source! *
\r\r
Why does it matter?
\r\r
As most of you know we're currently amidst a major platform shift – the move from virtual machines to containers will allow organizations to deliver more functionality, faster. Projects like DC/OS matter because they simplify the process of getting an environment running that can effectively manage and enable containers in the first place. In short, containers are great, but only if you have something like DC/OS to take your containers into production.
\r\r
But you've still got to monitor it all!
\r\r
It was just a couple weeks back that Sysdig announced its formal partnership with Mesosphere, and more importantly, our technical integration with Mesos, Marathon, and DC/OS.
\r\r
And because the open sourced DC/OS is full-featured DC/OS, our integration works exactly the same across our open source and commercial products. The link above has an example of deep troubleshooting… instead of recreating that I'll provide a "getting started" example.
\r\r
Visualizing DC/OS at Work
\r\r
Deploying applications with DC/OS is a totally new paradigm, so it can be challenging to wrap your head around what exactly the platform is doing. How is it allocating resources? Where is your application actually running?
\r\r
Let's suppose you're deploying a few applications on top of DC/OS and you'd like to understand: * What are the applications? * What resources are they using? * How are they performing?
\r\r
Enter Sysdig Cloud.It provides real-time topology mapping that allows you to automatically visualize the physical resources at work. You simply use our one-line command to deploy the Sysdig agent. No additional Sysdig Cloud agent configuration is required when the Mesos master is installed with default settings on the nodes where the Mesos API server runs ("Master" nodes). The Sysdig Cloud agent will look for the process named "mesos-master". If the process is found at any time, our agent will automatically connect to the local Mesos and Marathon (if available) API servers, to collect cluster configuration and current state metadata in addition to host metrics.
\r\r
OK, so point-and-click, you've pushed out your applications on DC/OS.
\r\r
\r\r
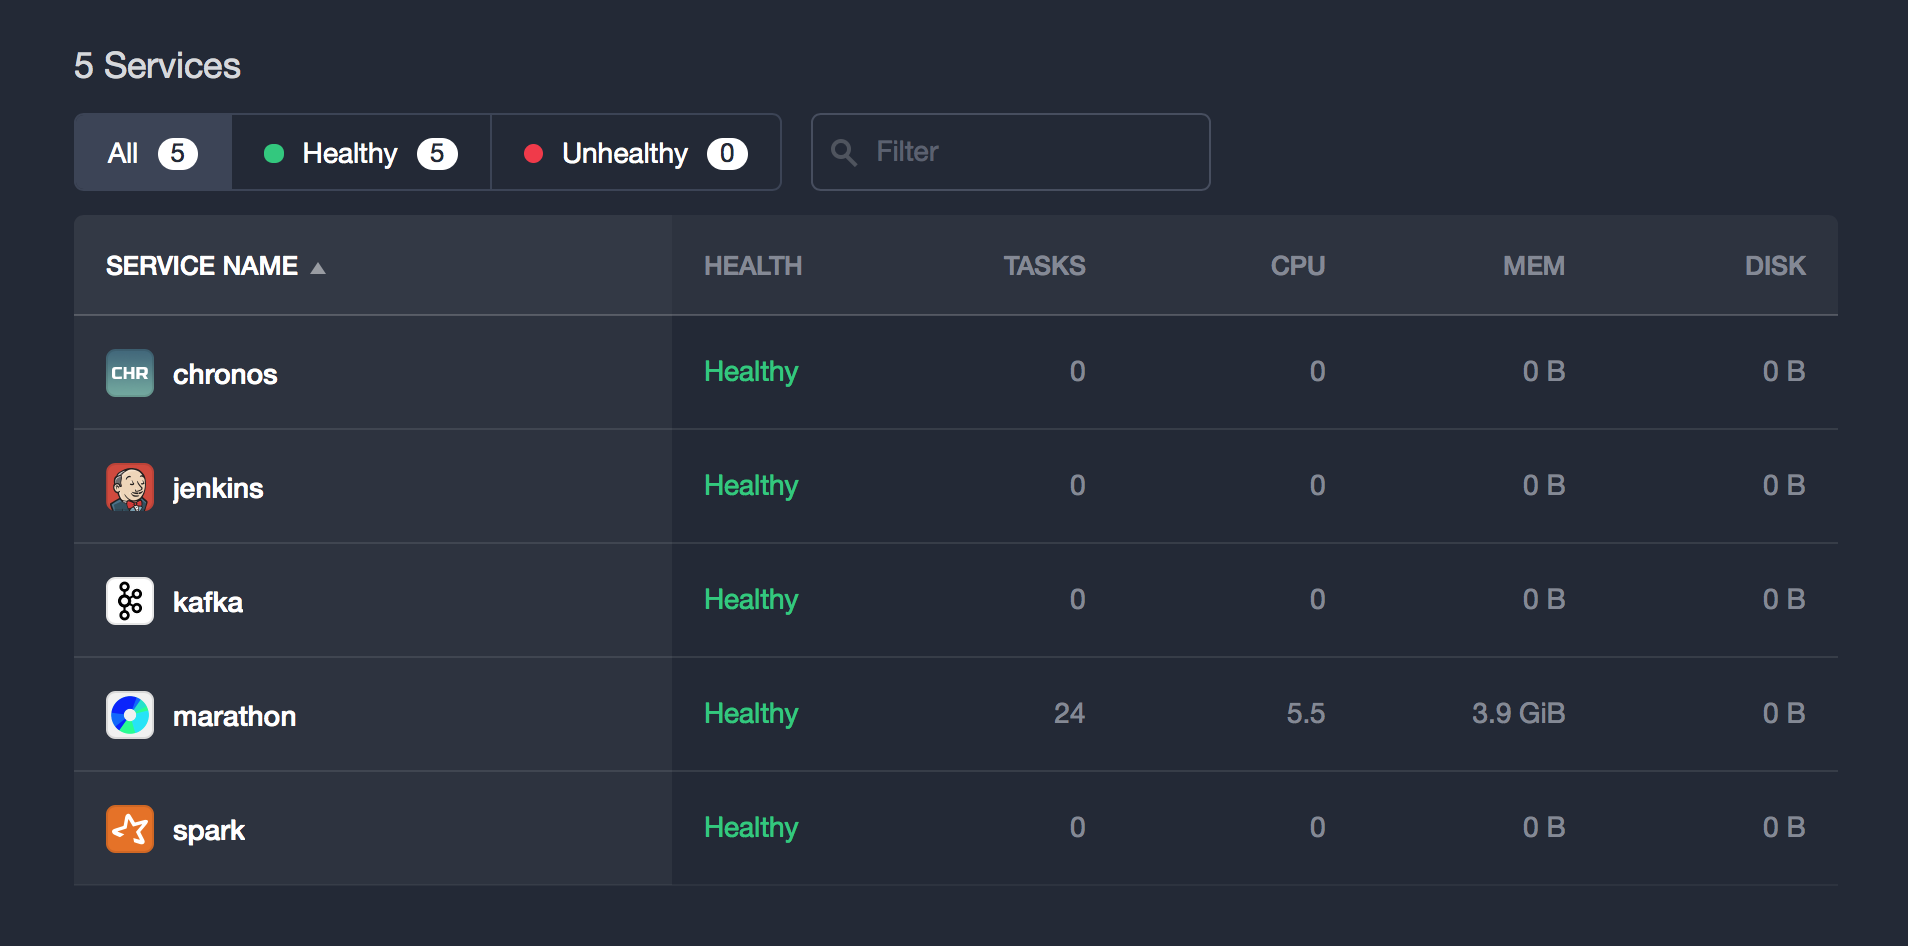
Services view within DC/OS
\r\r
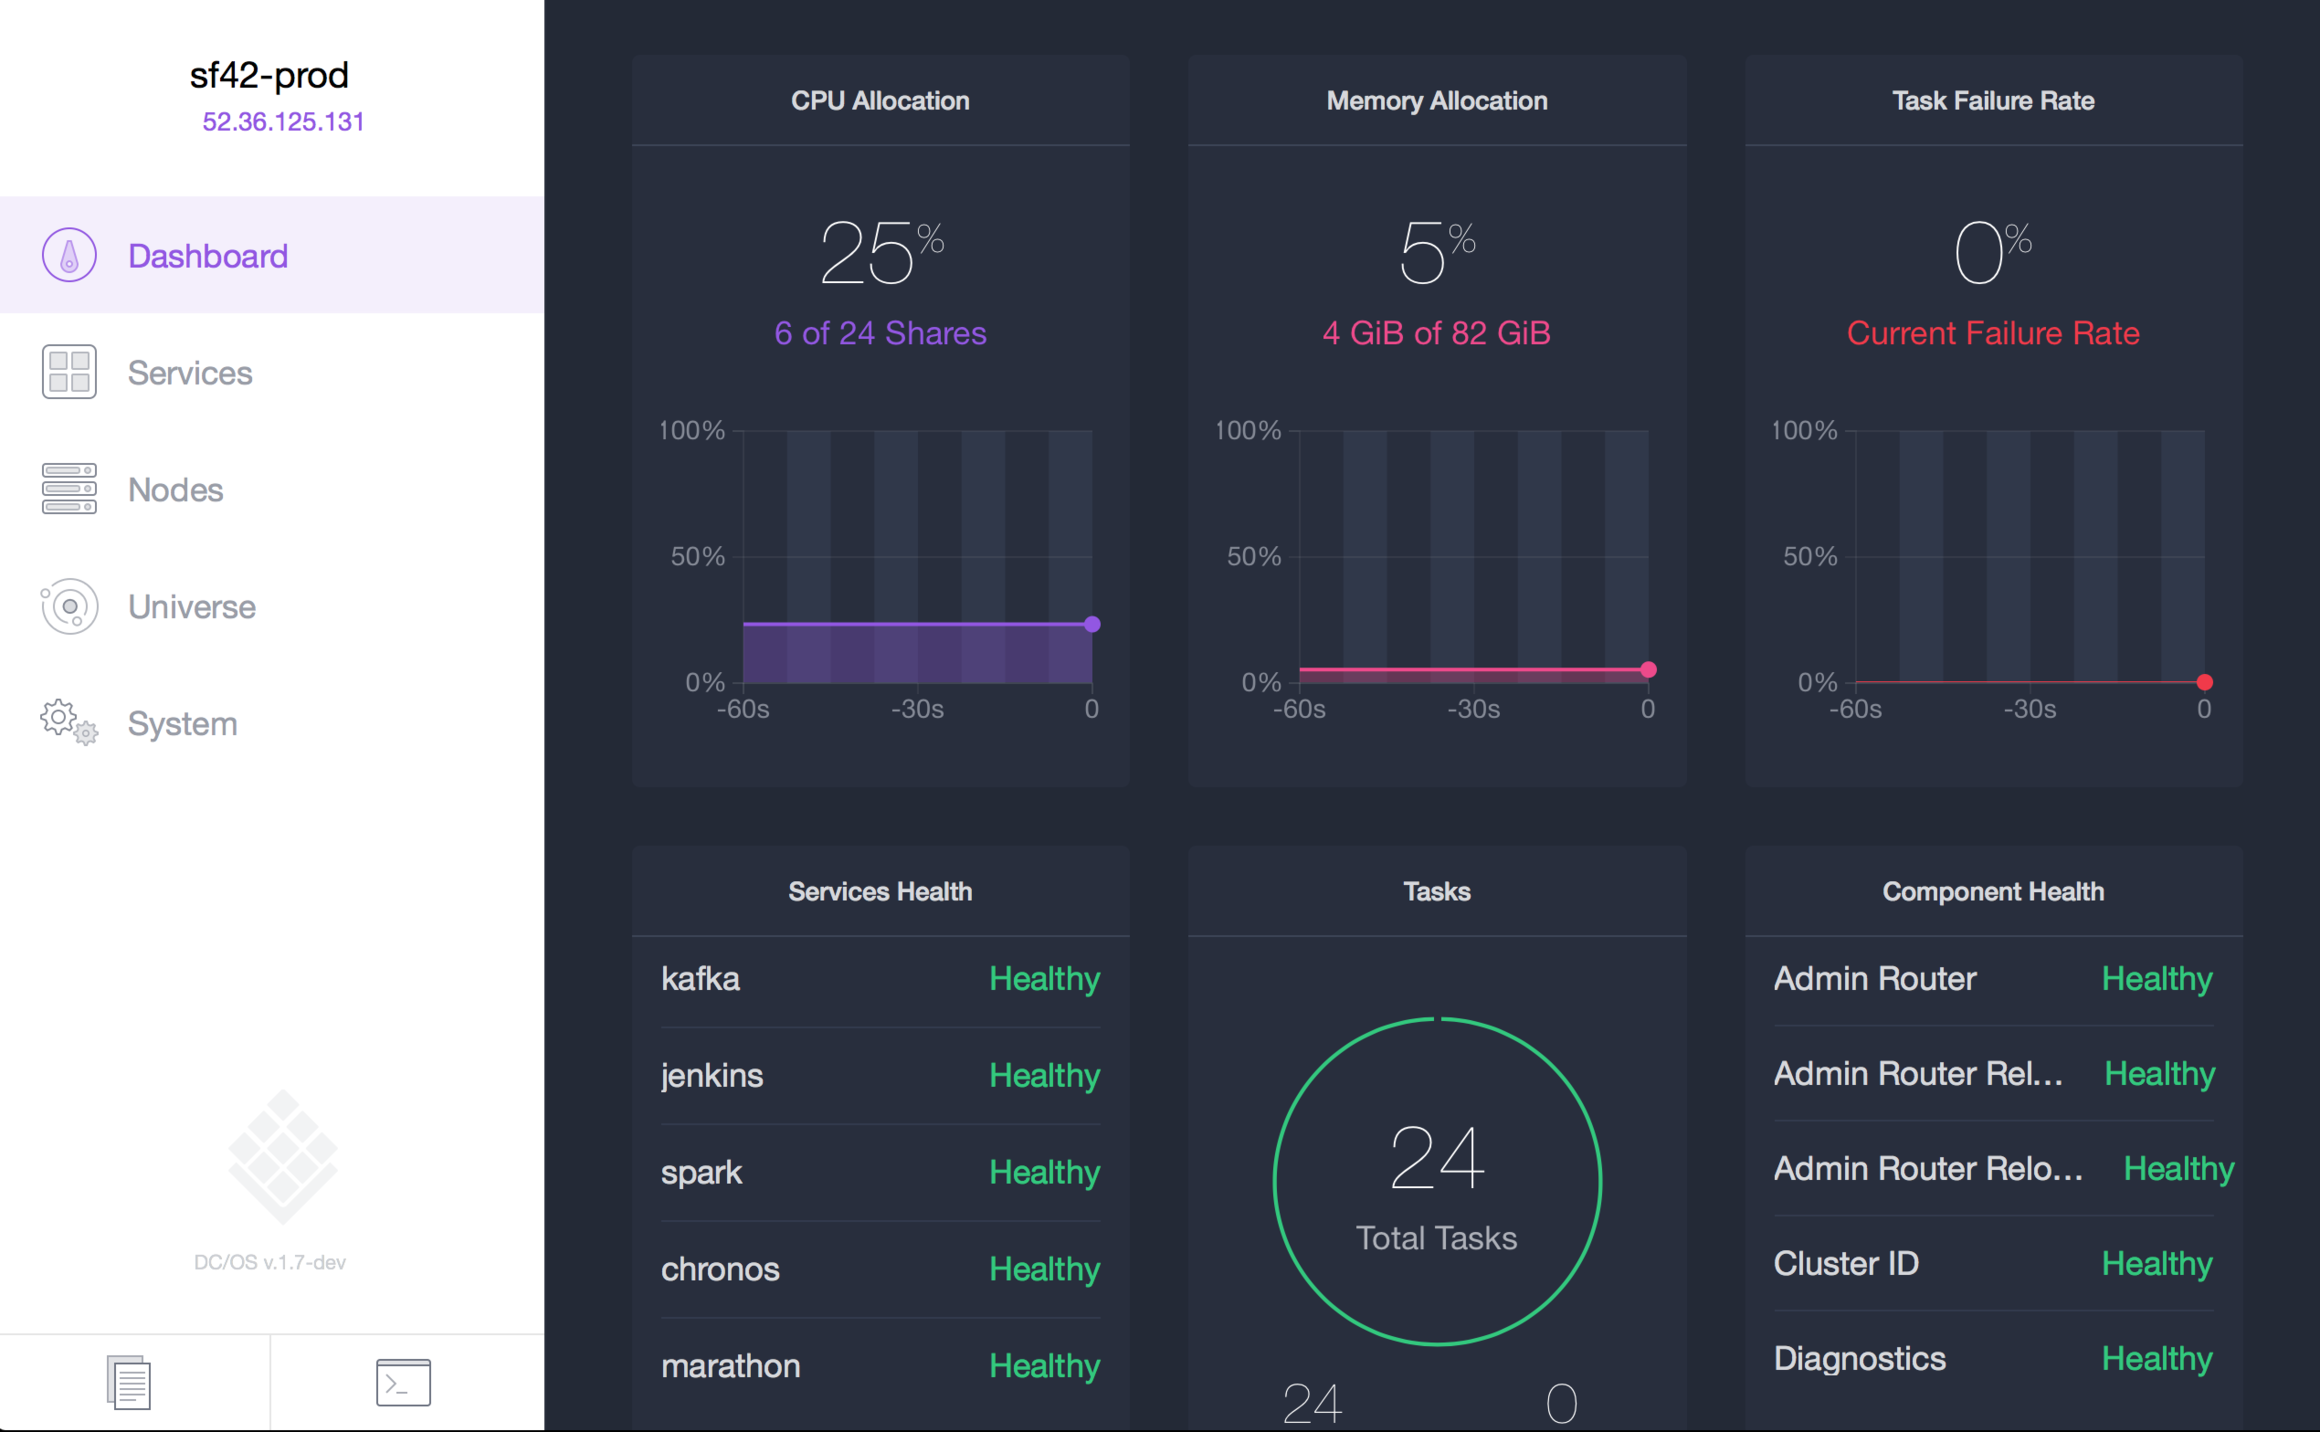
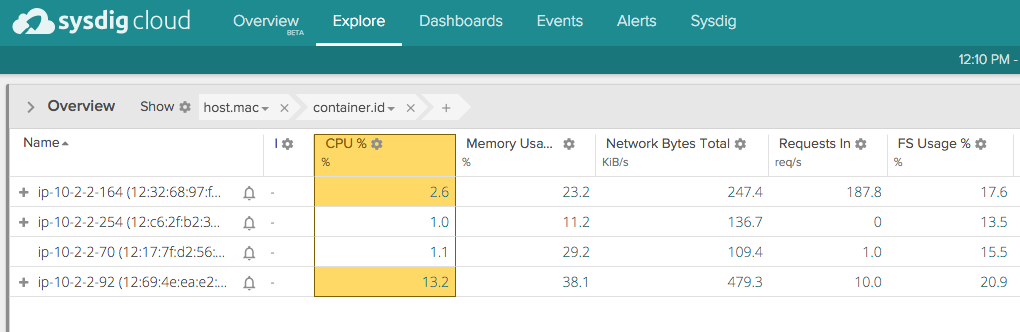
Assuming you've instrumented the hosts running DC/OS, you can get a view like this which tells you how the machines are doing from an infrastructure perspective:
\r\r
\r\r
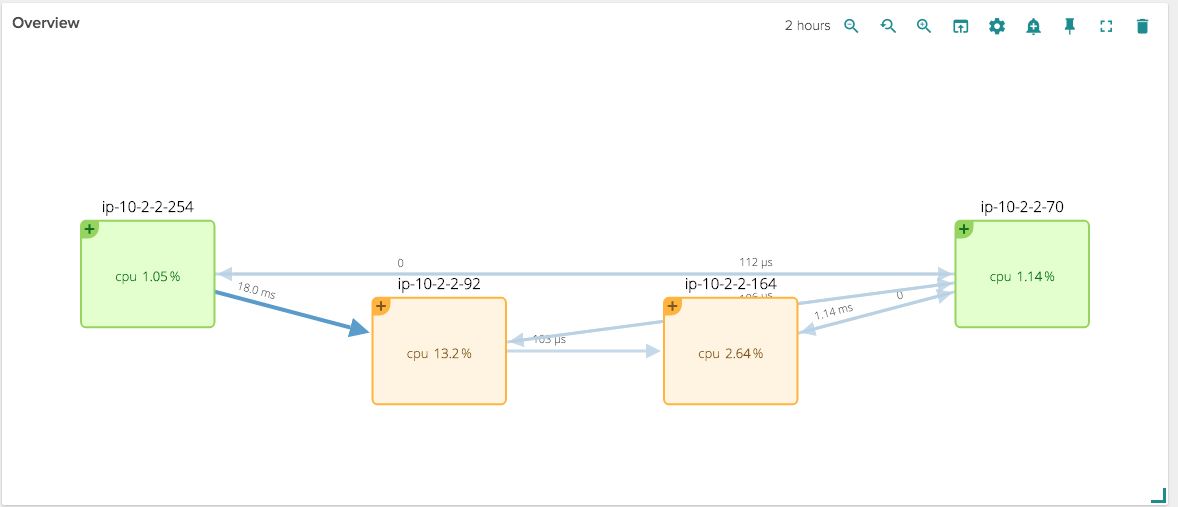
Nothing too unusual (or insightful) here… this is just straight infrastructure monitoring. But let's start to look at relationships of these hosts in a topology:
\r\r
\r\r
OK, so this is slightly more interesting. We can see communication between the hosts, request times, and resource usage of the machines themselves all in one place. But how does this relate to your app? And what is DC/OS doing as a part of this? Let's drill down into these hosts…
\r\r
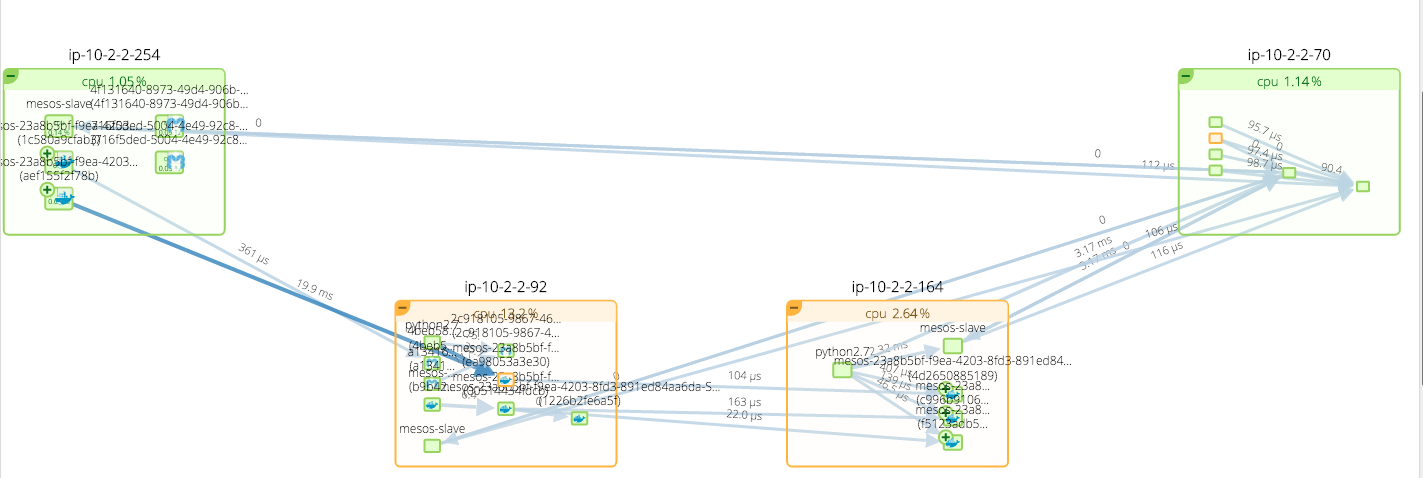
\r\r
And we see small boxes that each represent a container running its own software… it's spaghetti! And that's a good thing, it means DC/OS is doing its job. DC/OS is distributing containers across machines in a way that makes the optimal use of underlying resources.
\r\r
As we mentioned, Sysdig also integrates with the master to collect metadata about your system. We use that data to take physical data, like what you're seeing above, and create logical picture of what your apps are doing. When you apply the metadata, you get this:
\r\r
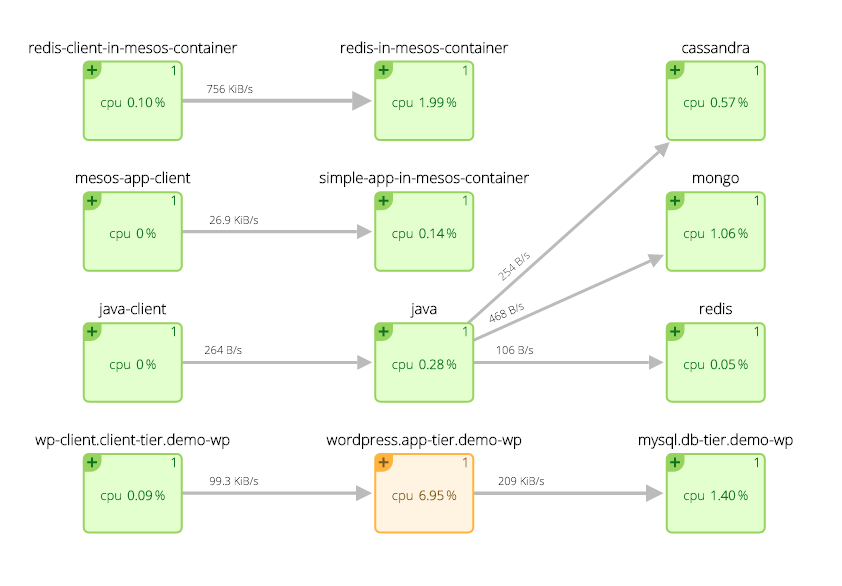
\r\r
OK, now we're cooking. We can see a few applications, as well as the relationships between their components, as well as the resources they are using. While the combination of physical and logical topology is especially useful for troubleshooting, it's also a huge help in understanding the basics of how DC/OS works in the first place.
\r\r
Just the beginning…
\r\r
Deploying a containerized application is just a step in your overall process from conceptualizing an application all the way through running it in production. DC/OS makes it simple to get those apps running, and Sysdig is very happy to partner with the DC/OS team to make monitoring just as simple. While in this post we focused on visualizing how an application is deployed on DC/OS, our next post will focus on what your application is doing and how you can troubleshoot it more effectively. Stay tuned!