


Falco Feeds extends the power of Falco by giving open source-focused companies access to expert-written rules that are continuously updated as new threats are discovered.

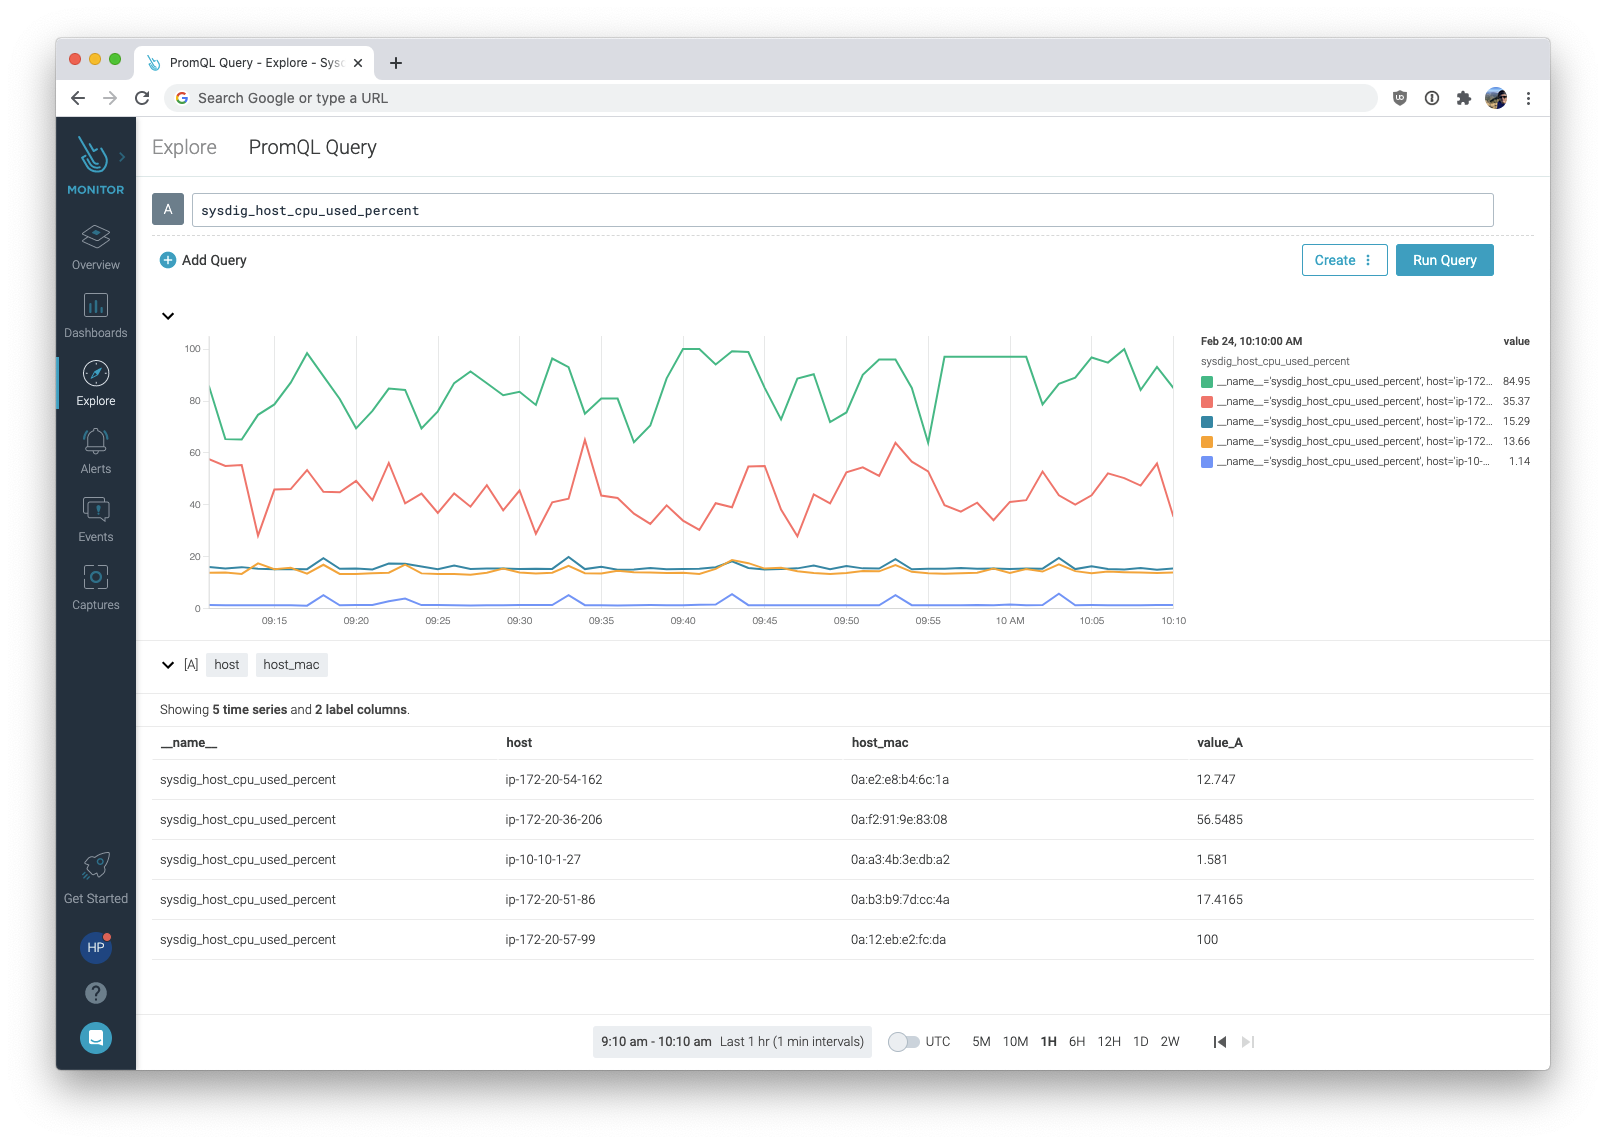
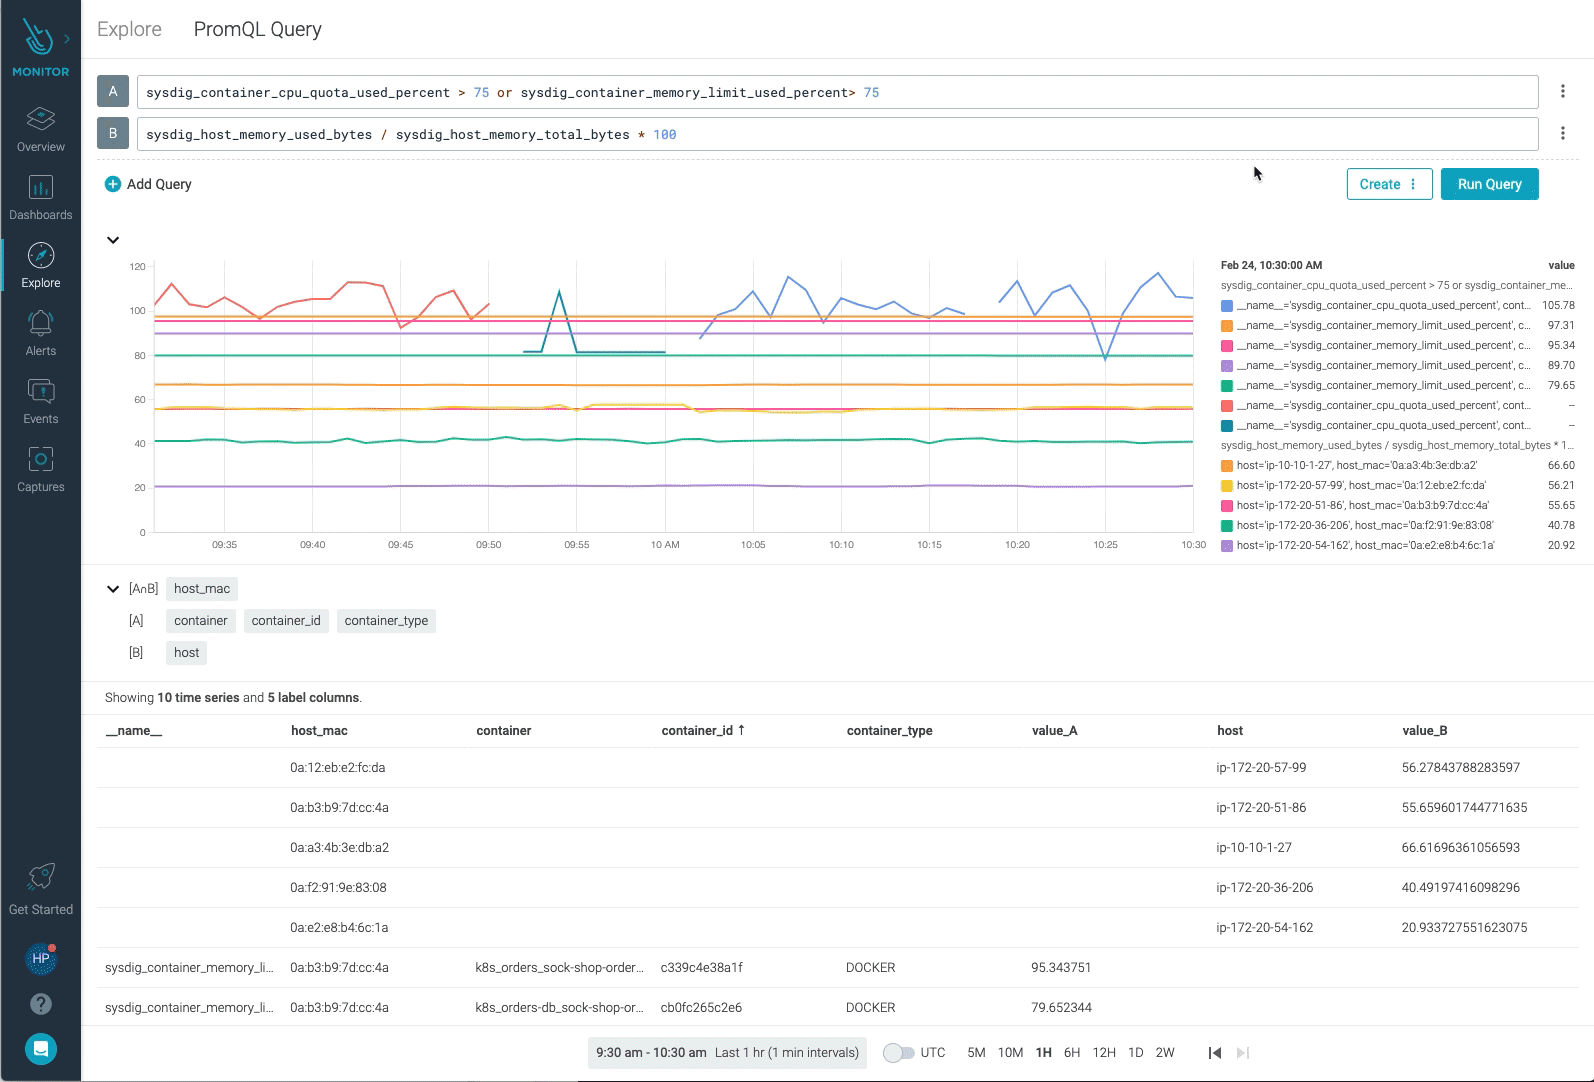
We are announcing the new PromQL Explorer for Sysdig Monitor that will help you easily understand your monitor data.The new PromQL Explorer allows you to write PromQL queries faster by automatically identifying the common labels among different metrics. It also allows you to interactively modify the PromQL results by using the visual label filtering
It’s all about labels
Sysdig’s native compatibility with Prometheus monitoring makes it possible to use the powerful query language, PromQL, in Sysdig Dashboards & Alerts. It can query metrics by leveraging advanced functions, operators, and boolean logic.
Prometheus stores each time series identified by its metric name and key-value pairs (labels):
<metric name>{<label name>=<label value>, ...}For example, a metric tracking HTTP requests by different labels may have the following time series:
http_requests_total{status_code="200", method="get", handler="/users"}
http_requests_total{status_code="200", method="post", handler="/order"}
http_requests_total{status_code="500", method="post", handler="/order"}
That allows you to filter those HTTP requests, enabling queries like “give me the requests with a 200 OK response for the handler /users “.
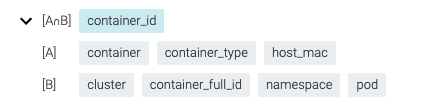
Labels are a fundamental element for the Prometheus data-model as, with PromQL, you can filter and aggregate based on not only metrics, but also labels. To do this effectively, you need to know every label for each metric you’re trying to combine to write a PromQL query. This is because two metrics having different labels can only be combined if you explicitly choose the labels that the metrics have in common.
PromQL Explorer to the rescue
We’re excited to announce the PromQL Explorer, a new feature in Sysdig Monitor to query metrics using PromQL, understand the labels and values, and create queries faster before using them in Dashboards & Alerts.
PromQL can be used not only with metrics collected from Prometheus endpoints, but also with Sysdig native metrics collected by the agent.
Using label filtering helps you visualize the common labels between metrics, which is key when combining multiple metrics.
And more exciting things coming up
Over the next few weeks, Sysdig will be introducing new features that will help you write PromQL queries even faster.
By combining our unique ServiceVision™ capability with PromQL, Sysdig will automatically enrich your metrics with Kubernetes and application context without needing to instrument additional labels in your environment. This reduces operational complexity and cost since the enrichment takes place in our metric ingestion pipeline after time series have been sent to our backend.
Thus, you could go from this query:
sum by (cluster,owner_name) (sum by (cluster,namespace,pod) (sysdig_container_cpu_cores_used * on (container_id) group_right kube_pod_container_info) * on (cluster,namespace,pod) group_right kube_pod_owner{owner_kind="Node"}) / on (cluster, owner_name) group_left label_replace(kube_node_status_capacity_cpu_cores, "owner_name", "$1", "node", "(.*)") * 100To the following one, which is much simpler:
sum by (kube_cluster_name,kube_node_name) (sysdig_container_cpu_cores_used) * 100PromQL queries will be simplified with ServiceVision™, making it much easier to filter or aggregate metrics by Kubernetes context.
Want to get your hands dirty?
We’re starting to roll out the PromQL Explorer to users of our hosted SaaS service, and self-hosted customers will have access later in the year. You’ll find PromQL Explore under the Explore tab in the Sysdig Monitor toolbar.
We welcome your feedback and would love to learn more about the queries you create. Reach out to us anytime.
Sysdig Monitor helps you gain visibility into your infrastructure, enriching your metrics with Kubernetes and application context. You’ll be set up in just a few minutes. Request your free trial today!