Introduction
Containers are becoming increasingly popular as building blocks for deploying applications. The benefits of containerization have been widely discussed: faster deployments, reproducibility of environments, cost optimizations, isolation, and flexibility in general.
But there is a catch: monitoring and troubleshooting is exponentially more complex when it comes to containers. Containers are designed to run programs in an isolated context, and that means that they tend to be opaque environments. As a consequence, many common Linux tools – the same visibility tools we’ve all been using for decades – are now failing to perform as expected. We’re suddenly flying blind.
Last year the sysdig team started experimenting with containers in earnest. We had a hunch that sysdig’s core technology is actually perfectly suited for container-level visibility. I’ll get into sysdig’s architecture in a bit, but the key is around being able to see into containers
from the outside. Well, we’ve now spent months enhancing sysdig to add built-in container awareness, and it appears our original hunch was correct ;)
It is my great pleasure to announce that, as of today, we are no longer flying blind.
In this post I’ll walk through the current state of the art for visibility in containerized environments. I’ve broken the post out into different areas – CPU, network, and disk I/O – that we’ll explore together using an actual containerized environment as an example. Using this environment, I’ll briefly show what you can (or cannot!) do with today’s command line tools, and what can be done with sysdig. We close the post with a couple of “bonus” tricks that can make you a container hero, like spying on the commands executed inside a container or isolating the full communications between two containers.
Ok, let’s get into it!
Setup
The setup that we’re using for this blog post is a multi-tier WordPress infrastructure based on Docker. We chose Docker because it’s popular and because it makes it easy to set up a container-based environment. But keep in mind that sysdig supports other container environments, like LXC, as well. With docker.io installed, our test environment is brought up with:
$ sudo docker run --name mysql -e MYSQL_ROOT_PASSWORD='password' -d mysql
$ sudo docker run --name wordpress1 --link mysql:mysql -d wordpress
$ sudo docker run --name wordpress2 --link mysql:mysql -d wordpress
$ sudo docker run --name wordpress3 --link mysql:mysql -d wordpress
$ sudo docker run --name wordpress4 --link mysql:mysql -d wordpress
$ sudo docker run --name haproxy -p 80:80 --link wordpress1:wordpress1 --link wordpress2:wordpress2 --link wordpress3:wordpress3 --link wordpress4:wordpress4 -d tutum/haproxy
The environment has a MySQL database, a pool of Apache web servers running WordPress, and a reverse proxy (haproxy) to provide a single entry point to the web application.
State of the Art: Container CPU Visibility
Processes running inside containers share the kernel with the host operating system. This means that you can see them, and their resource usage, by using a tool like ps on the host OS:
$ ps aux
...
USER       PID %CPU %MEM    VSZ   RSS TTY      STAT START   TIME COMMAND
root         1  0.0  0.0  33896  3240 ?        Ss   09:37   0:01 /sbin/init
root         2  0.0  0.0      0     0 ?        S    09:37   0:00 [kthreadd]
root         3  0.0  0.0      0     0 ?        S    09:37   0:00 [ksoftirqd/0]
...
root       357  0.0  0.0  23664  1444 ?        Ss   09:37   0:00 /sbin/cgmanager --sigstop -m name=systemd
root       391  0.0  0.0  19476   648 ?        S    09:37   0:00 upstart-udev-bridge --daemon
root       397  0.0  0.0  51744  1968 ?        Ss   09:37   0:00 /lib/systemd/systemd-udevd --daemon
...
999       1807  0.2 11.4 867624 464572 ?       Ssl  09:38   0:21 mysqld
...
rtkit     2502  0.0  0.0 168916  1308 ?        SNl  09:38   0:00 /usr/lib/rtkit/rtkit-daemon
www-data  2503  0.0  0.1 175440  6628 ?        S    09:38   0:00 apache2 -DFOREGROUND
www-data  2504  0.0  0.1 175472  6756 ?        S    09:38   0:00 apache2 -DFOREGROUND
root     29234  0.0  0.0  43188  1600 ?        Ss   Feb14   0:00 [lxc monitor] /usr/local/var/lib/lxc test
This returns all of the normal information that we would expect. However, there are two big issues:
- There is no way to know which container a process belongs to, which leaves us with a messy list of processes with similar names whose relationship is impossible to understand.
- There is no way to know the internal PID (i.e. the PID that the process has inside the container). ps sees the external PID that is assigned to the process outside its namespaces. This tends to be an issue when troubleshooting, because a process will write its internal PID, not the external one shown by ps, into configuration files and logs.
The first issue can be overcome by asking ps to spit out the process cgroups:
$ ps -eo user,pid,%cpu,%mem,vsize,rss,tty,stat,start_time,time,ucmd,cgroup
...
USER       PID %CPU %MEM    VSZ   RSS TT       STAT START     TIME CMD             CGROUP
root         1  0.0  0.0  33896  3240 ?        Ss   09:37 00:00:01 init            -
...
www-data  2504  0.0  0.1 175472  6756 ?        S    09:38 00:00:00 apache2         9:perf_event:/docker/61e76d2c39121282474ff895b9b3ba2addd775cdea6d2ba89ce76c2862f36148,8:blkio:/docker/61e76d2c39121282474ff895b9b3ba2addd775cdea6d2ba89ce76c2862f36148,7:freezer:/docker/61e76d2c39121282474ff895b9b3ba2addd775cdea6d2ba89c
...
root     29609  0.0  0.0  49272  1356 ?        Ss   Feb14 00:00:00 systemd-udevd   11:hugetlb:/lxc/test,10:perf_event:/lxc/test,9:blkio:/lxc/test,8:freezer:/lxc/test,7:devices:/lxc/test,6:memory:/lxc/test,5:cpuacct:/lxc/test,4:cpu:/lxc/test,3:name=systemd:/lxc/test,2:cpuset:/lxc/test
The long piece of text under CGROUP does actually identify the container for each process. But I think you’ll agree with me that, in this form, this information is hardly useful for anything. Similar tools like top and htop have exactly the same limitations: no container context other than the full cgroup string, and no internal PID.
Container runtime environments like Docker try to solve this problem with specialized custom tools. For example, docker top gives us the list of processes running inside a Docker container:
docker top mysql aux
USER                PID                 %CPU                %MEM                VSZ                 RSS                 TTY                 STAT                START               TIME                COMMAND
mysql               42959               10.6                5.5                 793136              457480              ?                   Ssl                 13:58               0:13                mysqld --init-file=/tmp/mysql-first-time.sql
This is a big step in the right direction, but the interface is a pretty rudimentary ps-like one, and a bunch of information (e.g. the internal PID) is still not exported. Moreover, this works with Docker only, and doesn’t cover other container runtimes like LXC.
One more option that we have, of course, is running ps, top or htop from inside a container. This works, and shows us the correct internal PIDs. However, as anyone familiar with containers knows, this is far from ideal:
- It requires installing additional packages in every container.
- It requires connecting or attaching to the container, which is not always trivial.
- It is limited to a single container at a time.
The conclusion: looks like we’re still lacking a tool that works from outside containers, supports multiple container technologies, and offers the big picture while also showing the details.
Enter sysdig.
Container CPU Visibility with Sysdig
Before diving in, let me give a quick overview of how sysdig’s container support works at the architecture level. As the picture below shows, containers share the kernel among each other and with the host operating system.
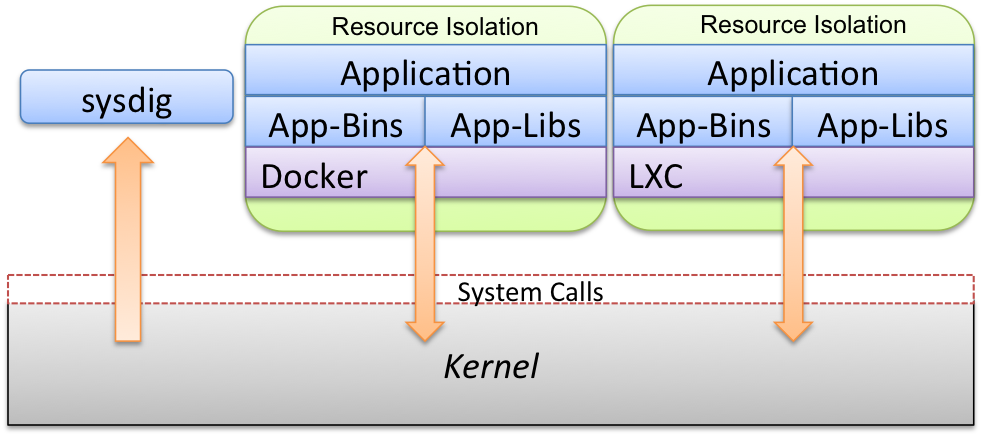
Sysdig’s instrumentation technology consists of a small kernel module that can capture the interaction between the kernel and each of the containers. Sysdig can then consume the resulting stream of events,
from the host OS or from another container. The second option is useful in environments like CoreOS, where applications are not allowed to run outside containers.
The latest sysdig release adds awareness of cgroups and namespaces to sysdig. This means that all the
sysdig goodness you’ve learned to love is now capable of understanding containers.
Let’s start with the basics.
The lscontainers chisel can be used to check what’s running on your system (if you don’t know what a sysdig chisel is, read
this):
$ sudo sysdig -c lscontainers
container.type container.image container.name      container.id
-------------- --------------- ------------------- ------------
docker         tutum/haproxy   haproxy             49a74cb89f61
docker         wordpress       wordpress4          2717b1ef6a6c
docker         wordpress       wordpress3          77833de66904
docker         wordpress       wordpress2          9bcff18fc4b4
lxc                            test                test
docker         wordpress       wordpress1          0c34fe20f1fd
docker         mysql           mysql               a0188c8bbf51
This shows any type of container, so it’s a bit like
docker ps and
lxc-ls combined. As a next step, we can take a look at the total CPU usage of each running container:
$ sudo sysdig -c topcontainers_cpu
CPU%            container.name
-----------------------------------------------------------------------
90.13%          mysql
15.93%          wordpress1
7.27%           haproxy
3.46%           wordpress2
...
This tells us which containers are consuming the machine’s CPU. What if we want to observe the CPU usage of a single process, but don’t know which container the process belongs to? Before answering this question, let me introduce the
-pc (or
-pcontainer) command line switch. This switch tells sysdig that we are requesting container context in the output.
For instance, sysdig offers a chisel called
topprocs_cpu, that we can use to see the top processes in terms of CPU usage. Invoking this chisel in conjunction with
-pc will add information about which container each process belongs to.
$ sudo sysdig -pc -c topprocs_cpu
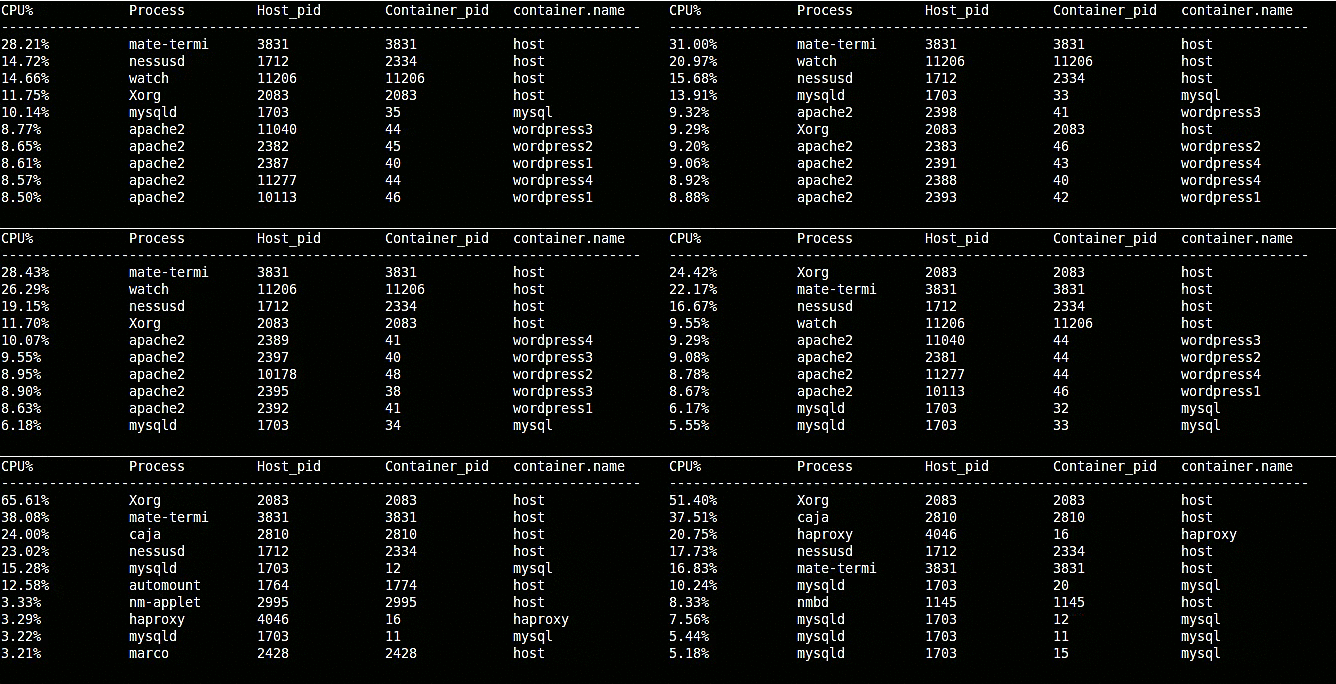
As you can see, this includes details such as both the external and the internal PID and the container name.
Keep in mind:
-pc will add container context to many of the command lines that you use, including the vanilla sysdig output.
What if we want to zoom into a single container and only see the processes running inside it? It’s just a matter of using the same
topprocs_cpu chisel, but this time with a
filter:
$ sudo sysdig -pc -c topprocs_cpu container.name=client
CPU%            Process         container.name
----------------------------------------------
02.69%         bash            client
31.04%         curl            client
0.74%          sleep           client
Compared to
docker top and friends, this filtering functionality
gives us the flexibility to decide which containers we see. For example, this command line shows processes from all of the wordpress containers:
$ sudo sysdig -pc -c topprocs_cpu container.name contains wordpress
CPU%            Process         container.name
--------------------------------------------------
6.38%          apache2         wordpress3
7.37%          apache2         wordpress2
5.89%          apache2         wordpress4
6.96%          apache2         wordpress1
So to recap, we can:
- See every process running in each container including internal and external PIDs
- Dig down into individual containers
- Filter to any set of containers using simple, intuitive filters
…
all without installing a single thing inside each container. Now let’s move on to the network, where things get even more interesting.
State of the Art: Container Network Visibility
Honestly, there’s just not much here. Containers are similar to type-2 hypervisors: they are configured with their own network interface and private network. Which means: unless you log into the container, you’re essentially out of luck. netstat, iftop or even lsof won’t show anything when used from the host or from another container. Same with tcpdump and Wireshark. So your options are:
- Use docker stats, available in the most recent versions of Docker. One of the columns it exports is the amount of network traffic that the container is generating. Of course, this won’t work with other container runtimes.
- Attach to the container or log into it with ssh. This involves making sure that the container includes one of these tools, and limits the perspective to the connections of one single container. If you do need to capture a network trace from inside a container, I recommend using tcpdump (which is much smaller to install than Wireshark) and then moving the trace file out of the container for analysis.
Container Network Visibility with Sysdig
Let’s start by looking at network utilization by container:
$ sudo sysdig -pc -c topcontainers_net
Bytes           container.name
------------------------------------------
8.48KB          mysql
5.30KB          haproxy
4.27KB          wordpress3
2.24KB          wordpress4
2.13KB          wordpress2
2.13KB          wordpress1
2.12KB          client
This gives us a nice overview of which containers are consuming the most network bandwidth. We can also see network utilization broken up by process:
sudo sysdig -pc -c topprocs_net
Bytes        Process      Host_pid     Container_pid   container.name
---------------------------------------------------------------
72.06KB      haproxy      7385         13           haproxy
56.96KB      docker.io    1775         7039         host
44.45KB      mysqld       6995         91           mysql
44.45KB      mysqld       6995         99           mysql
29.36KB      apache2      7893         124          wordpress1
29.36KB      apache2      26895        126          wordpress4
29.36KB      apache2      26622        131          wordpress2
29.36KB      apache2      27935        132          wordpress3
29.36KB      apache2      27306        125          wordpress4
22.23KB      mysqld       6995         90           mysql
Note how this includes the internal PID and the container name of the processes that are causing most network activity, which is useful if we need to attach to the container to fix stuff. We can also see the top connections on this machine:
sudo sysdig -pc -c topconns
Bytes        container.name  Proto        Conn
--------------------------------------------------------------------------------
22.23KB      wordpress3     tcp         172.17.0.5:46955->172.17.0.2:3306
22.23KB      wordpress1     tcp         172.17.0.3:47244->172.17.0.2:3306
22.23KB      mysql          tcp         172.17.0.5:46971->172.17.0.2:3306
22.23KB      mysql          tcp         172.17.0.3:47244->172.17.0.2:3306
22.23KB      wordpress2     tcp         172.17.0.4:55780->172.17.0.2:3306
22.23KB      mysql          tcp         172.17.0.4:55780->172.17.0.2:3306
14.21KB      host           tcp         127.0.0.1:60149->127.0.0.1:80
The
-pc flag makes sysdig tell us which container each connection belongs to. The result is a bit like an iftop with container context. I want to stress how we’re able to see the connections of containers
without having to attach to them. And how this offers
a single pane of glass for all the connections in this machine, no matter which container they belong to. Of course, if we want to, we can narrow this down to a single container by using a filter:
sudo sysdig -pc -c topconns container name=mysq
Bytes        container.name  Proto        Conn
--------------------------------------------------------------------------------
22.23KB      mysql        tcp          172.17.0.5:46971->172.17.0.2:3306
22.23KB      mysql        tcp          172.17.0.3:47244->172.17.0.2:3306
22.23KB      mysql        tcp          172.17.0.4:55780->172.17.0.2:3306
A more sophisticated use of sysdig lets us go even deeper. For example, this will print all the new connections that the mysql container is receiving, in real time:
./sysdig -p"%fd.name" container.name=mysql and evt.type=accept
172.17.0.4:54167->172.17.0.2:3306
172.17.0.5:43257->172.17.0.2:3306
172.17.0.6:50011->172.17.0.2:3306
172.17.0.3:53488->172.17.0.2:3306
172.17.0.4:54179->172.17.0.2:3306
172.17.0.5:43269->172.17.0.2:3306
172.17.0.6:50023->172.17.0.2:3306
172.17.0.3:53500->172.17.0.2:3306
172.17.0.4:54191->172.17.0.2:3306
While this next example will show the data sent and received by the wordpress1 container on port 80:
$ sudo sysdig -A -cecho_fds container.name=wordpress1 and fd.port=80

------ Read 103B from   172.17.0.7:53430->172.17.0.3:80 (apache2)
GET / HTTP/1.1
User-Agent: curl/7.35.0
Host: 172.17.0.7
Accept: */*
X-Forwarded-For: 172.17.0.8


------ Write 346B to   172.17.0.7:53430->172.17.0.3:80 (apache2)
HTTP/1.1 302 Found
Date: Sat, 21 Feb 2015 00:23:37 GMT
Server: Apache/2.4.10 (Debian) PHP/5.6.6
X-Powered-By: PHP/5.6.6
Expires: Wed, 11 Jan 1984 05:00:00 GMT
Cache-Control: no-cache, must-revalidate, max-age=0
Pragma: no-cache
Location: http://172.17.0.7/wp-admin/install.php
Content-Length: 0
Content-Type: text/html; charset=UTF-8
We are observing the content of a specific connection, as it happens, from outside the container. How cool is that? :-)
State of the Art: Container Disk I/O Visibility
Similarly to network I/O, there’s just not much you can do to understand why the disk light is on in a containerized infrastructure. Tools like iotop are not container aware – just like with ps and top, you get a jumbled list of processes with no context of which container the processes are running in. And even
docker stats doesn’t currently export this kind of information. As a result, if you want to understand which of your containers are causing a lot of disk I/O, and especially why, your best option is instrumenting all of your containers and then attaching to each of them to run iotop, lsof, or other similar tools. This approach is, of course, time intensive and not very scalable.
Container Disk I/O Visibility with Sysdig
At this point, you should know the drill: this command line lets you see the top containers in terms of file I/O:
$ sudo sysdig -c topcontainers_file
Bytes           container.name
--------------------------------------------------------------------
6.79KB          mysql
4.11KB          haproxy
2.13KB          wordpress4
2.13KB          wordpress1
2.13KB          wordpress3
2.13KB          wordpress2
1.64KB          client
This command line shows the top processes in terms of file I/O, and tells you which container they belong to:
$ sudo sysdig -pc -c topprocs_file
Bytes           Process         Host_pid        Container_pid   container.name
--------------------------------------------------------------------------------
63.21KB         mysqld          11126           83              mysql
29.25KB         curl            47169           11400           client
29.25KB         curl            47167           11398           client
29.25KB         curl            47165           11396           client
2.07KB          docker          1746            11610           host
1.37KB          rs:main         959             963             host
832B            sleep           47170           11401           client
832B            sleep           47168           11399           client
832B            sleep           47166           11397           client
832B            sleep           47164           11395           client
This command line shows the top files in terms of file I/O, and tells you which container they belong to:
$ sudo sysdig -pc -c topfiles_bytes
Bytes           container.name  Filename
--------------------------------------------------------------------------------
63.21KB         mysql           /tmp/#sql_1_0.MYI
6.50KB          client          /lib/x86_64-linux-gnu/libc.so.6
3.25KB          client          /lib/x86_64-linux-gnu/libpthread.so.0
3.25KB          client          /lib/x86_64-linux-gnu/libgcrypt.so.11
3.25KB          client          /usr/lib/x86_64-linux-gnu/libwind.so.0
3.25KB          client          /usr/lib/x86_64-linux-gnu/libgssapi_krb5.so.2
3.25KB          client          /usr/lib/x86_64-linux-gnu/liblber-2.4.so.2
3.25KB          client          /lib/x86_64-linux-gnu/libssl.so.1.0.0
3.25KB          client          /usr/lib/x86_64-linux-gnu/libheimbase.so.1
3.25KB          client          /lib/x86_64-linux-gnu/libcrypt.so.1
Let me mention another couple of useful things concerning disk I/O that you can do with sysdig.
Number one: observing activity on a file with a given name, no matter which container the file belongs to. For example, this command line shows all the data that is written to /etc/passwd,
no matter which container this is happening in:
$ sudo sysdig -pc -c echo_fds "fd.name=/etc/passwd"

------ Read 956B from  [mysql] [7a19ca8a7555]  /etc/passwd (cat)
root:x:0:0:root:/root:/bin/bash.daemon:x:1:1:daemon:/usr/sbin:/usr/sbin/nologin.bin:x:2:2:bin:/bin:/usr/sbin/nologin.sys:x:3:3:sys:/dev:/usr/sbin/nologin.sync:x:4:65534:sync:/bin:/bin/sync.games:x:5:60:games:/usr/games:/usr/sbin/nologin.man:x:6:12:man:/var/cache/man:...
And sysdig is nice enough to tell us the name of the container and the process inside it that are performing the I/O operation.
Number two: the
famous sysdig spectrogram chisel now understands containers! Here’s how to produce the spectrogram of the file I/O activity of the mysql container:
$ sudo sysdig -c spectrogram fd.type=file and container.name=mysql
and here’s the result:
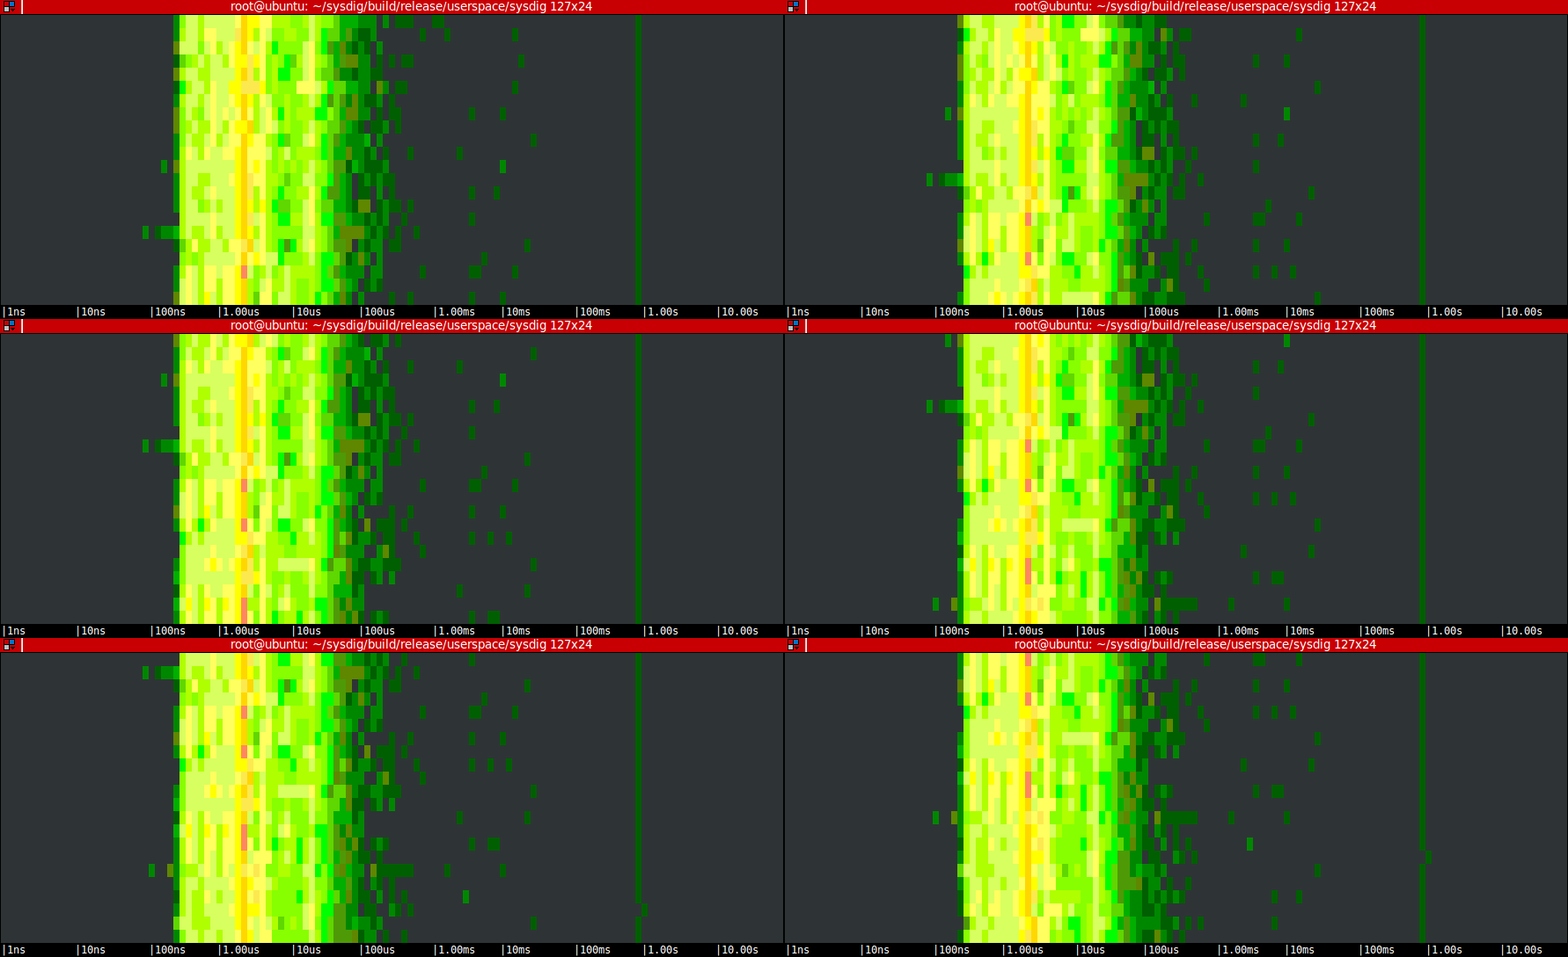
Remember, this works
from the host OS or from another container. Pretty powerful.
Sysdig Container Bonuses: User Tracking, Logs, and Request Flow Between Containers
Almost done! Thanks for sticking with me this far ;) I want to close this post with a few additional sysdig tricks that, hopefully, will make you more productive when managing containers.
1. Observing User Activity Inside a Container
For an attacker, a container is just another target machine. As a consequence, detecting suspicious activity and rogue processes inside containers is as important as it is for physical and virtual machines. Fortunately, sysdig can help. In particular, the spy_users chisel captures every command that is executed in the system, inside or outside a container, and prints it on screen:
$ sudo sysdig# ./sysdig -pc -c spy_users
43760 13:35:18 root@client) sleep 0.1
43760 13:35:18 root@client) curl 172.17.0.7
43760 13:35:18 root@client) sleep 0.1
43760 13:35:18 root@client) curl 172.17.0.7
43760 13:35:19 root@client) sleep 0.1
43760 13:35:19 root@client) curl 172.17.0.7
43760 13:35:19 root@client) sleep 0.1
Note how the user and container name are printed for every command line. You can of course narrow this down to the commands executed inside a specific container – it’s just a matter of using a filter:
$ sudo sysdig# ./sysdig -pc -c spy_users container.name=mysql
2. Tailing Logs from Multiple Containers
The Docker guidelines suggest that containerized apps write their logs to stdout, so that
docker logs can be used to watch the logs generated by a container. Sometimes, however, you will be stuck with a non compliant app that writes its logs somewhere in the file system. Would you like to see those logs without having to attach to the container? Use this command line:
$ sudo sysdig -pc -cspy_logs
wordpress3 apache2 /var/log/apache2/access.log 172.17.0.7 - - [21/Feb/2015:21:49:00 +0000] "GET / HTTP/1.1" 302 346 "-" "curl/7.35.0"
wordpress4 apache2 /var/log/apache2/access.log 172.17.0.7 - - [21/Feb/2015:21:49:01 +0000] "GET / HTTP/1.1" 302 346 "-" "curl/7.35.0"
wordpress1 apache2 /var/log/apache2/access.log 172.17.0.7 - - [21/Feb/2015:21:49:01 +0000] "GET / HTTP/1.1" 302 346 "-" "curl/7.35.0"
wordpress2 apache2 /var/log/apache2/access.log 172.17.0.7 - - [21/Feb/2015:21:49:01 +0000] "GET / HTTP/1.1" 302 346 "-" "curl/7.35.0"
wordpress3 apache2 /var/log/apache2/access.log 172.17.0.7 - - [21/Feb/2015:21:49:01 +0000] "GET / HTTP/1.1" 302 346 "-" "curl/7.35.0"
wordpress4 apache2 /var/log/apache2/access.log 172.17.0.7 - - [21/Feb/2015:21:49:01 +0000] "GET / HTTP/1.1" 302 346 "-" "curl/7.35.0"
wordpress1 apache2 /var/log/apache2/access.log 172.17.0.7 - - [21/Feb/2015:21:49:02 +0000] "GET / HTTP/1.1" 302 346 "-" "curl/7.35.0"
The spy_logs chisel shows all the I/O buffers that are written to files ending in .log or _log, inside or outside containers. The first entry in each line is the container name. The log above, for example, clearly shows how the load balancer is operating well: requests are routed to a different container every time, in FIFO order. Of course, we can also observe the logs generated inside a specific container. We do that by appending a filter to the command line:
$ sudo sysdig -pc -cspy_logs container.name=wordpress1
wordpress1 apache2 /var/log/apache2/access.log 172.17.0.7 - - [21/Feb/2015:21:55:18 +0000] "GET / HTTP/1.1" 302 346 "-" "curl/7.35.0"
wordpress1 apache2 /var/log/apache2/access.log 172.17.0.7 - -
3. Observing The Flow of Application Requests Across Containers
One of the hardest things to do when troubleshooting container-based infrastructures is observing the data that containers are exchanging. This is critical when trying to identify things like application bottlenecks, and it is essentially impossible to do today. Here’s how to do it with sysdig:
$ sudo sysdig -pc -A -c echo_fds "fd.ip=172.17.0.3 and fd.ip=172.17.0.7"

------ Write 103B to  [haproxy] [d468ee81543a]  172.17.0.7:37557->172.17.0.3:80 (haproxy)
GET / HTTP/1.1
User-Agent: curl/7.35.0
Host: 172.17.0.7
Accept: */*
X-Forwarded-For: 172.17.0.8


------ Read 103B from  [wordpress1] [12b8c6a04031]  172.17.0.7:37557->172.17.0.3:80 (apache2)
GET / HTTP/1.1
User-Agent: curl/7.35.0
Host: 172.17.0.7
Accept: */*
X-Forwarded-For: 172.17.0.8


------ Write 346B to  [wordpress1] [12b8c6a04031]  172.17.0.7:37557->172.17.0.3:80 (apache2)
HTTP/1.1 302 Found
Date: Sat, 21 Feb 2015 22:19:18 GMT
Server: Apache/2.4.10 (Debian) PHP/5.6.6
X-Powered-By: PHP/5.6.6
Expires: Wed, 11 Jan 1984 05:00:00 GMT
Cache-Control: no-cache, must-revalidate, max-age=0
Pragma: no-cache
Location: http://172.17.0.7/wp-admin/install.php
Content-Length: 0
Content-Type: text/html; charset=UTF-8


------ Read 346B from  [haproxy] [d468ee81543a]  172.17.0.7:37557->172.17.0.3:80 (haproxy)
HTTP/1.1 302 Found
Date: Sat, 21 Feb 2015 22:19:18 GMT
Server: Apache/2.4.10 (Debian) PHP/5.6.6
X-Powered-By: PHP/5.6.6
Expires: Wed, 11 Jan 1984 05:00:00 GMT
Cache-Control: no-cache, must-revalidate, max-age=0
Pragma: no-cache
Location: http://172.17.0.7/wp-admin/install.php
Content-Length: 0
Content-Type: text/html; charset=UTF-8
What does this do? The filter in the command line isolates the traffic between two containers, haproxy (whose IP is 172.17.0.7) and wordpress1 (whose IP is 172.17.0.3). Notice how we can see both ends of the conversation in a single stream, with no noise coming from other connections. And let me point out one more time:
this is done without having to attach to the containers and/or install anything in them.
Conclusion
The title of this blog post is
let there be light. This is what I thought when I first started using the sysdig container functionality as we were developing it. Here at sysdig we are
in love with containers, but after having worked in the visibility space for many years, we know that containers won’t succeed without state of the art monitoring and troubleshooting. We believe what we’re showing in this blog post is a step in that direction, and we sincerely hope that it can make container adoption less painful and even more fun.
Of course there’s tons of space for improvement, so I encourage you to
install sysdig (it’s a matter of 30 seconds!), and give us feedback on
Twitter or
github. During the next weeks, we’ll publish more technical blog posts that will cover deployment (including environments like CoreOS), better visualization of this information and other advanced topics.
Also, I expect you are wondering if there’s a way to get this goodness for distributed container-based infrastructures. That is exactly the goal of
Sysdig Cloud, our SaaS offering, which is in open beta and which is adding container functionality starting today.
Give it a try, and you could get visualizations like this one in a matter of minutes:

 Sysdig’s instrumentation technology consists of a small kernel module that can capture the interaction between the kernel and each of the containers. Sysdig can then consume the resulting stream of events, from the host OS or from another container. The second option is useful in environments like CoreOS, where applications are not allowed to run outside containers.
The latest sysdig release adds awareness of cgroups and namespaces to sysdig. This means that all the sysdig goodness you’ve learned to love is now capable of understanding containers.
Let’s start with the basics.
The lscontainers chisel can be used to check what’s running on your system (if you don’t know what a sysdig chisel is, read this):
 As you can see, this includes details such as both the external and the internal PID and the container name.
Keep in mind: -pc will add container context to many of the command lines that you use, including the vanilla sysdig output.
What if we want to zoom into a single container and only see the processes running inside it? It’s just a matter of using the same topprocs_cpu chisel, but this time with a filter:
 Remember, this works from the host OS or from another container. Pretty powerful.


