
Being able to see the status and performance of your containers in production deployments is critical. But once you see a problem, then what? Most monitoring systems – whether they are open source systems like Prometheus or Grafana, or commercial systems like Datadog – provide no integrated troubleshooting. These solutions leave you to your own devices to cobble together some other tools that actually figure out why a problem occurred.
The latest release of Sysdig Monitor delivers integration with Sysdig Inspect, our open-source interface for container troubleshooting and security investigation. With this unified approach, you have both visibility into what’s happening and why. By combining powerful container-native monitoring and alerting with GUI-based system call analysis, you can now quickly discover and analyze events in your microservices environment. This provides a huge time savings when performing root cause analysis.
How integrated troubleshooting works
Sysdig Monitor users can automatically trigger Sysdig capture files (.scap files) based on any alerting condition. Alerts can be based on system and container performance metrics, custom Prometheus metrics, application metrics, and even events like orchestrator scaling.
Capture files contain all of the system calls and OS events that occurred before, during and after a system event. A link automatically added to each Sysdig capture listing lets you instantly open the file in Sysdig Inspect, while preserving the context of your troubleshooting exercise. This new integration means no more logging into production hosts to troubleshoot, and no more copying and moving files to open into a separate tool.
The Sysdig Inspect user interface is designed to intuitively navigate data-dense Sysdig captures. Its overview page presents an at a glance summary of the system, network, and application activity organized in tiles. Each tile shows the value of a relevant metric and its trend.
Sysdig Inspect category tiles are your starting point for investigation. They enable you to correlate metrics, zoom in on a specific time slice to isolate conditions, and further drill down to help you get a clear picture of what caused a problem. Customers tell us that having integrated troubleshooting with this level of control in one interface accelerates their time-to-resolution for container issues by 10x or more!
How to speed #container #troubleshooting by 10x with Sysdig Monitor and Sysdig Inspect Click to tweetTroubleshoot CrashLoopBackOff in Kubernetes with Sysdig Monitor and Sysdig Inspect
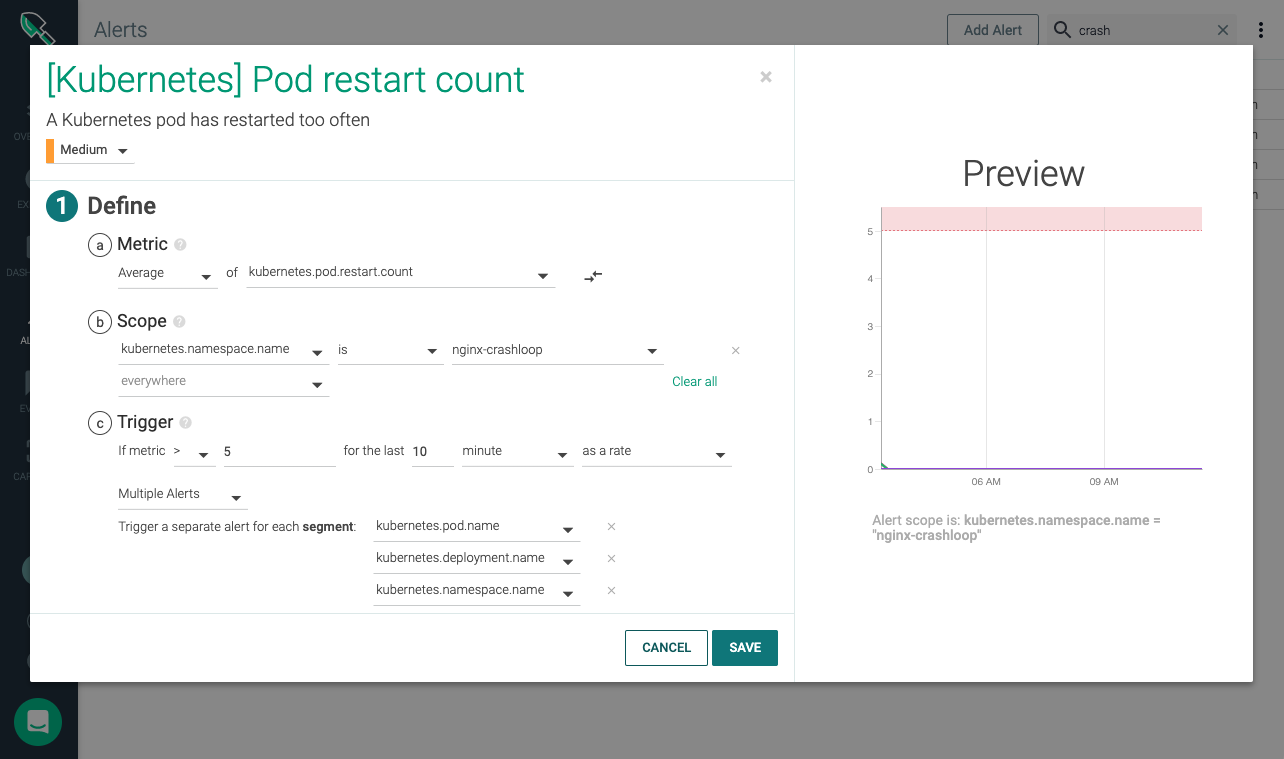
Here’s an example of what’s possible now that these tools are integrated. You can, for instance, set an alert to issue a notification and create a capture file whenever a Kubernetes pod restarts too frequently – usually indicating a CrashLoopBackoff condition. Each time your Kubernetes cluster experiences this state, Sysdig Monitor issues a notification (via UI, email, Slack channel, etc.). It simultaneously triggers a trace capture for the duration of time you’ve set in your alert. By default, these captures are stored in the Sysdig Monitor AWS S3 bucket. You can optionally choose to store trace files in your own S3 bucket.
Once a capture is taken, log in to Sysdig Monitor, select the captures tab and click on the relevant capture file. Sysdig Inspect opens to show summary information from the capture. From here you can explore its content to see what’s causing the problem in your Kubernetes environment.
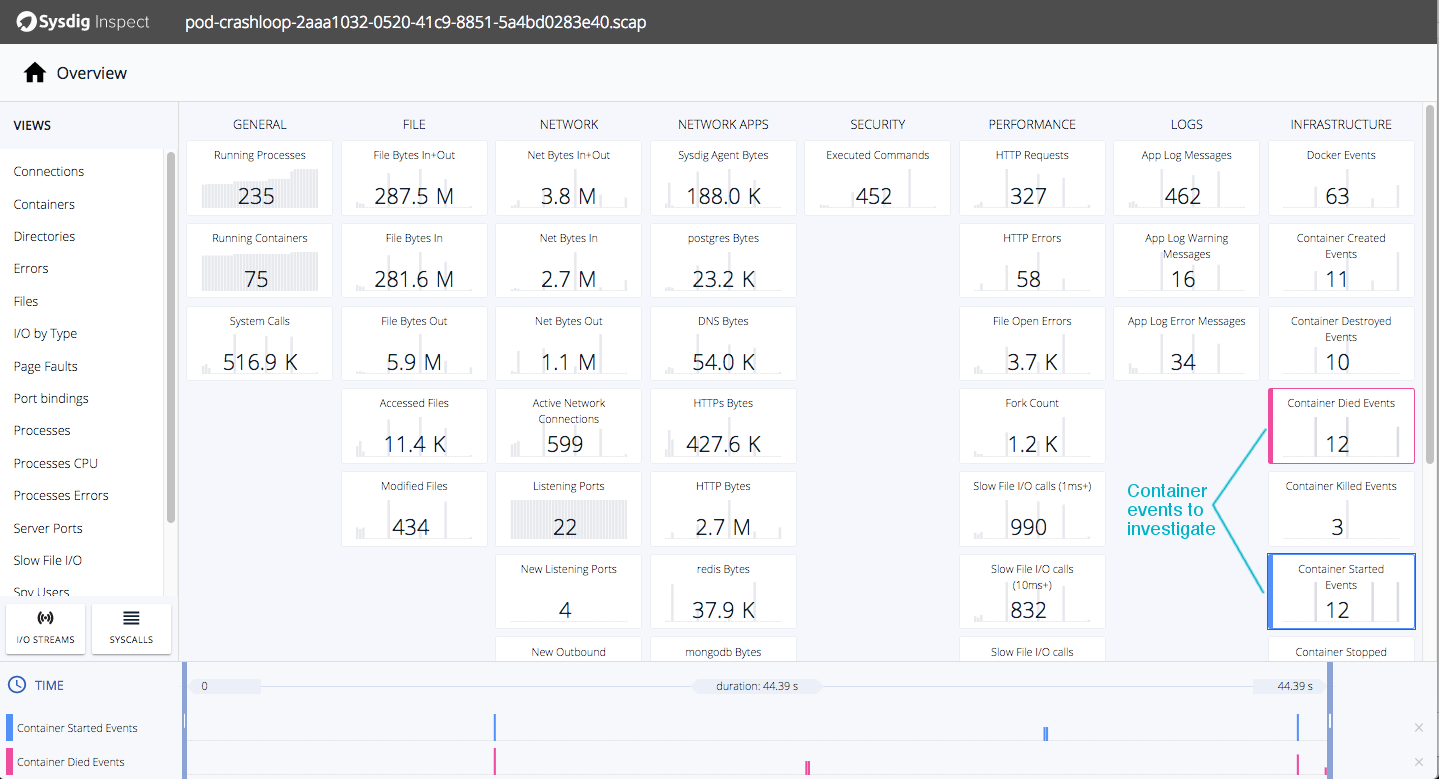
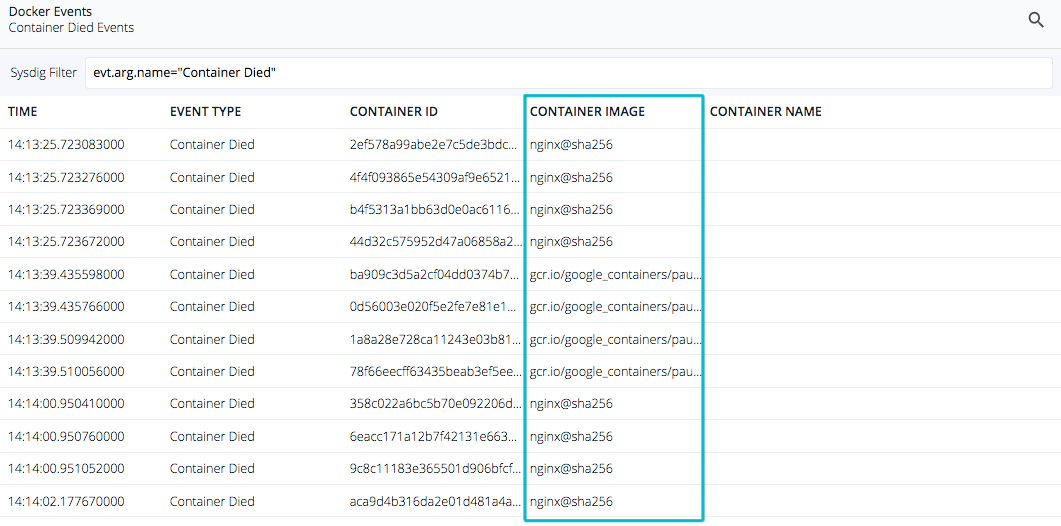
In our example, we can quickly see that 12 containers died and were restarted. As a next step, you can drill into these tiles to see what are the affected containers. We see that some containers are having trouble and are dying shortly after being created.
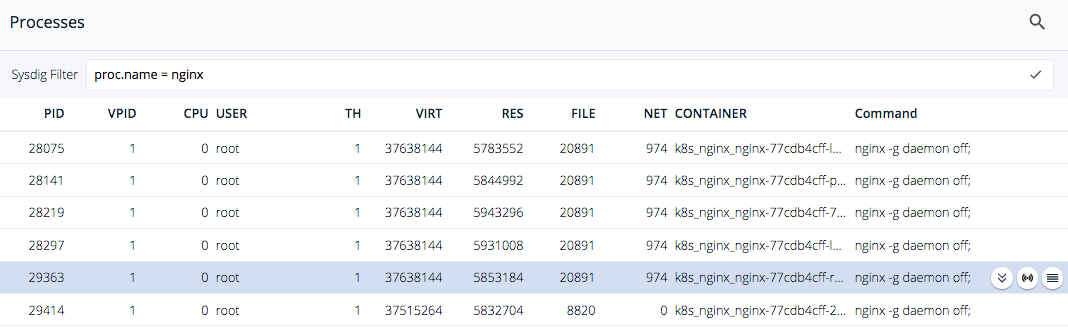
Why is this happening? One thing to look at first are the processes executing during this time slice. Let’s look at NGINX as a start. Here we can simply filter to get a list of the processes executed for the containers – nginx.
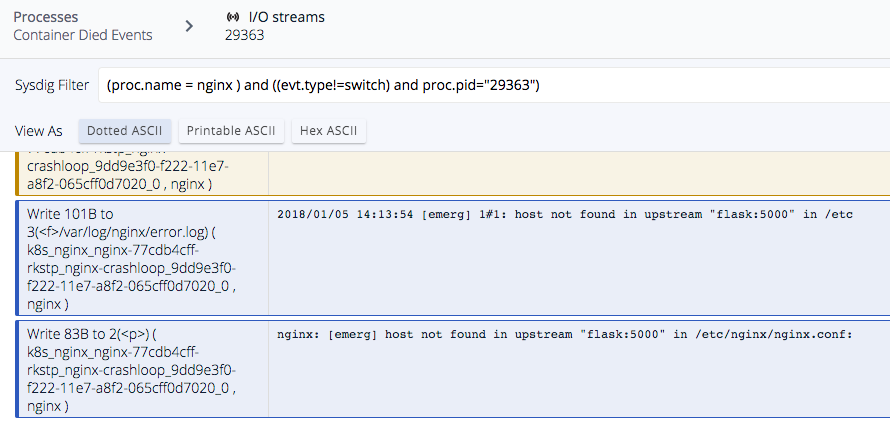
From here select one of these nginx processes and troubleshoot the I/O streams to see if there were any errors here. We can see the different DNS requests nginx tries to do before crashing. In this case Sysdig Inspect reveals what happened to that process before dying –
We hope this quick walkthrough gives you some idea of what is now possible with the new integrated troubleshooting. If you’re a Sysdig Monitor customer or currently taking advantage of our free trial, good news, you can try this today.
Take a capture and click thru to check out how it works. If you’d like to explore the .scap file we used above, you can download it here. To see more of how Sysdig Inspect works, check out this overview video from our YouTube channel.