


Falco Feeds extends the power of Falco by giving open source-focused companies access to expert-written rules that are continuously updated as new threats are discovered.

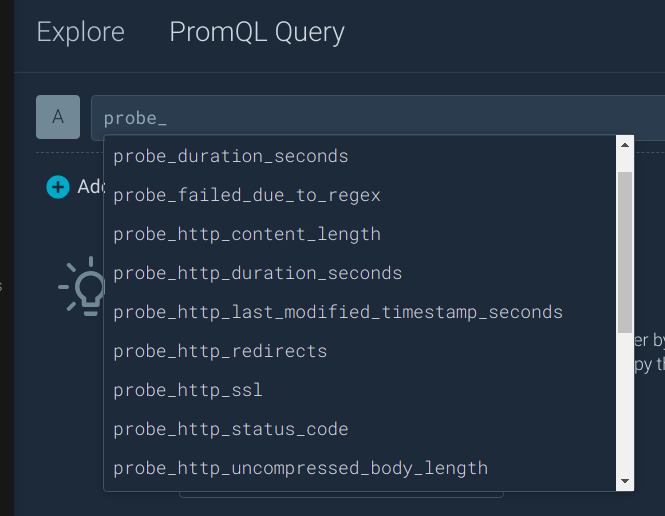
The Prometheus Blackbox exporter allows endpoints exploration over several protocols, such as HTTP(S), DNS, TCP, and ICMP. This exporter generates multiple metrics on your configured targets, like general endpoint status, response time, redirect information, or certificate expiration dates.
The Blackbox Exporter works out-of-the-box, as it just focuses on external visibility details. To get more detailed metrics, you can instrument your applications.
Since the Blackbox exporter usually runs as a self-hosted service in a container, it can be easily deployed in your Kubernetes cluster.
By default, when performing HTTP probes, this exporter uses the GET HTTP method to explore your targets and expects a status code similar to 2xx. This behavior is easily configurable along with others, like basic or bearer token-based authentication, custom headers, or the usage of a proxy server to connect to targets.
Some interesting use cases where you can use Blackbox exporter with Sysdig are:
- Detecting certificate expiration.
- Analyzing the latency of specific targets and paths of services running in the same cluster.
- Detecting endpoint failures.
- Monitoring latency and reachability of an external endpoint like third services.
Installing and configuring Blackbox exporter in Kubernetes
You can use Helm to install and configure your Blackbox installation in Kubernetes.
$ helm repo add prometheus-community https://prometheus-community.github.io/helm-charts
$ helm repo update
Under the parameter config, you can include your probes configuration. For example, you can define several HTTP probes for different scenarios. You can include the following configuration in a Helm values file that has to be provided with the "-f" flag.
config:
  modules:
    http_2xx:
      prober: http
      timeout: 2s
      http:
        follow_redirects: true
    http_k8s:
      prober: http
      timeout: 2s
      http:
        follow_redirects: true
        bearer_token: /var/run/secrets/kubernetes.io/serviceaccount/token
        tls_config:
          ca_file: /var/run/secrets/kubernetes.io/serviceaccount/ca.crt
In the http_2xx module, most options are kept by default. In the http_k8s example, it has been configured with a custom CA and bearer token-based authentication.
Once you have correctly configured your Helm values, you can install the Blackbox exporter:
$ helm install [RELEASE_NAME] prometheus-community/prometheus-blackbox-exporter -f values.yaml [-n NAMESPACE]Scraping Blackbox using Sysdig Agent
The Blackbox exporter can be invoked using the native Prometheus service discovery, available with the Sysdig Agent.
To use the native Prometheus service discovery, you'll need to enable the prometheus.prom_service_discovery configuration by adding the following lines in your Agent configuration:
prometheus:
  enabled: true
  prom_service_discovery: true
Target configuration for Blackbox exporter must be provided using Prometheus relabel_configs in a static scrape configuration. You can include the list of targets with the module you want to use as a parameter in your Sysdig Agent prometheus.yaml file.
prometheus.yaml: |
  global:
    scrape_interval: 10s
  scrape_configs:
  - job_name: blackbox
    metrics_path: /probe
    params:
      module:
      - http_2xx
    relabel_configs:
    - source_labels:
      - __address__
      target_label: __param_target
    - source_labels:
      - __param_target
      target_label: instance
    - replacement: blackbox-service:9115	# Blackbox hostname:port
      target_label: __address__
    static_configs:
    - targets:
      - http://front-end.sock-shop.svc.cluster.local
      - https://docs.sysdig.com/
      - https://promcat.io
      - https://api.promcat.io/apps
      - https://my.failing.app
In the relabel_configs block, replace "blackbox-service:9115" with your Blackbox exporter hostname:port. You can directly use the Blackbox Kubernetes Service and port.
In addition to static configuration, there is a common snippet where you do autodiscovery of services in the cluster and use Blackbox to check all the services with the annotation "prometheus.io/probe: true".
prometheus.yaml: |
  global:
    scrape_interval: 10s
  scrape_configs:
  - job_name: kubernetes-services
    kubernetes_sd_configs:
    - role: service
    metrics_path: /probe
    params:
      module:
      - http_2xx
    relabel_configs:
    - action: keep
      regex: true
      source_labels:
      - __meta_kubernetes_service_annotation_prometheus_io_probe
    - source_labels:
      - __address__
      target_label: __param_target
    - replacement: blackbox-service:9115	# Blackbox hostname:port
      target_label: __address__
    - source_labels:
      - __param_target
      target_label: instance
    - action: labelmap
      regex: __meta_kubernetes_service_label_(.+)
    - source_labels:
      - __meta_kubernetes_namespace
      target_label: kubernetes_namespace
    - source_labels:
      - __meta_kubernetes_service_name
      target_label: kubernetes_name
Note: Using a service approach is a generally disruptive approach as we run the Sysdig agent as DaemonSet. Whenever possible try to avoid a combination of static configurations and service sd. This can cause overages with noisy targets and in the worst case even having containers ending up OOMKilled. With a pod approach, we are going to scrape the pod locally on the node where the agent is running.
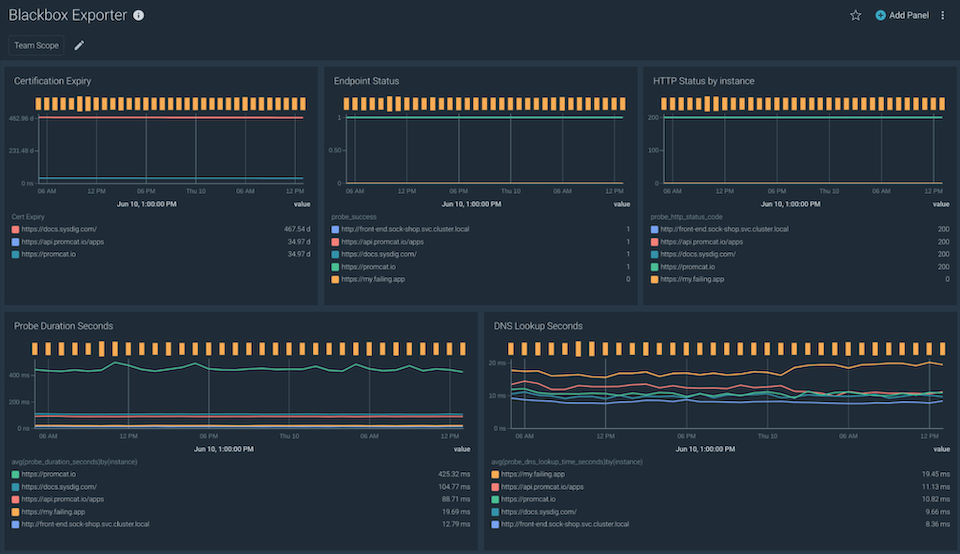
Visualize and Alert on available metrics
Once you set up Sysdig agent to use the Blackbox exporter to probe your targets, metrics will flow to your Sysdig instance:
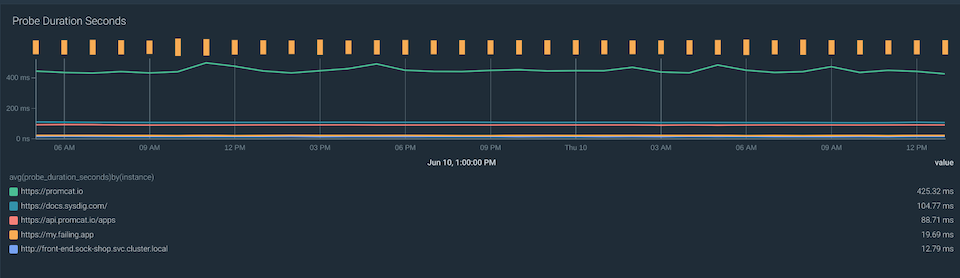
probe_duration_seconds metric returns how long the probe took to complete. You can use the following query to analyze the probe duration by each one of your targets:
avg(probe_duration_seconds) by(instance)
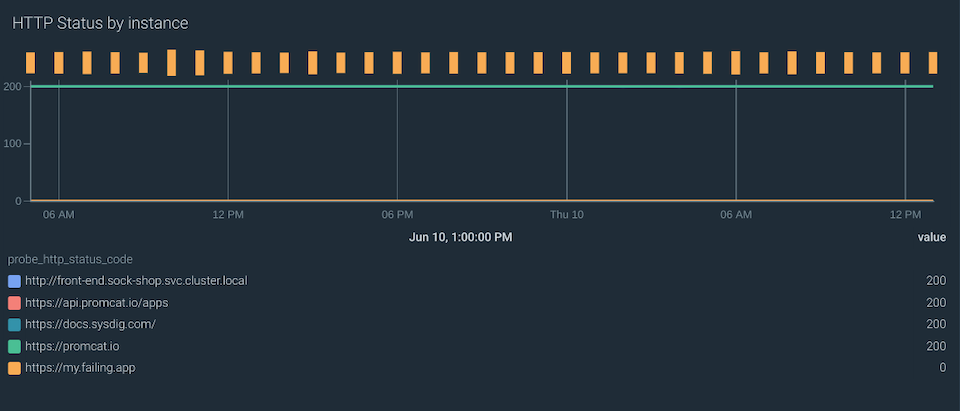
When our applications consume third-party services, it is important to detect outages or wrong code responses. You can get this information with the probe_http_status metric.
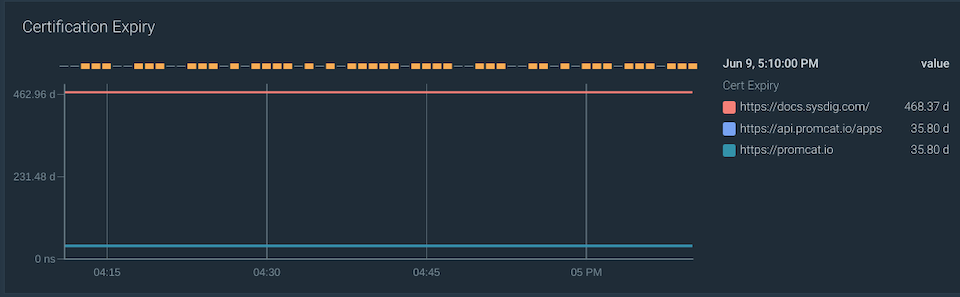
Certificate expiration can produce miscommunications between your services. The probe_ssl_earliest_cert_expiry metric provides you the timestamp in seconds when the certificate chain will no longer be valid.
Represent the expiring time of all your endpoints in one dashboard with the following query:
probe_ssl_earliest_cert_expiry - time()
Set up your own alerts for certificates that will expire in less than 60 days by using the following PromQL query:
probe_ssl_earliest_cert_expiry - time()You can also detect when your probes are failing by using the probe_success metric:
sum(probe_success) by (instance) != 1You can create your own dashboard for a complete overview of all your targets based on the available information:
If you would like to try this integration, we invite you to sign up for a free trial of Sysdig Monitor.