


Falco Feeds extends the power of Falco by giving open source-focused companies access to expert-written rules that are continuously updated as new threats are discovered.

As a developer, getting metrics from your application onto a Prometheus graph can seem daunting. We'll look at analyzing your service to find the most useful places to add metrics, how to add that instrumentation, getting it exposed and scraped, and then basic queries to use those metrics on graphs.
Check out another article of mine for general reference on instrumenting, this one on Prometheus metrics, or this comparison on instrumentation alternatives.
Prometheus has a large and growing ecosystem, so if you're a developer looking to get some quick graphs from your application, it's not always clear where to start. The good news is that you don't need to go whole-hog and implement a globally redundant, highly available monitoring system with alerting and dashboards across your whole organization. Rather, you can start very small on your desktop with only a minimal time investment.
The first step is to get your application to expose Prometheus metrics over HTTP. In Java, this can be as easy as:
DefaultExports.initialize();
HTTPServer server = new HTTPServer(8000);
If you visit the localhost:1234/metrics, you'll see a variety of JVM metrics out-of-the-box, such as jvm_gc_collection_seconds_count for the number of garbage collections that have taken place, and jvm_gc_collection_seconds_sum for how long they all took.
While it's possible to debug things by eyeballing a /metrics, a graph is usually more illuminating. Prometheus can scrape this /metrics with a minimal config, like:
global:
  scrape_interval: 5s   # Reduced for demo sake
scrape_configs:
  - job_name: example
    static_configs:
      - targets: ['localhost:8000']
After starting Prometheus, you can run PromQL queries allowing real-time aggregation and analysis of your application's metrics. You can now graph jvm_gc_collection_seconds_count, or do a rate(jvm_gc_collection_seconds_count[1m]) to see GCs per second over the last minute, rate(jvm_gc_collection_seconds_sum[1m]) / rate(jvm_gc_collection_seconds_count[1m]) to see the average time each of those GCs take, or jvm_memory_pool_bytes_used / jvm_memory_pool_bytes_max for how full each memory pool is:
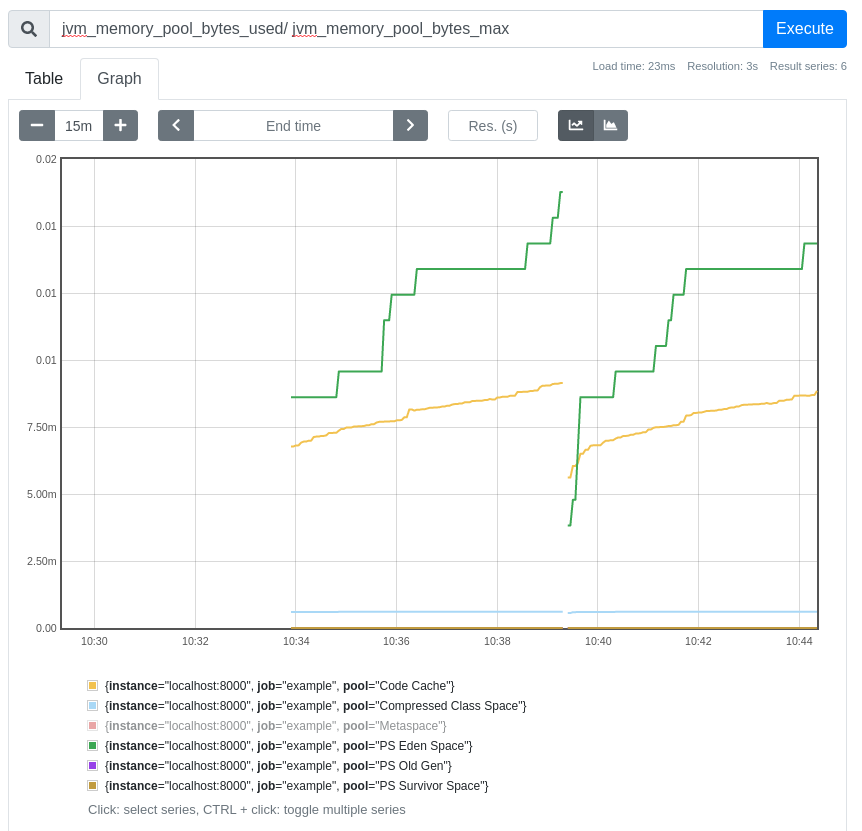
While knowing about GCs is important, where metrics really shine is being able to add your own metrics that are relevant to you. The good news is that adding metrics is simple, often just two lines of code. First, you define what the metric is:
static final Counter functionCounter = Counter.build()
   .name("my_function_calls_total")
   .help("Number of times my_function was called").register();
And then where the thing of interest happens, use the following metric:
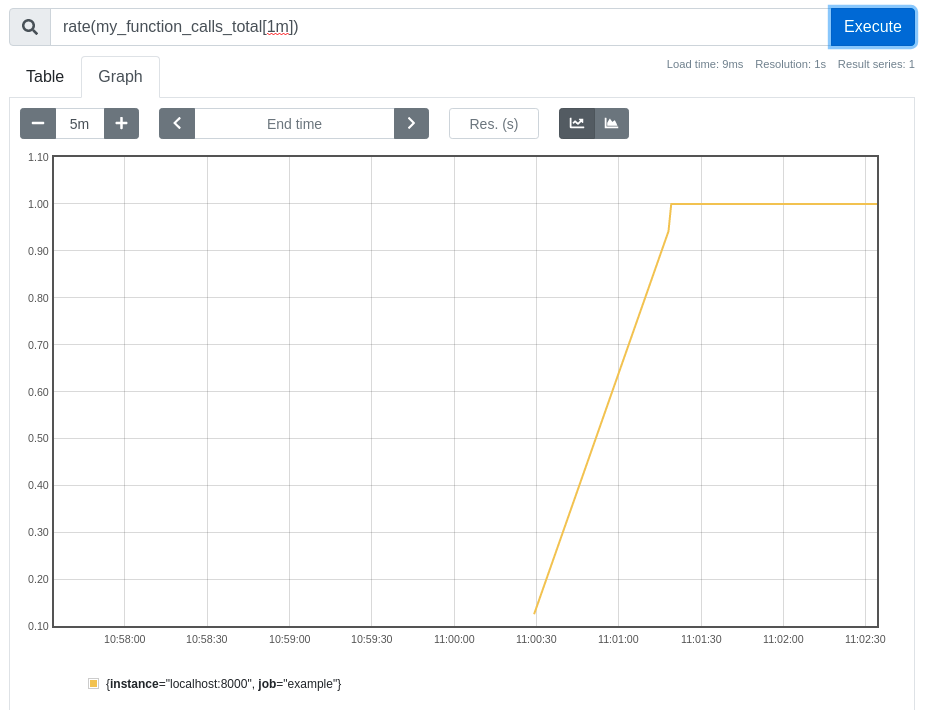
functionCounter.inc();The Prometheus client library takes care of all the nitty-gritty details like bookkeeping and thread safety, you only need to worry about defining and then incrementing your counter. Once this code is included, you can then graph how this metric changes over time, or even see if there's maybe a relation between memory usage and requests:
This is, of course, only a look at how easy it can be to get things up and running on your workstation. Once you're comfortable with the basics, you can look for low hanging fruit within your systems, where instrumentation would provide massive benefits. A good place to start are the natural bottlenecks through which the majority of requests flow, such as RPC clients and servers. If you can add basic requests, latency, and error metrics once to the libraries providing these, then all applications will benefit from them.
For a more production use case, you would likely hook exposition into the existing HTTP server of your application, have far more metrics, and use a Prometheus that isn't just on your machine.
However, one of the beauties of the Prometheus approach, one of decoupled components that each do one thing well, is that throwing together a few graphs while you're debugging locally is perfectly viable.
Sysdig is fully compatible with Prometheus and scales Prometheus monitoring to millions of metrics with long-term retention. Try it today!