


Falco Feeds extends the power of Falco by giving open source-focused companies access to expert-written rules that are continuously updated as new threats are discovered.

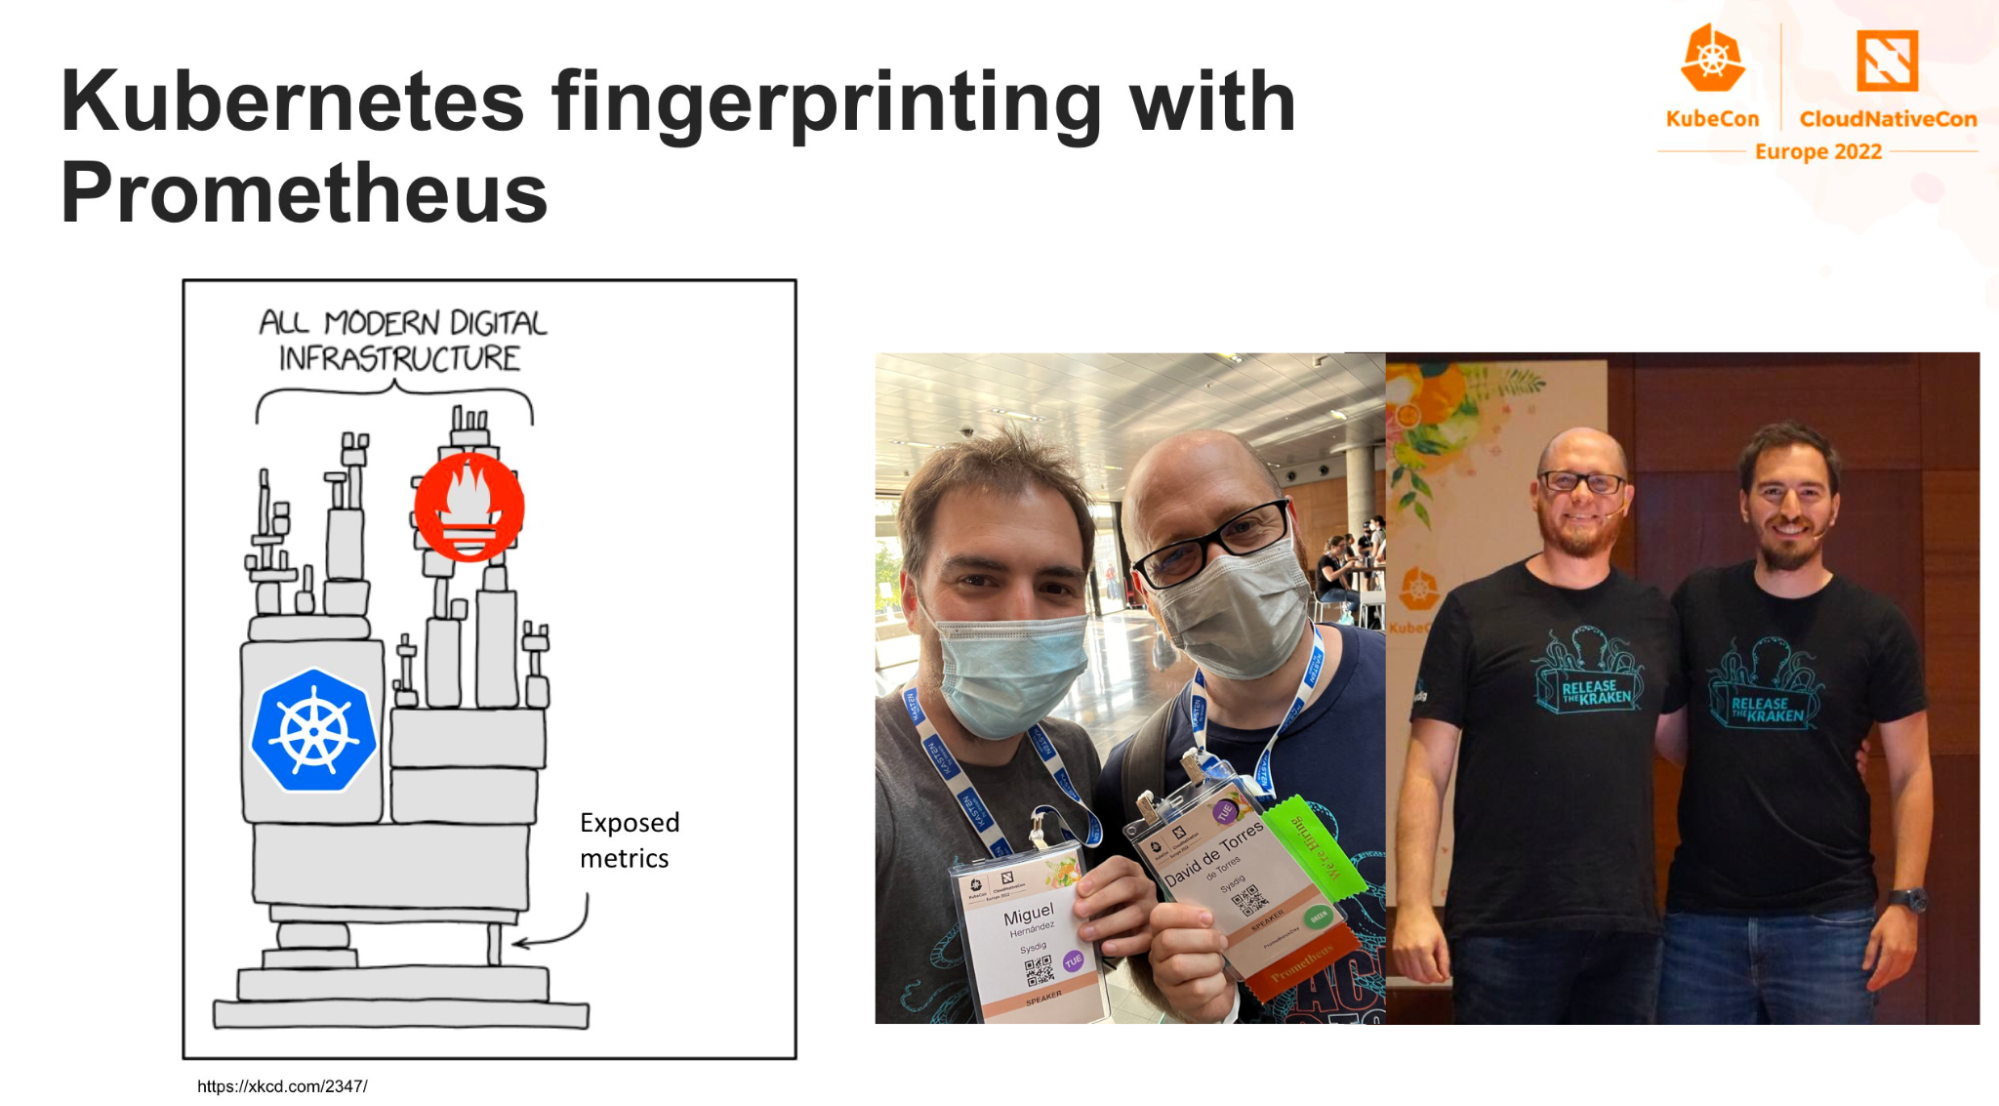
You might think that your metrics are harmless from a security point of view. Well, that's not true, and in this talk at KubeCon Valencia 2022, we share the risk of exposed Prometheus server and how attackers use this information to successfully access a Kubernetes cluster.
The slides are available here, and we also collected some mentions in social media and blogs and the feedback was very positive:
- https://blog.wescale.fr/kubecon-valencia-2022/
- https://twitter.com/bcamerongain/status/1526933325151092736
- https://twitter.com/xavigpich/status/1527406432018223105
- https://twitter.com/DipankarDas011/status/1526960966021558272
It was our first time as speakers at KubeCon and expectations were really high. With a 12% acceptance rate (thanks to CNCF and reviewers for accepting us) and over 1,300 attendees registered for our talk, we'd be lying if we said we weren't nervous. So, let's get started.
What is the main thing we want to explain? It's simple; don't expose your metrics for free.
Sometimes we think about deep and complex defense methods and that's fine. We don't know why, but we always forget about the base. Don't expose your data. By default, your Prometheus server can allow anyone to make queries to get information from your Kubernetes Cluster.
This is not something new. In 2018, Tesla had a cryptocurrency mining application in their cloud account, and the initial access was an exposed Kubernetes Dashboard with credentials in the clear.
Moreover, we are not the first to talk about (in) security in monitoring tools. Here are three good examples:
- Exposed Prometheus metrics Endpoint
- Don't let Prometheus Steal your Fire
- Hacking Monitoring for Fun and Profit
With this in mind, are exposed Prometheus servers a real attack surface?
Prometheus exposed in the wild
One of the most important steps in any pentest, ethical hacking, or real attack is gathering as much information you can get from the target.
The fastest way to check if something is exposed on the internet is to query Google. The specific queries to gather information are denominated Google Dorking and, in our case, is something trivial to get real exposed Prometheus.
A cooler way to find exposed Prometheus servers is using search engines. We used the most common ones to check how many servers we could access:
At this point, we would like to clarify a critical fact.
Disclaimer: We have not used an actual exposed Prometheus server to consult or prepare for this talk. We performed all testing in our demo environment and strongly recommend always following security best practices.
After that, what can we do if we have access to a Prometheus server and have access to the fingerprint Kubernetes?
Prometheus' exporters and fingerprint Kubernetes
Prometheus is the de facto monitoring standard in Kubernetes. All the Kubernetes components of the control plane generate Prometheus metrics out of the box, and many Kubernetes distributions come with Prometheus installed by default including a series of standard exporters, generally:
- Node Exporter for infrastructure and host metrics.
- KSM Exporter for Kubernetes objects state metrics.
An exporter is an application that generates metrics from other applications or systems that do not expose Prometheus metrics natively.
Cloud provider, where are you?
Imagine that you have a possible target in www.example.com.
All you know is that this site is a web page with users and a little e-commerce section. Under that domain, you find an open exposed Prometheus. The first thing you can do is try to identify the cloud provider where the site is hosted.
You can use the metric node_dmi_info from the Node Exporter. This metric is very interesting, as it gives information about each Kubernetes node:
- System vendor: It exposes the cloud vendor's name. Some example values could be "
Amazon EC2" or "Tencent Cloud." - Product name: Useful to identify both the cloud provider and the product used, as we can find some popular product names from the AWS EC2 catalog (like "
m5.xlarge") or other vendors' products.
But the cloud provider, even if interesting, is still so vague. You can gather more information if you focus on networking. You can start with the node_network_info metric from the Node Exporter. And even more, you can narrow your search if you filter only the Ethernet interfaces.
Why only Ethernet ones? Because usually, they are the ones that the host identifies as physical network connections and are used to connect the host with the outside world and other machines.
This query provides the following information:
- IP address of each host.
- Device ID.
- Availability zone of the cloud provider.
- ID of the VPC (Virtual Private Cloud).
Here is an example of some possible values:
You can also get more information, like the hostname of each node with the metric kube_node_info from KSM.
The long and windy road to the pod
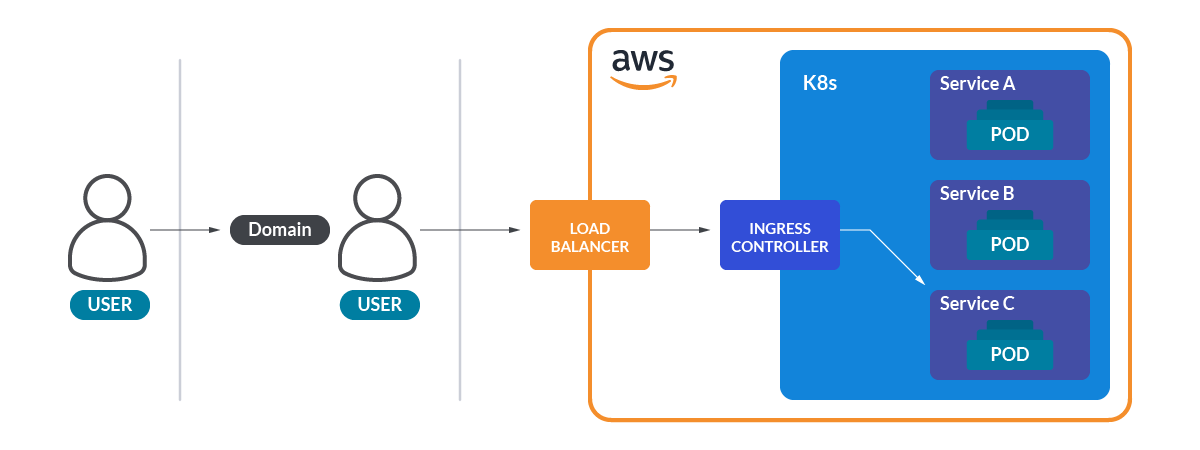
This was all about physical info, but how can we get from outside the web page to a pod in the cluster? The answer to this question is in the ingress and the services.
The ingress controllers in Kubernetes act as reverse proxies and allow redirecting different paths of the URL to different Kubernetes services. These services normally act as load balancers in front of a set of pods that expose a port for connections. The metric kube_ingress_path from KSM will give you information about the URL paths and the associated services of the ingress controllers in your cluster.
This way, you can know that the path /api/users/login goes to the Kubernetes service users-login of the namespace api. Funny, right?
Load balancer services are a special kind of Kubernetes service. Cloud providers use those load balancer services to expose the service to the outside world. As an example, when you create a load-balancer service in an AWS Kubernetes cluster, it creates an ELB (Elastic Load Balancer) instance bound to the service.
This promQL query will give you information about all the load-balancer services in a Kubernetes cluster:
To guess what pods are behind each service, you have two options. You can check the metric kube_pod_labels from KSM. These labels are the ones that the service usually uses to select the pods that will serve the requests, but unfortunately, there is not a direct way to get the association between pods and service in pure KSM.
However, if you are lucky enough, the cluster will have installed the OpenCost exporter, a tool that helps infrastructure engineers understand the costs of their cloud usage. This exporter generates an interesting metric called service_selector_labels, which directly gives you the association between the service and the labels that the pod needs to have to be part of that particular service.
This promQL query will give you the labels of each workload used for matching in services:
While this other one will give you the labels that each service uses to find the pods:
Being a many-to-many association, there is not an easy way to collect all this info in a single promQL query, but the info is there, and it's easy to make a quick correlation between services and pods.
This way, we have all the points of the path from the URL to the pods: the path of the URL (thanks to the ingress), and pods serving the requests (thanks to the services and labels of the pods).
Logical song of the cluster
You used the metric kube_node_info to get information on the nodes, but now, you are also interested in making a logical map of namespaces, workloads, and pods inside the Kubernetes cluster.
This is easy by using the KSM metrics. The metric kube_namespace_status_phase gives you all the namespaces in the cluster. From there, you can go down with the following metrics for each of the different workload types:
kube_deployment_spec_replicaskube_daemonset_status_desired_number_scheduledkube_statefulset_replicaskube_replicaset_spec_replicaskube_cronjob_info
After that, you can get info on the pods using kube_pod_info, and associating them with their workloads with kube_pod_owner in the following promQL:
Finally, you can even get the container inside each pod with the metric kube_pod_container_info. For example, a pod called postgres-db can have two containers named postgresql and postgres-exporter.
But there is more. You can not only know the namespace and workload of a pod, you can also discover the node where it is living thanks to the label node of the metric kube_pod_info. Why is this important? Keep reading.
The boulevard of broken nodes
You used the metric kube_node_info before to get the hostname of each node, but this metric has more surprises to unfold.
Two labels of this metric will give us full information about the Operative System image used to build the node and the detailed kernel version.
os_imagekernel_version
A quick search on CVE for "Ubuntu 18.04.4 LTS" or "Linux 3.10.0-1160.59.1.el7.x86_64" will give a possible attacker a good set of exploits to use if they can get access to the machine.
Let's talk about K8s
You have done a good job gathering information about the cluster so far. Namespaces, pods, services, and more But what about Kubernetes itself? There is a set of processes in Kubernetes itself that are just there, and we don't even think about them unless they start causing problems. We are talking about the Kubernetes control plane.
What would you say if we tell you that there is a metric that specifies the specific version of each of the components of the control plane? While presenting Prometheus, we said that Kubernetes control plane components were exposing natively metrics. Well, one of those metrics is kubernetes_build_info. This gives you information about, not only the full (major and minor) version of each component, but also the git commit and the build date.
This is great if you want to know if a concrete vulnerability affects one of the control plane components of the cluster (among other things).
We have a secret…
Everybody loves secrets, especially attackers. In KSM, there is a metric called kube_secret_info that gives you information about the namespace, node, and name of the secrets of your cluster.
But if you are interested in knowing the content of the secrets, you can use this query:
Why? Well, this is somehow embarrassing. In some older versions of kubectl, it used to save the last applied configuration in an annotation. This was being made for every object, including secrets. This had the effect that, even if the secret was only accessible by the service accounts and role bindings that you can imagine, Prometheus can expose the content of the secret in plain text in that metric.
On images and registries
Do you think you had enough? There is one more interesting thing you can get from KSM. The metric kube_pod_container_info has an interesting piece of information in these labels:
image: name and tag of the image of the container (for exampledocker.io/library/cassandra:3.11.6)image_id: name, tag, and hash of the image of the container
This gives you information about:
- Application used.
- Registry used to pull the image.
- Image used.
- Tag of the image.
- Hash that identifies uniquely the image independently of its tag.
Summary Kubernetes fingerprint
Let's see what you've done so far. You gathered information about:
- Cloud provider.
- Kubernetes control plane components versions.
- Network path from the outside to pods.
- Nodes hostnames and IPs.
- Operative system and kernel versions.
- Logical structure of the cluster namespaces, workloads, and pods.
- Images used for the containers, from the source repository to the image tag.
- Annotations and names of the secrets of the cluster.
All this information is enough to make a good surface attack analysis of the cluster.
Ninja mode!
Do you want to hear something funny? We gathered all this information and most likely, there is not a trace of all the queries that we did to get it. Prometheus can register logs of the queries, but that's disabled by default. You can even check if your activity is being logged with this metric:
Inside the attackers' minds
Now, attackers just need to know what their target is. In 99% of attacks, it's money, but how to get the money from the victim, that's the point where the attacker's path is defined.
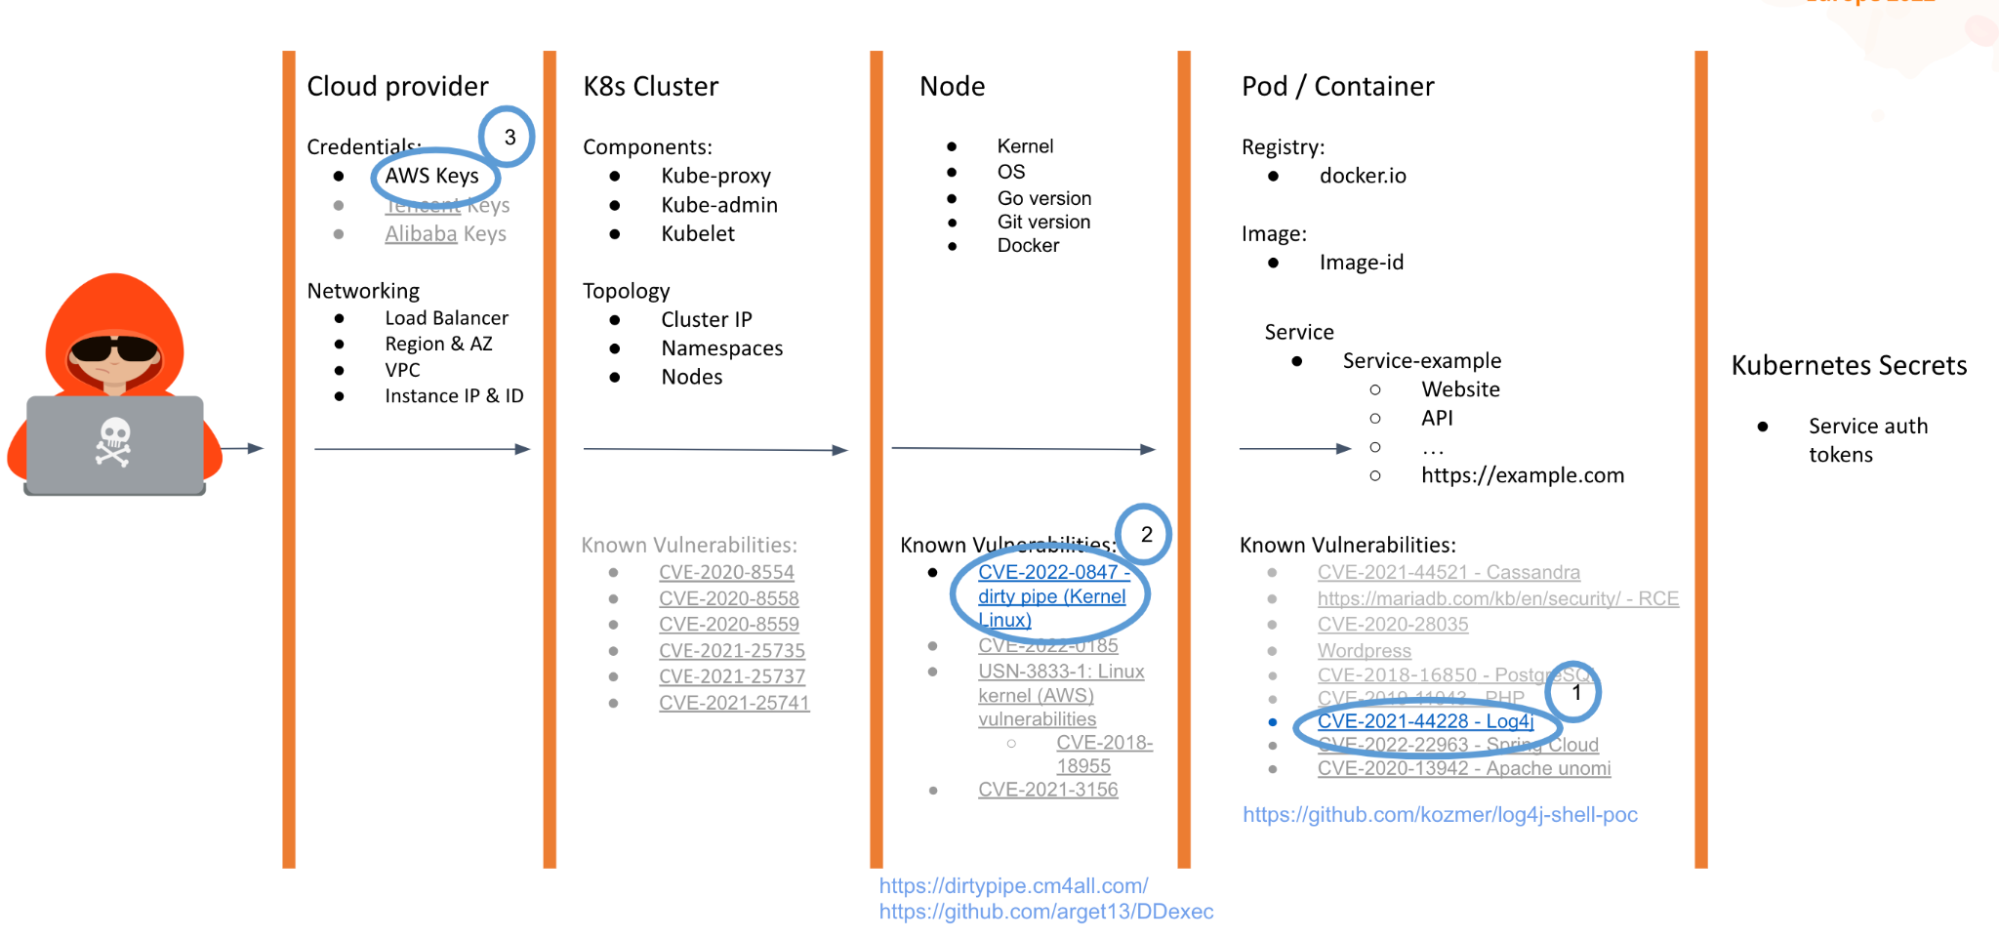
In the talk, we exposed three examples and in each of them, the tools and services exploited are different. The important thing is that we already know where the weaknesses are.
Leak sensitive data
In the first scenario, the exposed application is running on a Kubernetes cluster and the attacker wants to access the data without authorization. The first thing the attacker could check is if the application can be exploited through normal pentesting techniques, for example, with SQLmap the attacker can try to gain access to the data.
But if this does not work, what is the next step?
The attacker can check if the container has vulnerable dependencies or if the image used could be exploited, then see if the components or the node itself are exploitable. But everything seems to be fine. There are no CVE matches and no known exploits that could be used to gain initial access.
What's next? Well, Prometheus exposed the image and registry that the attacker accessed, but what about attacking the supply chain? In this case, we have two scenarios:
- Official/private registration: In this case, the attacker could use similar image names, such as homographs, visually similar by using different Unicode groups, to trick the target. Another technique could be to abuse an insider to manually change the exposed image. In this case, it depends on the financial gain of the attacker.
- Third-party registry: In this case, one of the methods could be social engineering, using tools like BeeF to create a specific phishing or fake page to get the login credentials and change the image to a new one with a known and exploitable vulnerability and wait for the deployment. One more thing is this is not magic or 100% successful. If the company scans the images in the deployment, it could be detected!
Cryptomining
In this scenario, one of the most relevant in the last years with the era of cloud, the attacker would like to get access to the cloud account where the application or Kubernetes cluster are deployed. The attacker could take two paths. The long path was to identify one app exposed via Ingress-controller that has a known vulnerability easily exploited via HTTP and obtain a Remote Code Execution inside the container.
The vulnerability exploited in this case will be the infamous log4shell.
Once the attacker has access to the container, they don't even need to gather more information about the cluster or the node because Prometheus exposed this information as well. From that, we could directly exploit another vulnerability to escape to the container and get full access to the node without using more tools or scanning, evading typical defense methods.
Note: This is not 100% successful. If runtime security is used and the shell within the container is detected as malicious behavior, the incident will be detected before impacting resources.
Now that the attacker has full control of the node, they will be able to deploy containers to run cryptominers, or find cloud credentials in configuration files or env variables to gain initial access.
But this is a long way, what's the short way? Well, it is possible for Prometheus to directly expose credentials to these cloud providers in the same way that the Kubernetes Dashboard did in the past. Therefore, the attacker only needs to query the information via query and get the API keys in clear text.
Ransomware
Yes, ransomware in Kubernetes is not typical but not impossible. The scenario is similar to the previous one. We need to get write access and for that, we need to jump or move between namespaces.
In this case, we find another application with a different vulnerability, Spring Cloud, but with the same purpose: to get a shell inside the container.
Once inside, we know that a Kubernetes component is an old vulnerable version that we can exploit to get access to etcd, and with that, full access to the namespaces.
The curious thing here is after the data is encrypted, the attacker needs to ask for a ransom through some channel. In a typical scenario, our PC would be locked and the screen would show instructions to pay via BTC or ETH, but inside the container. We hate to share ideas with the bad guys, but one option could be to deploy a container with a modified UI and force ingress to display this in front of the actual application.
Conclusion
We might think that metrics are not important from a security perspective, but we demonstrated that's not true. Kubernetes and Prometheus advise problems with exposing your data to the world, but regardless, these problems are still widespread.
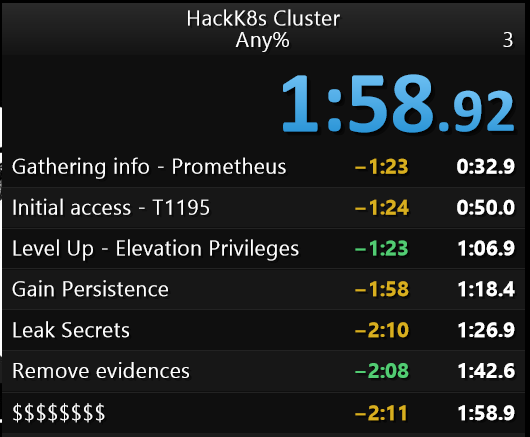
Following the security best practices in every part of our chain leads to being safe from most security incidents. Otherwise, we will change the typical scenario with a long battle between attackers and defenders for a speedrun.
We will have to continue to fight with new vulnerabilities that impact our services and also a plan against insiders. But let's at least make things difficult for them.
- Secure your Cloud provider with the Principle of least privilege.
- Secure your Cluster Kubernetes.
- Secure the Host / OS.
- Secure the containers.
- Secure your code.
- Secure your Prometheus Metrics!
Sysdig makes Kubernetes troubleshooting much easier by putting this information at your fingertips! Register now for the free Sysdig Monitor trial and start getting detailed information right away with our industry-leading Kubernetes monitoring product.