Introduction
A
wise man once said, “with great power comes great responsibility.” Here at Sysdig, we take this saying to heart, constantly taking on the responsibility to make our
powerful product easier to use and navigate to ensure our users are getting the best experience possible. The latest feature we’ve rolled out to users is our Overview page which will give you a 10,000 foot view of your environment right when you log in and let you drill down into specific areas of interest, all without you needing to configure any dashboards or widgets.
Reducing Mean-Time-To-Pretty-Charts (MTTPC)
Most monitoring tools extol the virtues of their solution in the context of helping streamline the troubleshooting process and reducing mean-time-to-resolution (MTTR). At Sysdig, not only do our
customers report MTTR reductions of upward of 90% in some cases, but with the new Overview page we’ve now invented a new metric to reduce: mean-time-to-pretty-charts (MTTPC). With our dynamically generated Overview page, we’ve reduced the time it takes to see pretty charts to 0 minutes, which means we, on average, reduce MTTPC by 100%. As soon as you install Sysdig Cloud in your environment, you are guaranteed to see these pretty charts without any additional configuration. A 100% reduction in any metric, including those that we’ve completely fabricated for the sake of this blog post, is pretty impressive if we do say so ourselves.
Key Performance Indicators
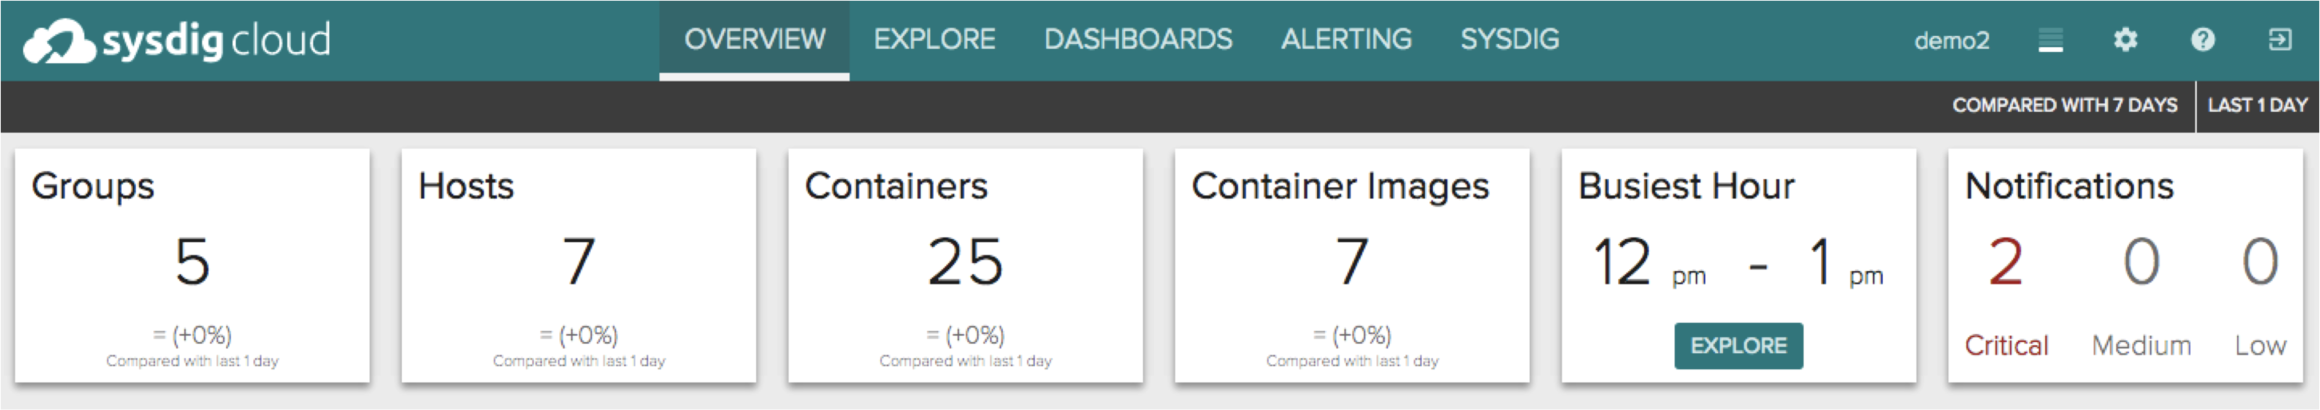
When you first log in to Sysdig Cloud, you’ll notice some useful KPIs at the top of the overview page. These data points provide a great snapshot of the state of your environment right now (and relative to last week).
Now you can quickly answer questions like: * How many more containers am I running today than I was last week? * What was the busiest single hour in my environment so far today? * How many notifications have fired in the last 24 hours that I should know about?
Granular, Container-Native Metrics
Now that we’ve examined the high-level KPIs at the top of the Overview page, let’s take a look at the granular metrics Sysdig Cloud can collect from across your environment, including metrics from inside containers.
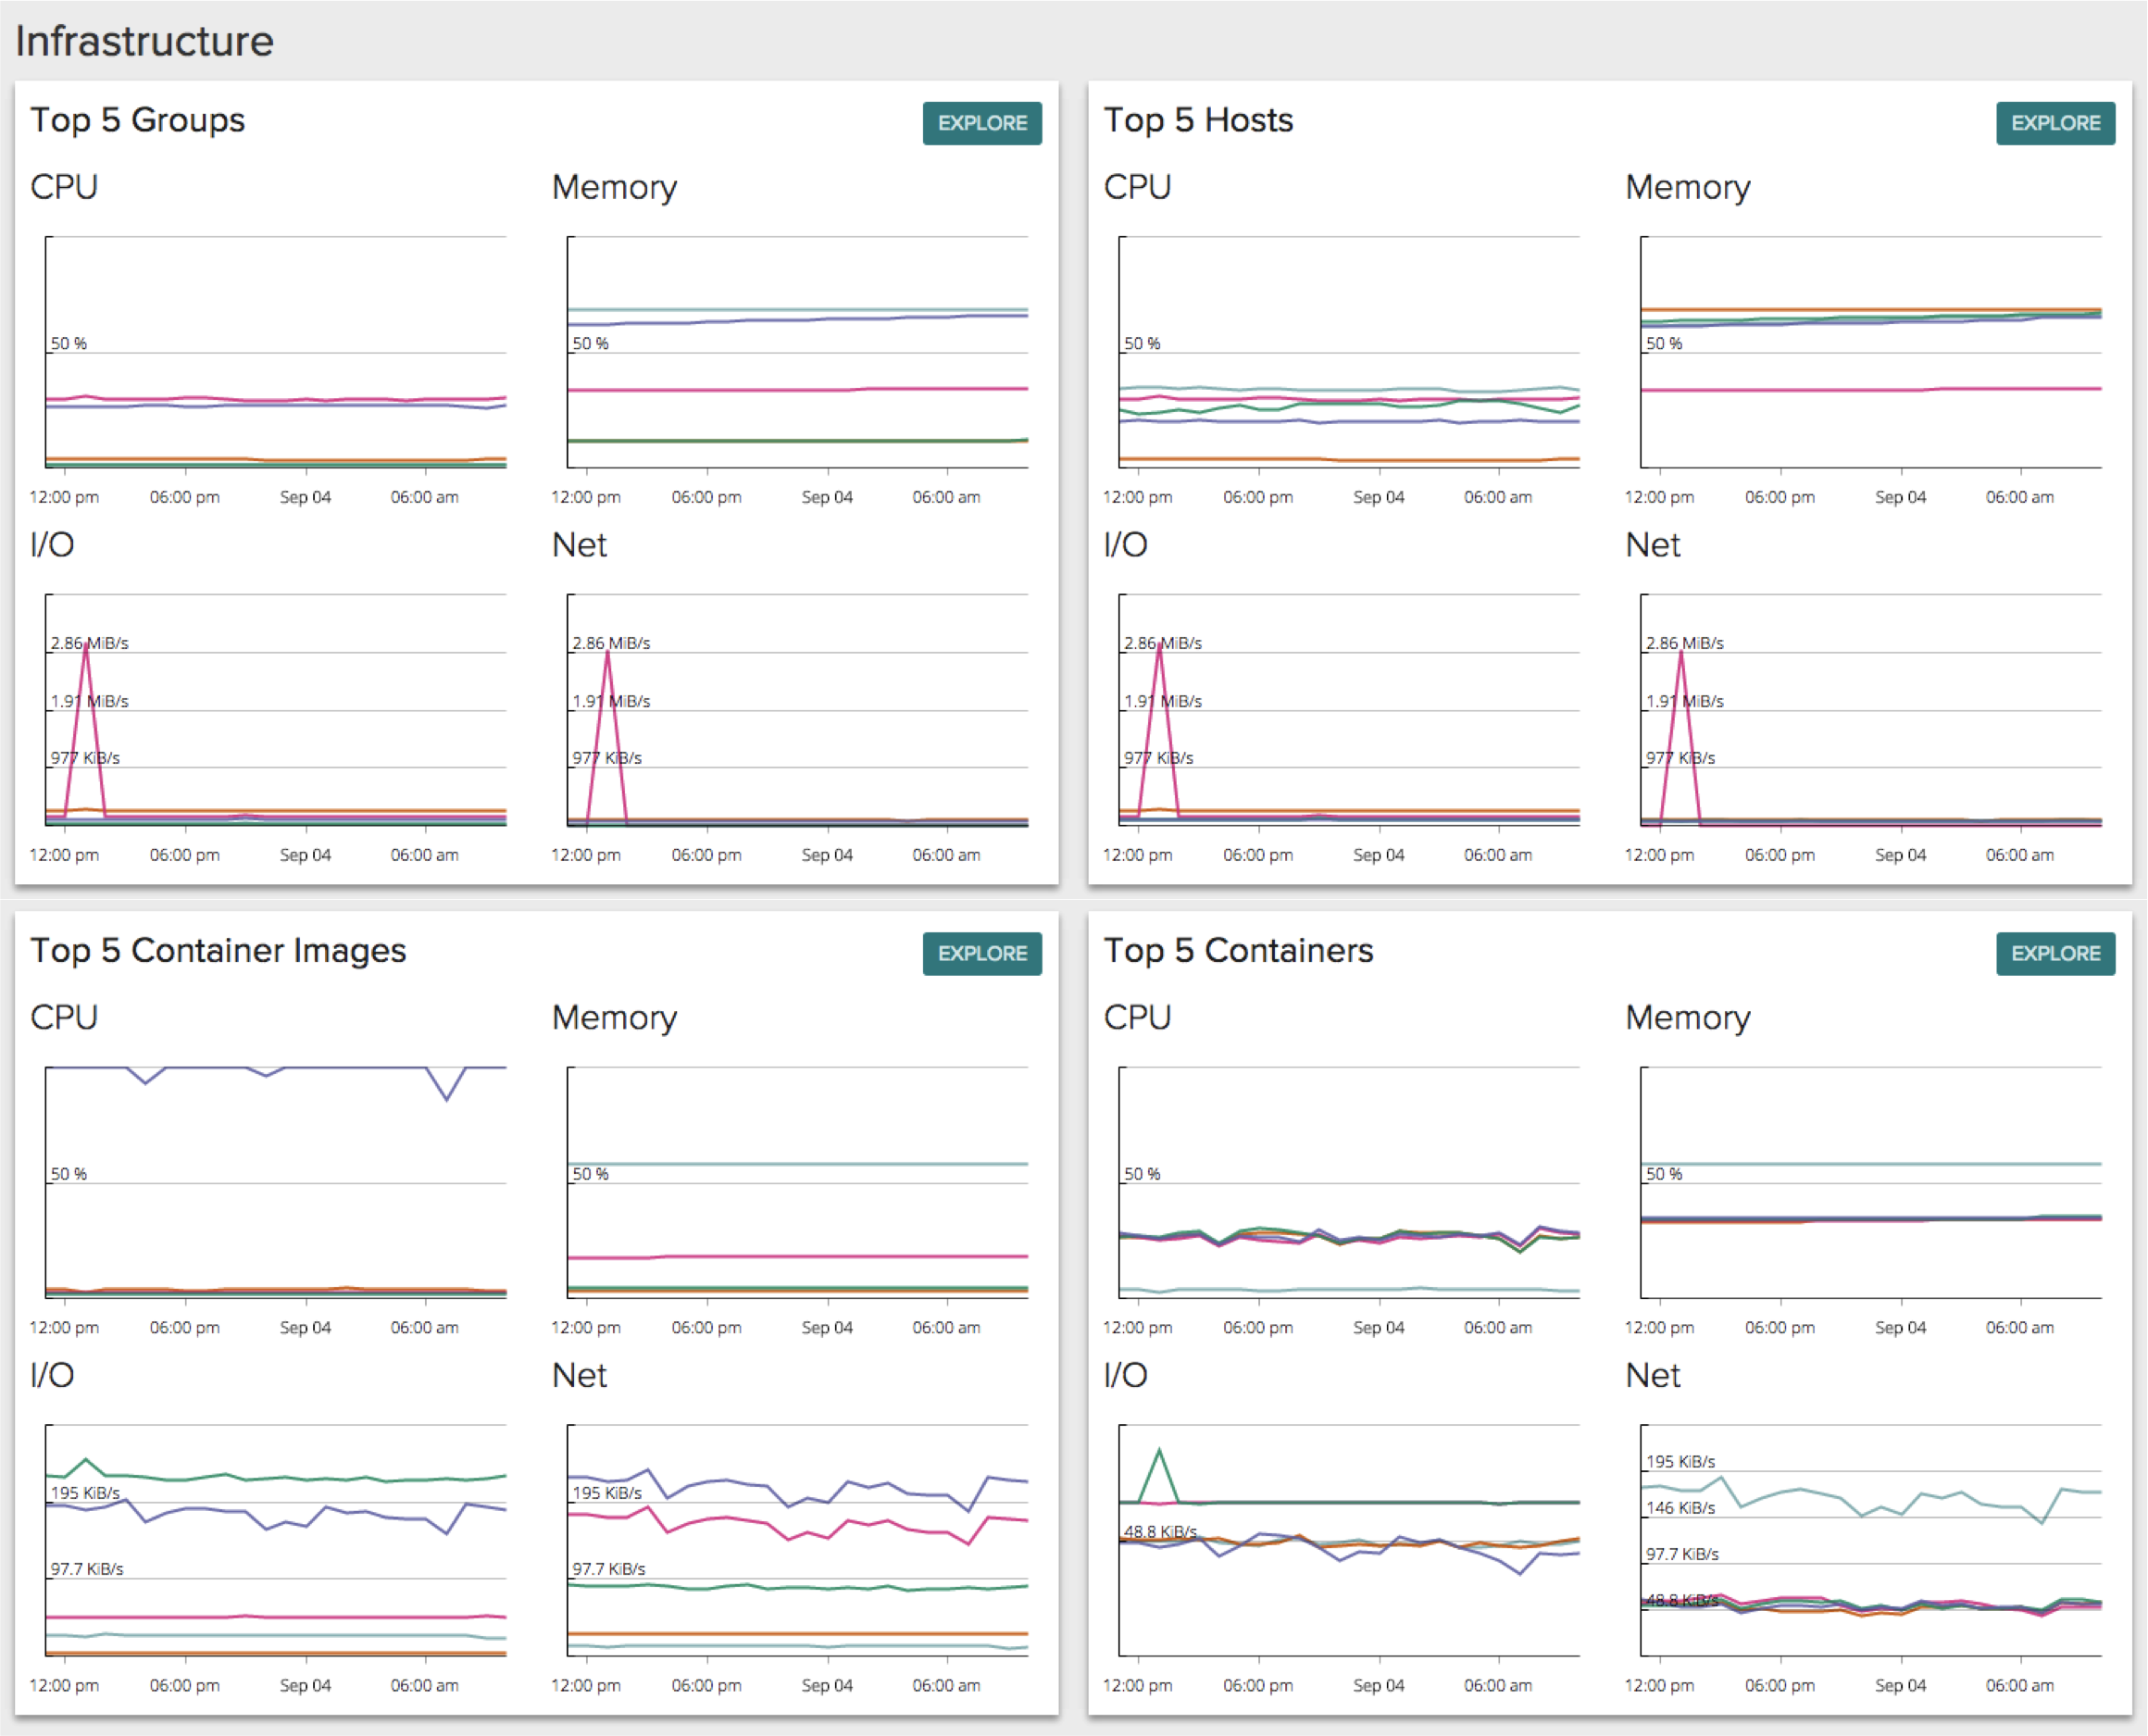
The next section of the Overview page surfaces the Top 5 groups, hosts, container images, and containers in your environment, across a set of core metrics. CPU, Memory, I/O, and Network Bytes give you a good indication of exactly where the hot spots in your environment have been over the past 24 hours. And with all of these metrics automatically correlated together in one container-native view, you can visually inspect what system activity may have been contributing to particular performance issues, including container activity!
It’s worth pointing out that all of these metrics are being collected without the need for any additional instrumentation. Even the container metrics do not require any agents to be installed on each container – we’re able to see inside the containers, from outside the containers themselves. Check out our
container monitoring blog for more information about the unique way we get visibility inside containers.
The next section of the Overview page consists of AWS Service metrics. Sysdig Cloud has a native integration with AWS CloudWatch metrics that allows you to easily extract this AWS data and automatically correlate it with all of the rest of the data from across your containerized environment.
For EC2 and RDS you are able to analyze CPU and Write Throughput metrics. For ELB you are able to see Requests and Errors flowing through the Amazon load balancer. And finally, for ElastiCache, you can view CPU and Network Bytes Out metrics.

Sysdig Cloud’s
container-native monitoring, alerting, and troubleshooting solution allows you to analyze all of these metrics, with full context of all the other components running in your environment, so you can get a holistic, real-time overview of the health of your environment without the need for any additional instrumentation.
Latest Notifications
The last section of the new Overview page is the Latest Notifications section. This will show you, at a glance, what notifications have fired in the last 24 hours. The panel includes the following information: * Severity * Time * Alert name * Scope * Condition * Actual value
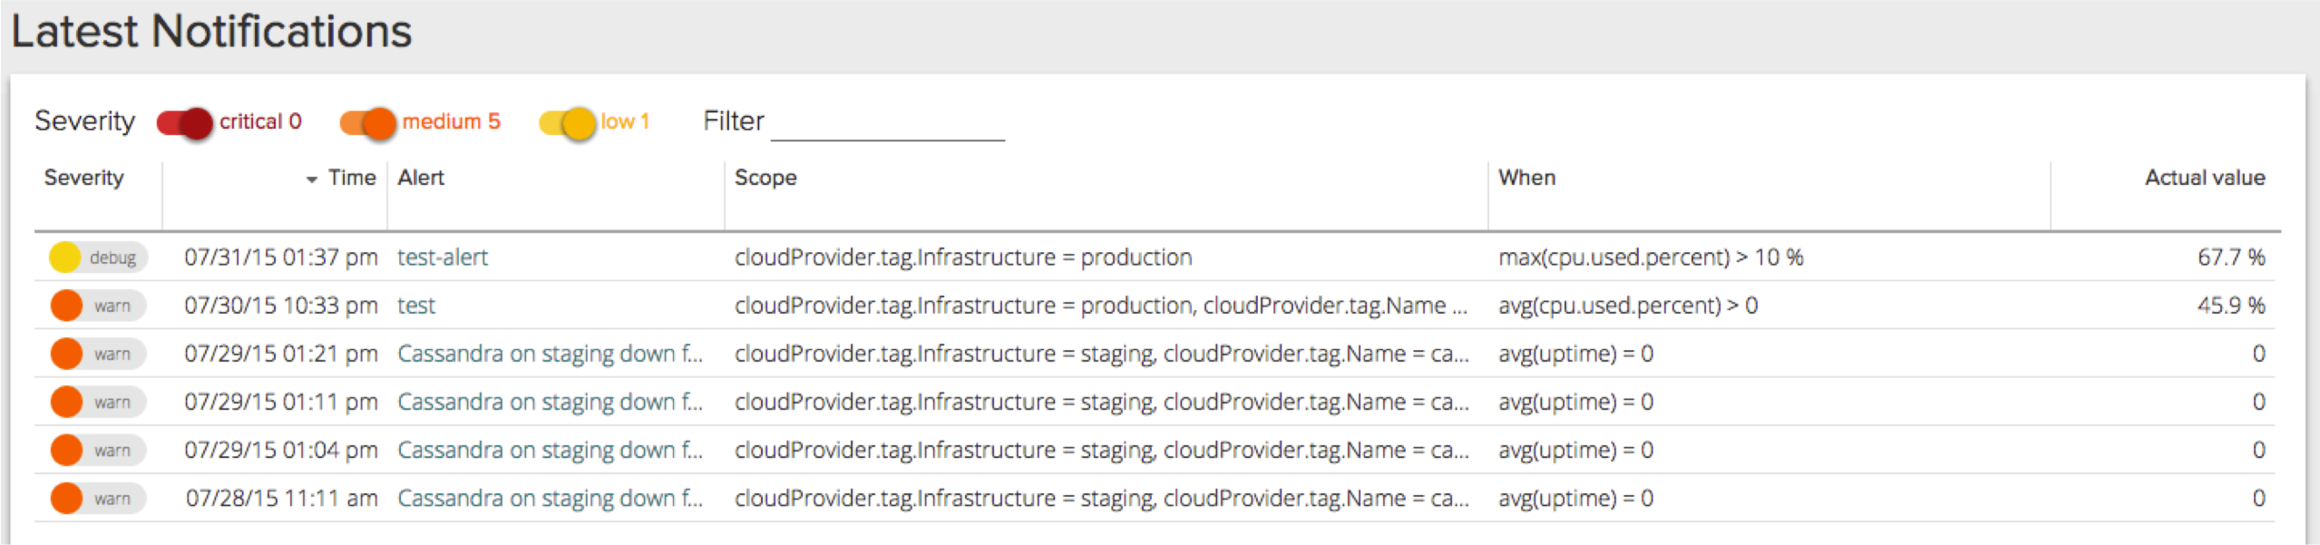
Not only can you see the alerts listed, but you can easily drill down and explore each individual alert.
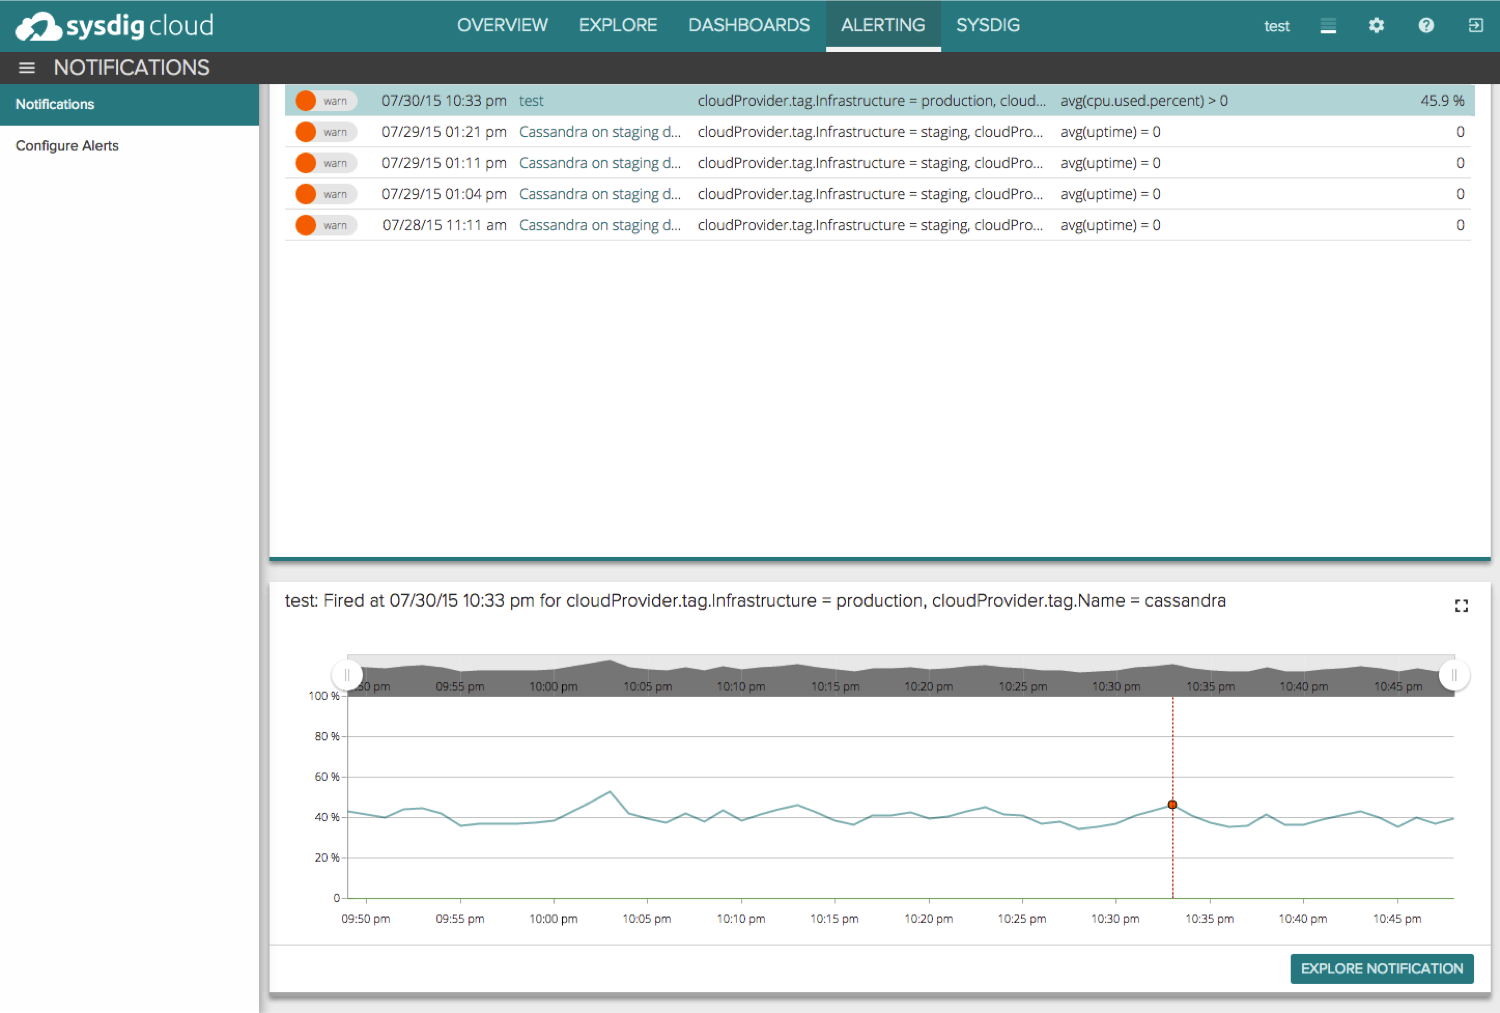
At this point you can click Explore Notification and go back to the exact point in time when this alert fired to retroactively troubleshoot the issue.
Conclusion
As you can see, Sysdig Cloud’s new Overview page provides a high level perspective on your environment yet gives you the ability to drill down on any metric to understand the underlying cause of performance issues. And through Sysdig Cloud’s container-native approach, you get container metrics right alongside the metrics from the rest of your environment, ensuring you get full context when investigating any notifications or performance issues in your environment, all dynamically generated for you with no setup or configuration. To test drive the dynamically generated Overview dashboard for yourself,
sign up for a free 14-day trial of Sysdig Cloud today!
