


Falco Feeds extends the power of Falco by giving open source-focused companies access to expert-written rules that are continuously updated as new threats are discovered.

Prometheus alerts: Sysdig ♥ Prometheus (part II)
If you already use (or plan to use) Prometheus alerts and events for application performance monitoring in your Docker / Kubernetes containers, you can easily integrate them with Sysdig Monitor via the Alertmanager daemon, we will showcase the integration in this post.You can consider this piece the second part to the "Prometheus metrics: instrumenting your app with custom metrics and autodiscovery on Docker containers" blog post, where we detailed how to integrate custom Prometheus metrics.
Prometheus alert integration for your Docker and Kubernetes monitoring needs
Prometheus provides its own alerting system using a separate daemon called Alertmanager. What happens if you already have a Prometheus monitoring infrastructure for APM and plan to integrate the Sysdig container intelligence platform? (Or the other way around).They can work together without any migration or complex adaptation efforts, actually, there is a lot to be gained from the combination of application-specific custom Prometheus monitoring that your developers love and deep container and service visibility provided by Sysdig.These two contexts together add more dimensions to your monitoring data. To illustrate what we mean: You can easily detect that the MapReduce function on your backend container is taking longer than usual because your kubernetes.replicas.running < kubernetes.replicas.desired, the horizontal container scaling is failing and thus, the container that fired the alarm is receiving an order of magnitude more work. #Winning Manage infrastructure and application performance monitoring alerting by integrating @PrometheusIO alerts with Sysdig Monitoring Click to tweet
Metrics Exporters, Prometheus, Alertmanager & Sysdig integration
Docker monitoring scenario
To put things in context let's assume that you already have a Docker environment instrumented with Prometheus:
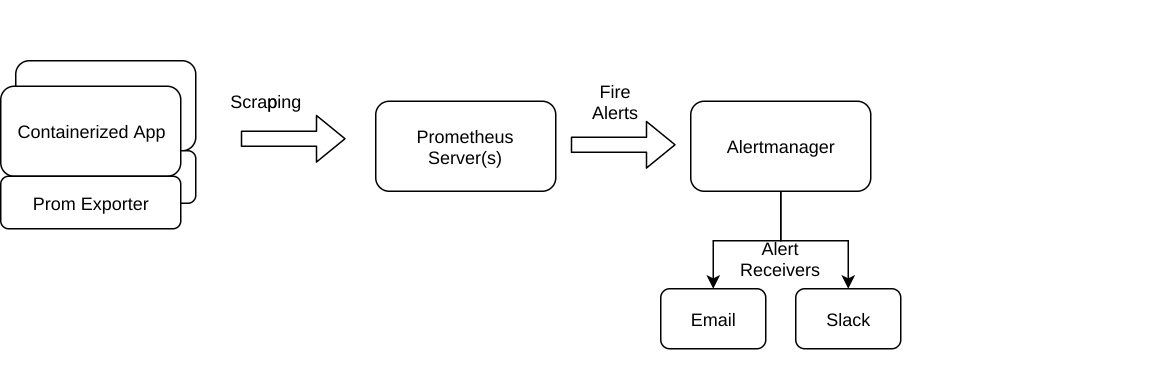
It could be Swarm, Kubernetes, Amazon ECS… whatever you're using our integration with prometheus works the same way.Simplifying, you have several exporters that emit metrics, the Prometheus server aggregates them and checks the alert conditions, if those conditions are met, it sends the configured alert to Alertmanager. Alertmanager is in charge of alert filtering, silencing, cooldown times and also sending the alert notifications to its receivers, mail and slack chat in our example.One of the available receivers for Alertmanager is a webhook, this method boils down to HTTP POSTing a JSON data structure. Its simplicity and standard format provide a lot of flexibility to integrate any pair of producer / consumer software.Accordingly, this is what we want to deploy:
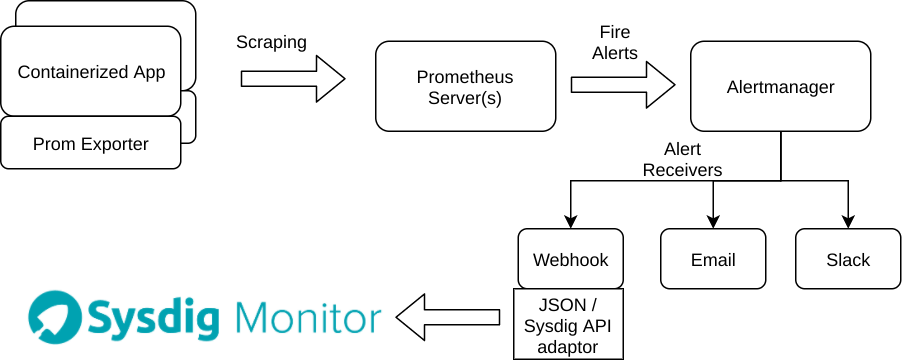
A new webhook AlertManager receiver that retrieves the JSON, reformats it to adapt to the Sysdig API function and uploads the alert data to Sysdig Monitor, is really just that. The interesting bit is that you don't have to modify the monitoring / alerting infrastructure you already have. It's just a new data output.Let's create an easily reproducible, please-do-try-this-at-home scenario:
Prometheus Metric Exporter
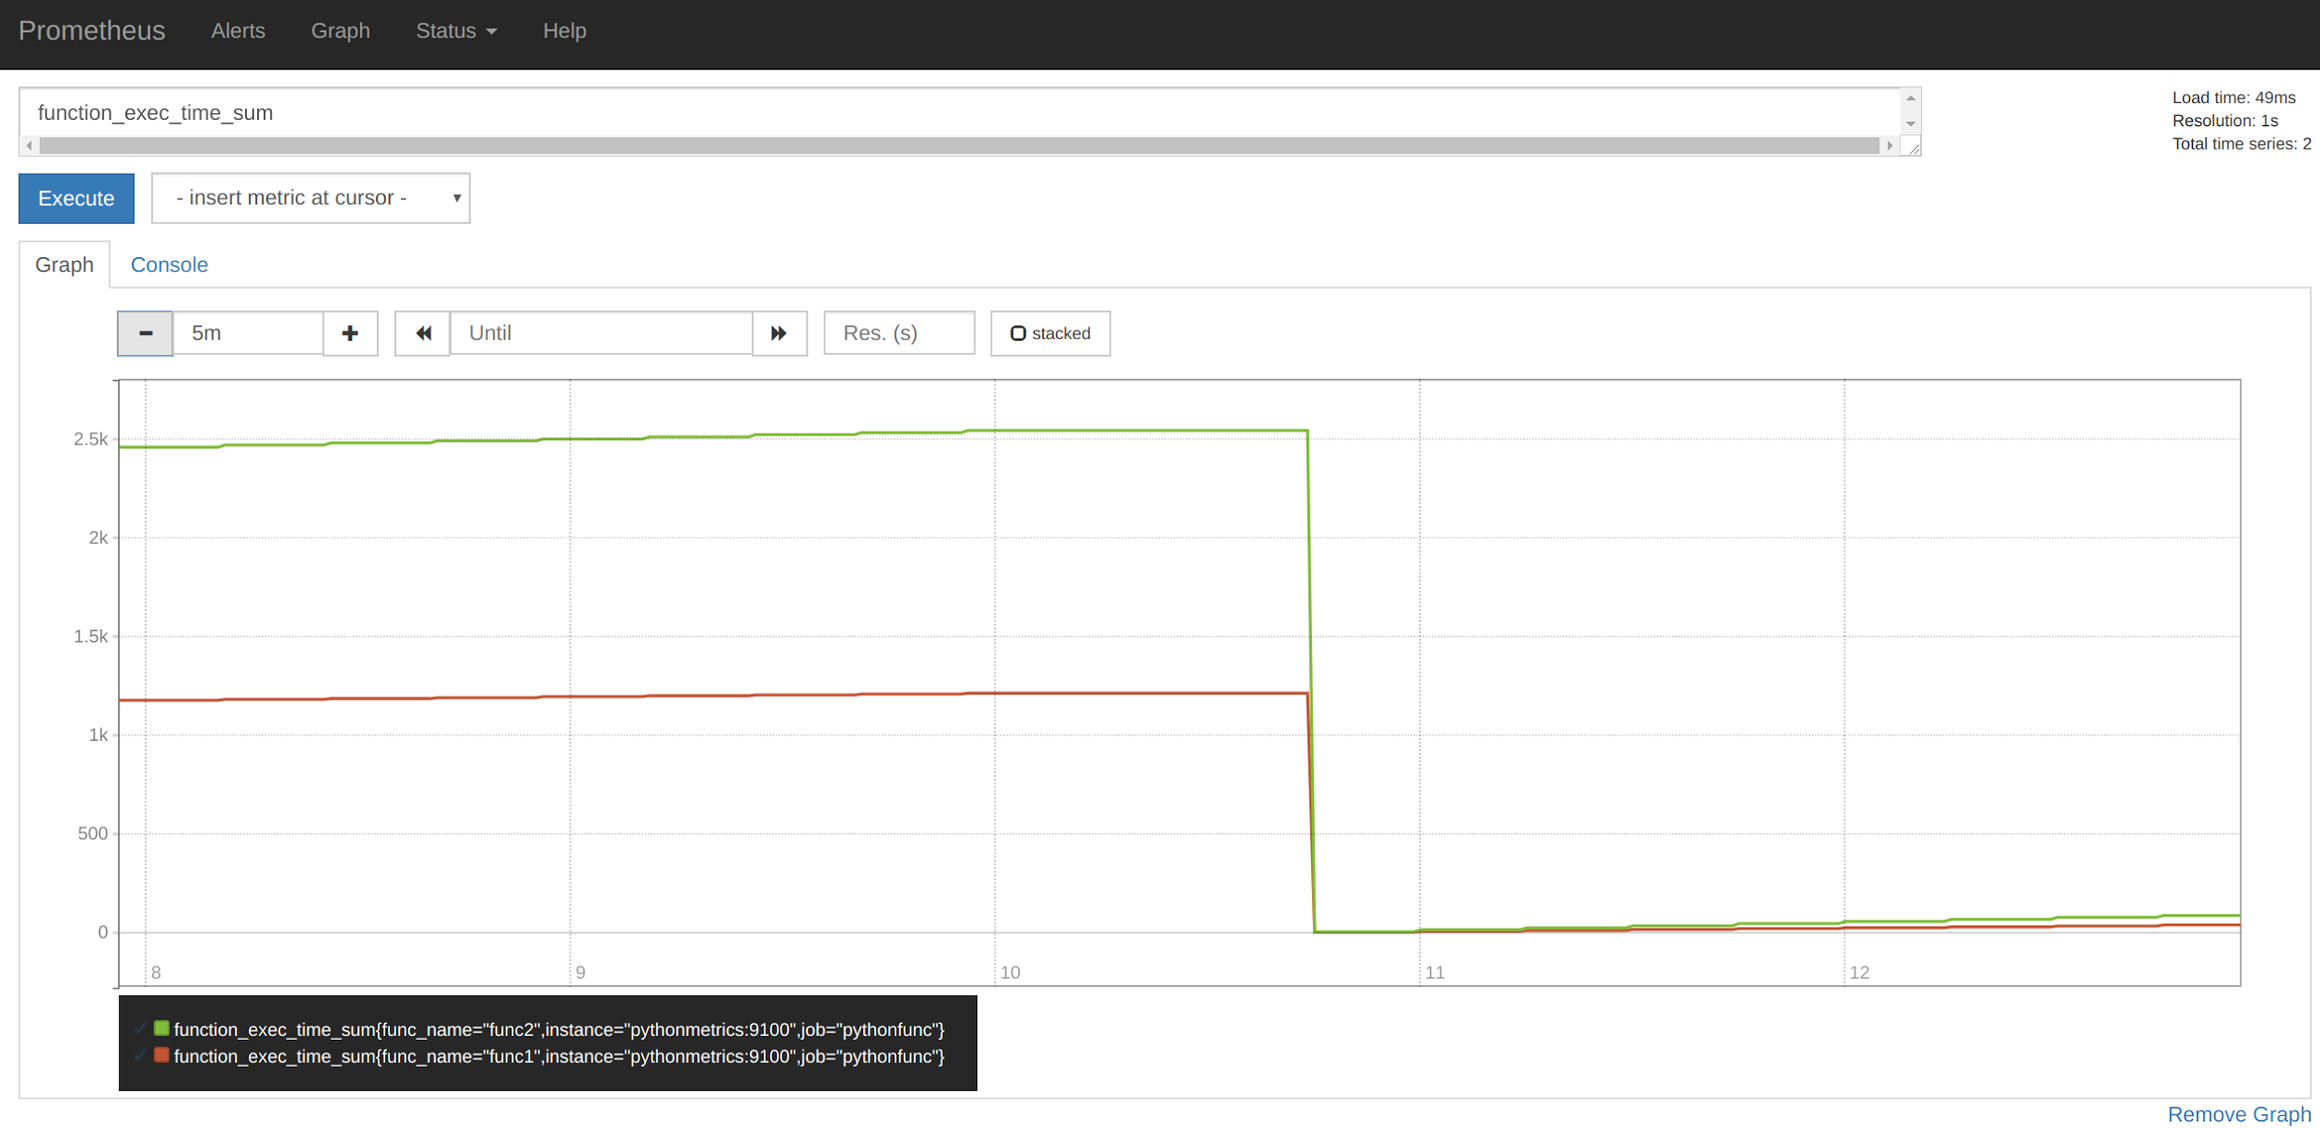
First, we need some data to be scrapped. You can reuse the trivial python script from the last article to get some available metrics.You can get it as a docker container:docker run -d -p 9100:9100 mateobur/pythonmetricIf you try:curl localhost:9100You should see some raw metrics:...
function_exec_time_count{func_name="func1"} 53.0
function_exec_time_sum{func_name="func1"} 10.620916843414307
function_exec_time_bucket{func_name="func2",le="0.005"} 0.0
function_exec_time_bucket{func_name="func2",le="0.01"} 0.0
function_exec_time_bucket{func_name="func2",le="0.025"} 0.0
...
Prometheus server & alerts
Next, we are going to configure the Prometheus server itself. Take a look to the Prometheus alerting guide if you want to go further than this example.We are going to modify three sections of the main configuration file.First, we declare the metrics endpoint we just mentioned: - job_name: 'pythonfunc'So prometheus will regularly scrape it.Second, we declare a rule configuration file to load:
# metrics_path defaults to '/metrics'
# scheme defaults to 'http'.
static_configs:
- targets: ['pythonmetrics:9100']rule_files:And third, we list the Alertmanager where we want to deliver our alerts:
- "/etc/prometheus/alerts.yml"alerting:This configuration requires that the Prometheus container is able to resolve the pythonmetrics and alertmanager hostnames, don't worry much about it, using the docker-compose file we provide below, everything should work out of the box.This is the alerts.yml we are going to use for the example:
alertmanagers:
- static_configs:
- targets:
- alertmanager:9093groups:Nothing too surprising here, it has a name, a description, a condition to fire expressed in the internal Prometheus language and a time bucket to evaluate.We are going to use the annotations as scope for our Sysdig alert, our webhook script will also translate the '_' to '.' characters (they are not valid as annotation name), so we can have the exact same names than native Sysdig alerts.
- name: example
rules:
- alert: Function exec time too long
expr: function_exec_time_sum{job="pythonfunc"} > 0.5
for: 1m
annotations:
severity: 5
container_name: nginx-front
host_mac: 08:00:27:b2:06:e8
container_id: 8c72934ff648
host_hostName: dockernode
description: Function exec time too long
labels:
source: docker
Alertmanager & webhook receivers – Prometheus alerts integration
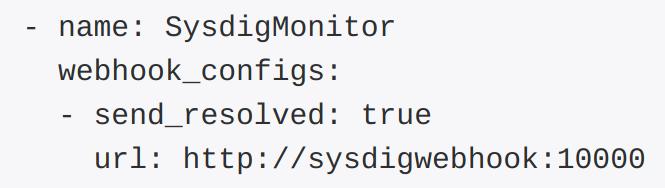
The third piece of this puzzle is the Alertmanager, you can read about its configuration here. Particularly, you can use the different routes and receivers in the routing tree to filter and classify the alerts and, for example, deliver alerts from different parts of your infrastructure to separate Sysdig teams.In this example we are just going to configure a default webhook receiver: # A default receiverAnd define it here:
receiver: SysdigMonitor- name: 'SysdigMonitor'Any time the Alertmanager needs to notify about an alert it will send a HTTP POST to that URL endpoint.
webhook_configs:
- url: 'http://sysdigwebhook:10000'
JSON Prometheus alerts to Sysdig API
For the last piece, we just need to catch that JSON output, do some minor rearrangements of the data and call the Sysdig API.These ~30 lines of Python are enough to have a functioning starting point:
File: webhook_receiver.py
-------------------------

from flask import Flask, request
from sdcclient import SdcClient
import json, os

app = Flask(__name__)
sdclient = SdcClient(os.environ['SYSDIG_API_KEY'])


@app.route('/', methods=['POST'])
def handle_alert():
    data = json.loads(request.data)
    alertname = data['groupLabels']['alertname']
    description = data['commonAnnotations']['description']
    severity = int(data['commonAnnotations']['severity'])
    scope = ''
    for key in data['commonAnnotations']:
        if key == "description" or key == "severity":
            continue
        newname = key.replace('_', '.')
        scope += newname + ' = "' + data['commonAnnotations'][key] + '" and '
    tags = data['commonLabels']
    response = sdclient.post_event(alertname, description, severity,
                                   scope[:-4], tags)
    if not response[0]:
        print "Error: " + response[1]
    return "OK"


if __name__ == '__main__':
    app.run(app.run(host='0.0.0.0', port=10000))
Complete integration with Docker-compose
To spawn all the pieces of this example at once in a more convenient way, you can just use this docker-composefile.Just fill out the SYSDIG_API_KEY variable with your token string, and spawn itdocker-compose up -dLet's take a look at every step:Accessing http://localhost:9100 you should see the raw metrics again, as we mentioned earlier.Accessing http://localhost:9090/ you get the Prometheus interface
If you click on the Alerts tab:
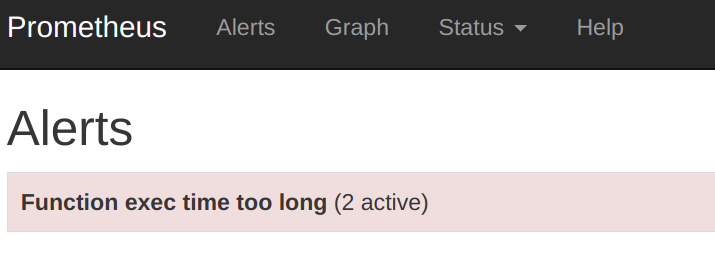
Your alert has fired, nice.Next step, you have the Alertmanager interface at http://localhost:9093
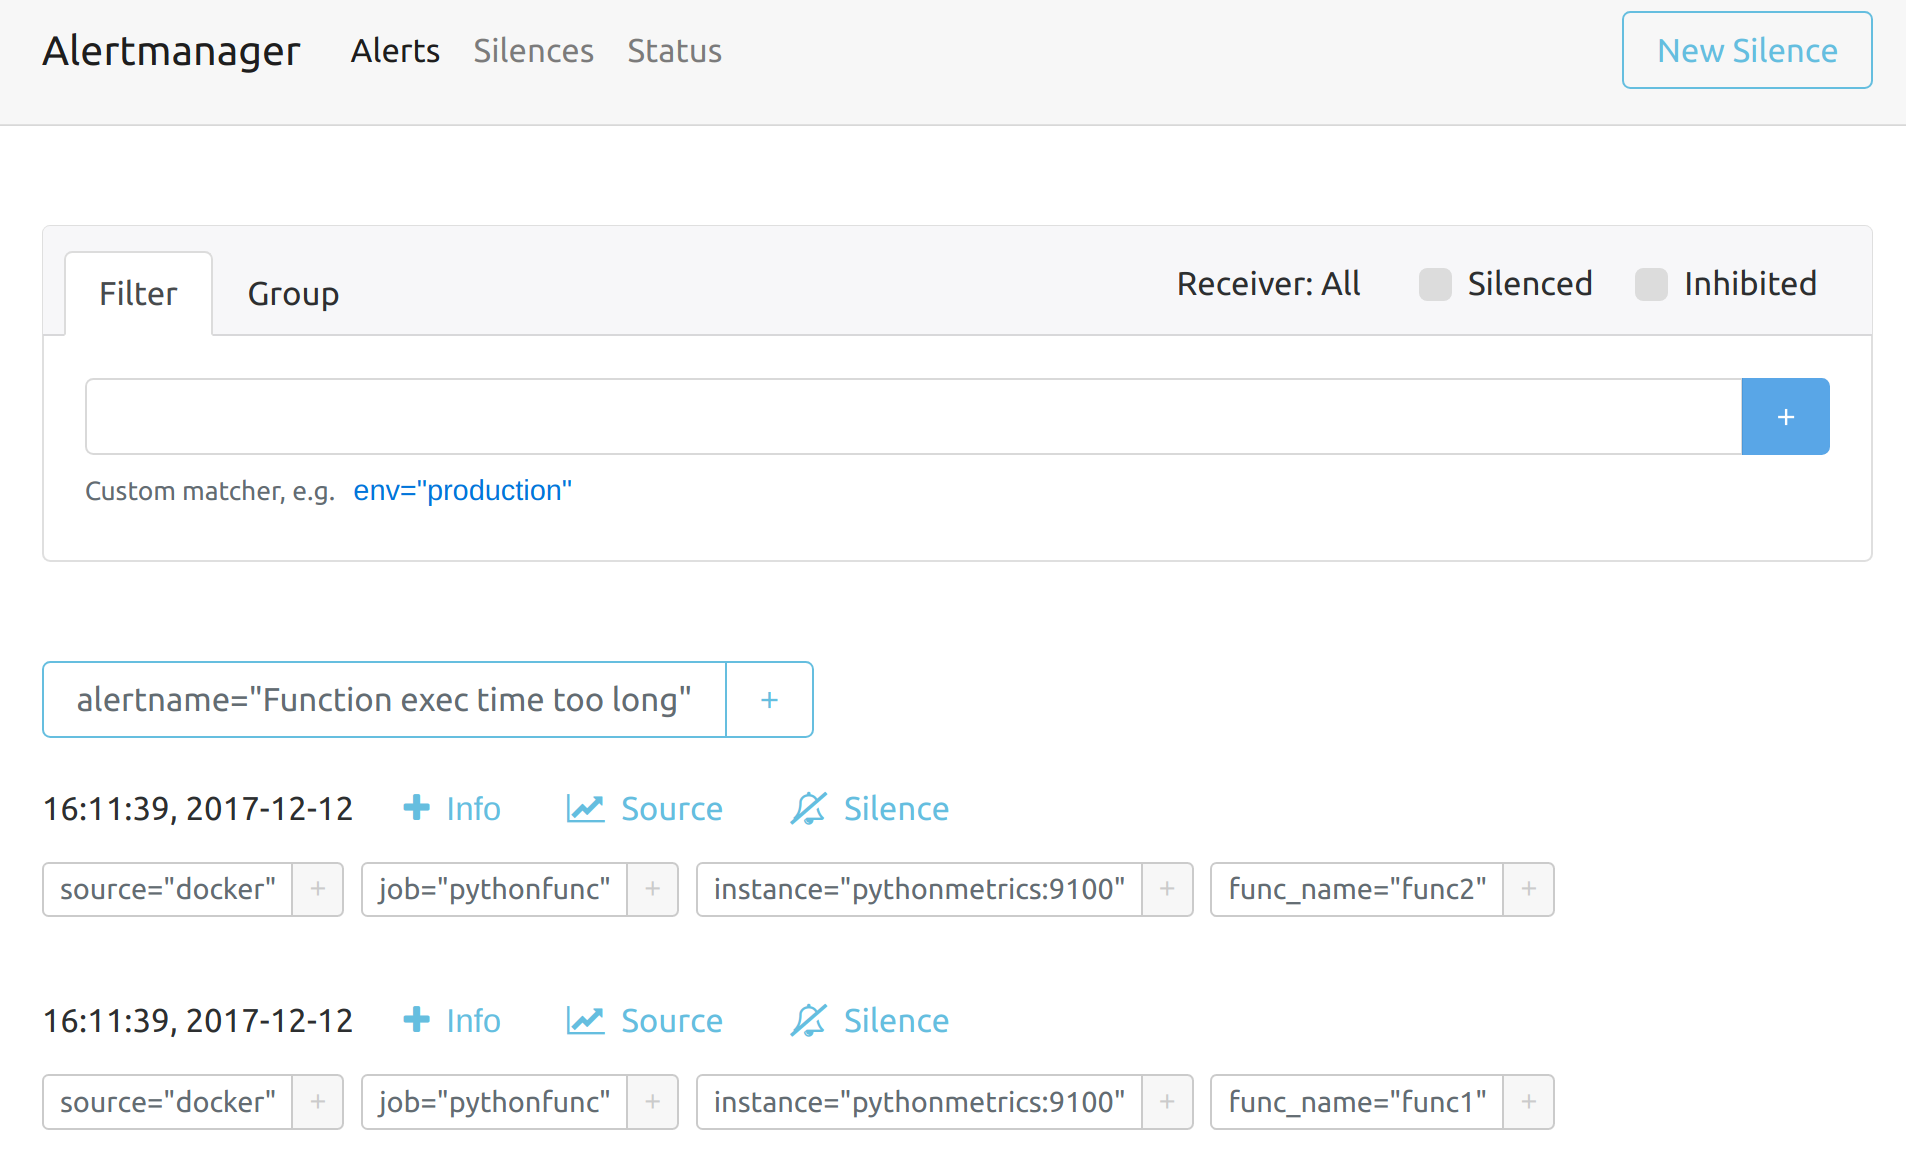
It looks like the Alertmanager is taking care of our alerts, if you click on Status, you can see the current configuration file with the routing tree and receivers.
Let's take a look at the docker-compose logs:$ docker-compose logsYour sysdigwebhook container has received a HTTP POST from the Alertmanager.And the last and most important part, if you open your Sysdig Monitor Panel:
Attaching to sysdigwebhook_1, promserver_1, alertmanager_1, pythonmetrics_1
sysdigwebhook_1 | * Running on http://0.0.0.0:10000/ (Press CTRL+C to quit)
sysdigwebhook_1 | 172.19.0.3 - - [12/Dec/2017 15:09:09] "POST / HTTP/1.1" 200
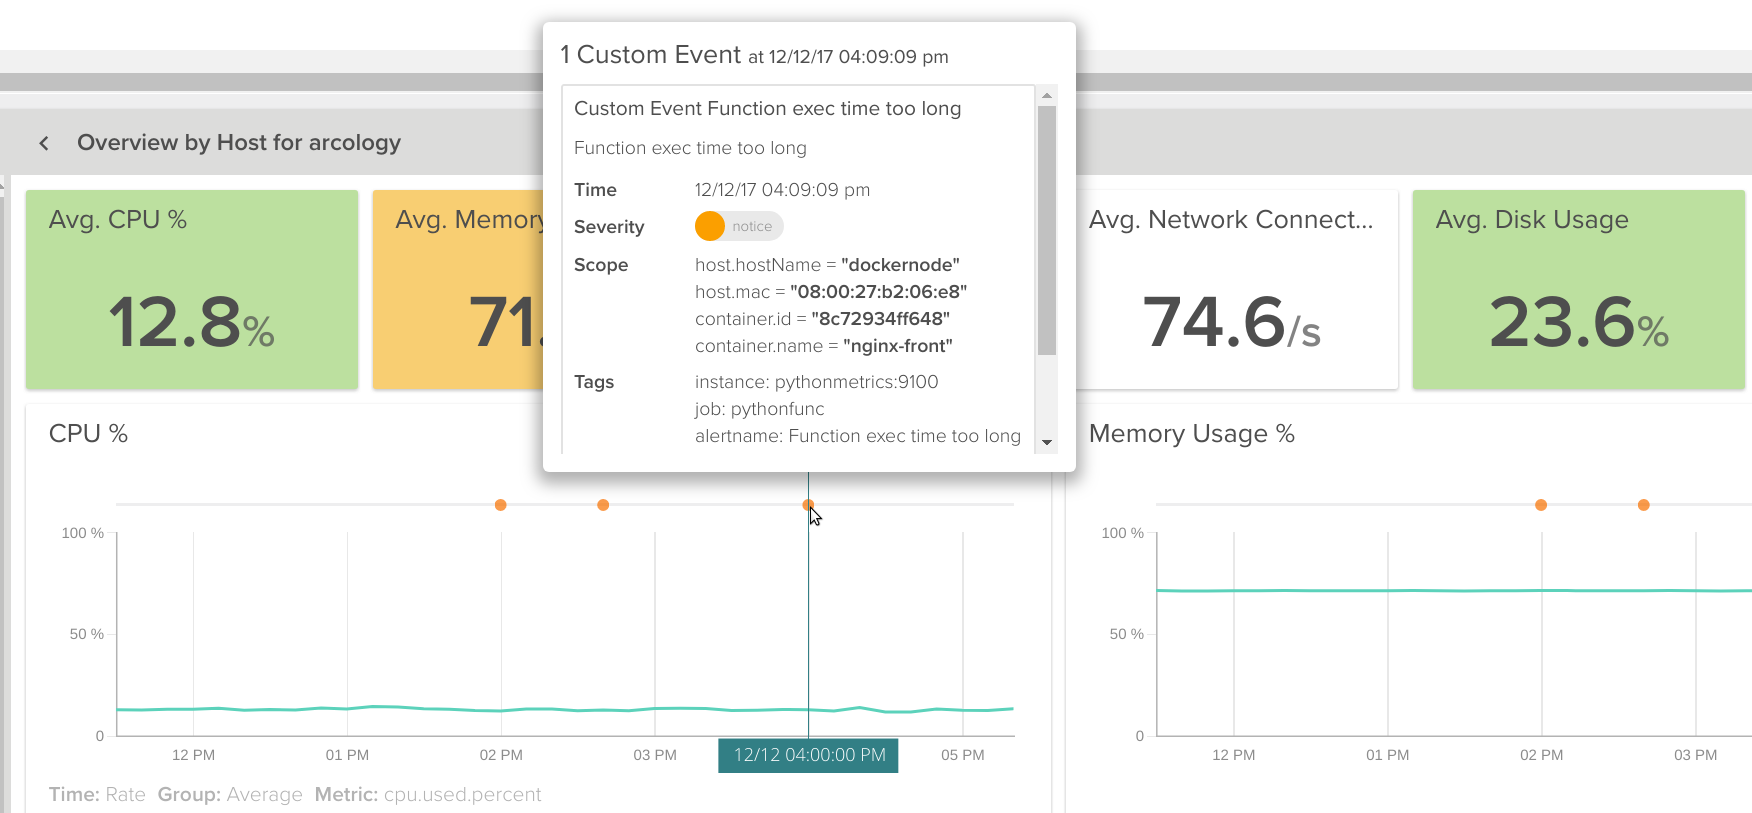
There it is!Your custom event will full scope and tags, on top of any other Sysdig metric you need to correlate.
Supercharge Debugging
By adding multi-dimensional scope to your metrics and dashboards you can supercharge your debugging capacity and find data correlations that are extremely arduous to discover manually.Also, webhooks are incredibly useful to easily integrate microservices.The webhook receiver code is just a PoC, you can use it as an starting point, but make sure to add exception handling and fallback routines if you plan to do anything more serious than a local test.Prometheus and Alertmanager are opensource and you can also get a free trial of Sysdig Monitor right away.