


Falco Feeds extends the power of Falco by giving open source-focused companies access to expert-written rules that are continuously updated as new threats are discovered.

While the term 'Java troubleshooting' can apply to many, many scenarios, this post focuses on three particular long-standing Java production scenarios: a denial of service to a Java service endpoint, a memory leak, and troubleshooting a thread deadlock or race condition.Follow along as we use Java inside Docker containers to facilitate quick testing and show you how to use open source sysdig to quickly diagnose each troubleshooting scenario. A #Java troubleshooting guide: three common debugging scenarios – network bottlenecks, memory leaks and thread locking – that you can diagnose using open source tools. Click to tweet
Troubleshooting Java network bottlenecks and denials of service
Every computing resource is limited, and the limitation your application users will feel the hardest is request latency.High request latency can be caused by a surge in client requests, a software bug, a capacity miscalculation, or intentional resource abuse (denial of service). But you don't have to wait until your users start complaining to detect that your application endpoints are overwhelmed and becoming unresponsive.To test request latency yourself, launch a Java application that exposes a web port with using your own code or with this dockerized toy app:docker run -d -p 8080:8080 mateobur/javatroubleshooting1This app will be listening on http://localhost:8080 (just use your browser if you want to take a look).Next, you want to simulate a sudden increase in requests. There are many HTTP stress testing tools available for free. Here, we're using the popular Apache Benchmark:ab -t 60 -n 10000000 -c 500 -s 1 http://localhost:8080/This will generate a very high load on your server for about a minute. If you have monitoring and alerting in place, this anomaly should be detected. In this example, we're using Sysdig Monitor for Java troubleshooting.One of the first basic metrics you'll see spike is the total number of HTTP requests per second:
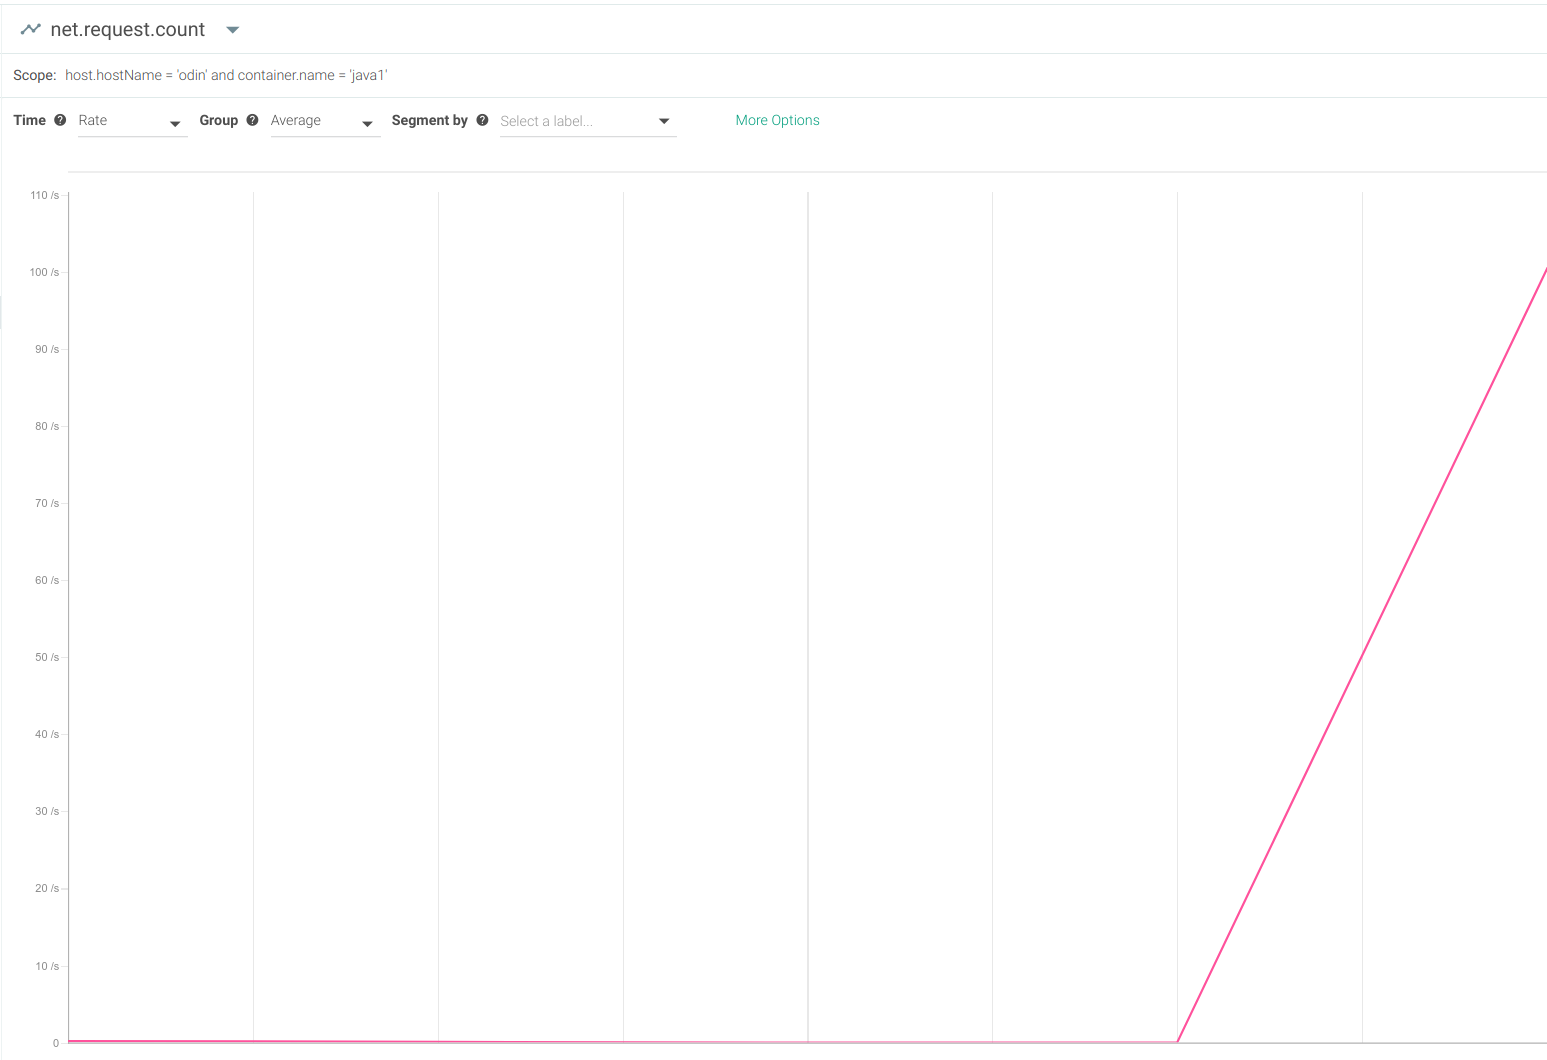
However, this metric on its own isn't all that useful. A surge in HTTP requests itself isn't a bad sign. What you want to know is how your Java application handles it.A more interesting metric to watch would be the request latency (also known as request time):
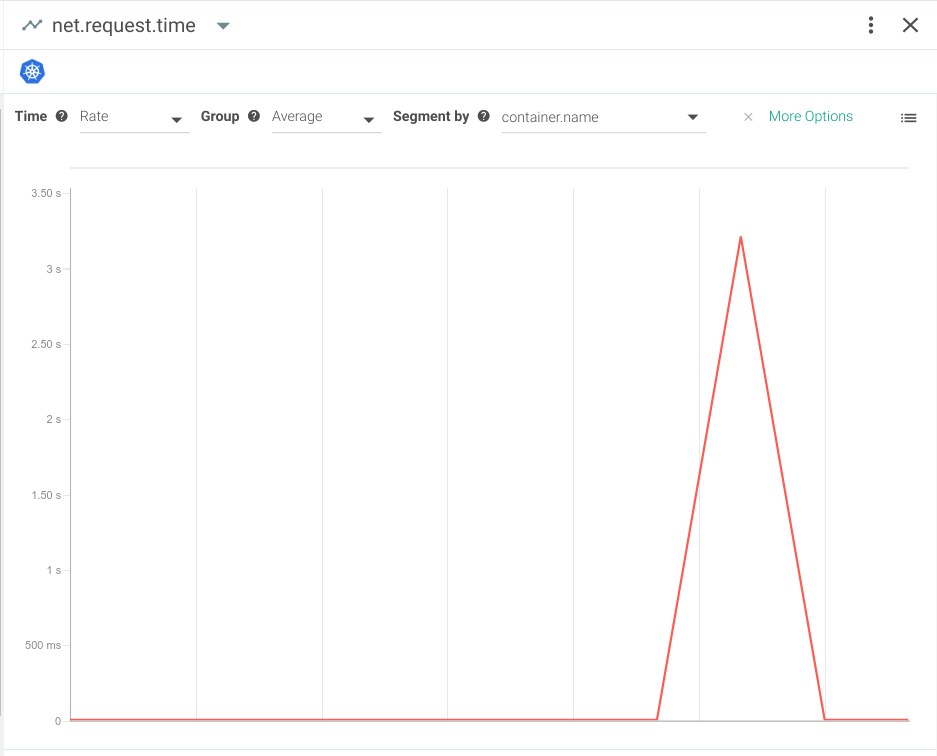
Here, you can see how the average request latency went from a few milliseconds to more than 3 seconds per request. Your users are definitely going to notice this considerable slow down.Percentiles are another useful way to evaluate user experience. Averages can be misleading because they ignore outlying cases where users may be experiencing exceptionally high request latency.This is what the worst case latency (or 100 percentile) would look like:
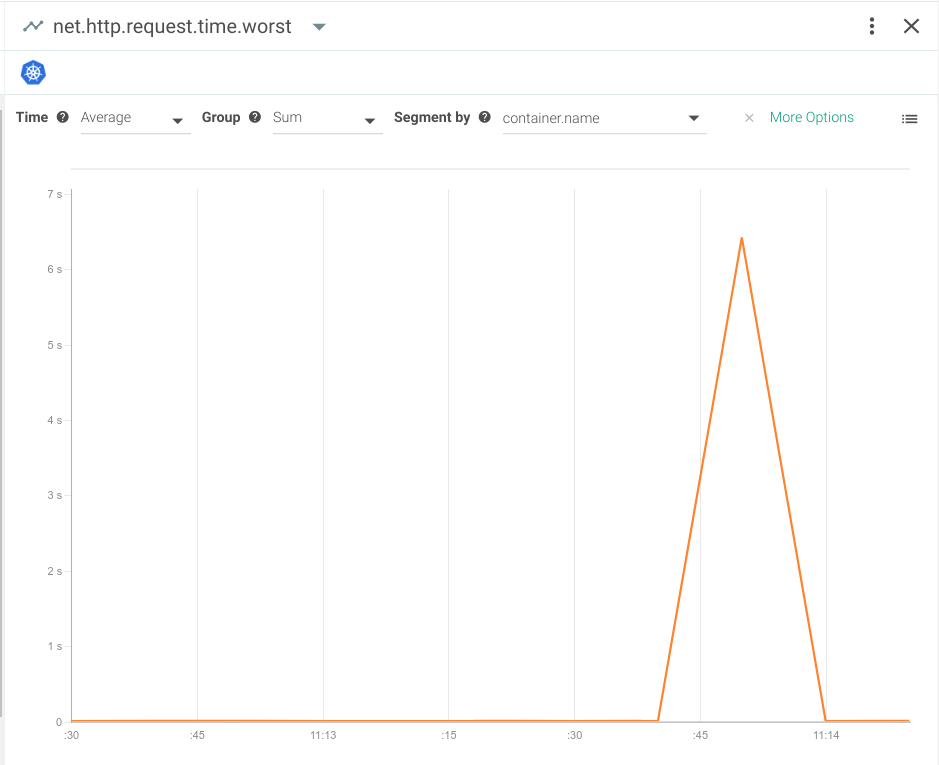
As you can see, the latency in this example is almost 7 seconds! While every application has its own tolerance threshold, the average request typically takes about 5 milliseconds—so we'd say latency in this range should certainly raise some concern.Often, a high request latency is a symptom rather than a root cause.For example, if your database is struggling on I/O, the Java application will respond more slowly because it has to wait for the data before sending the request response.With a good monitoring system, you can always check out the average or worst case request latency in relation to other system metrics like I/O load, memory, CPU load, and more.
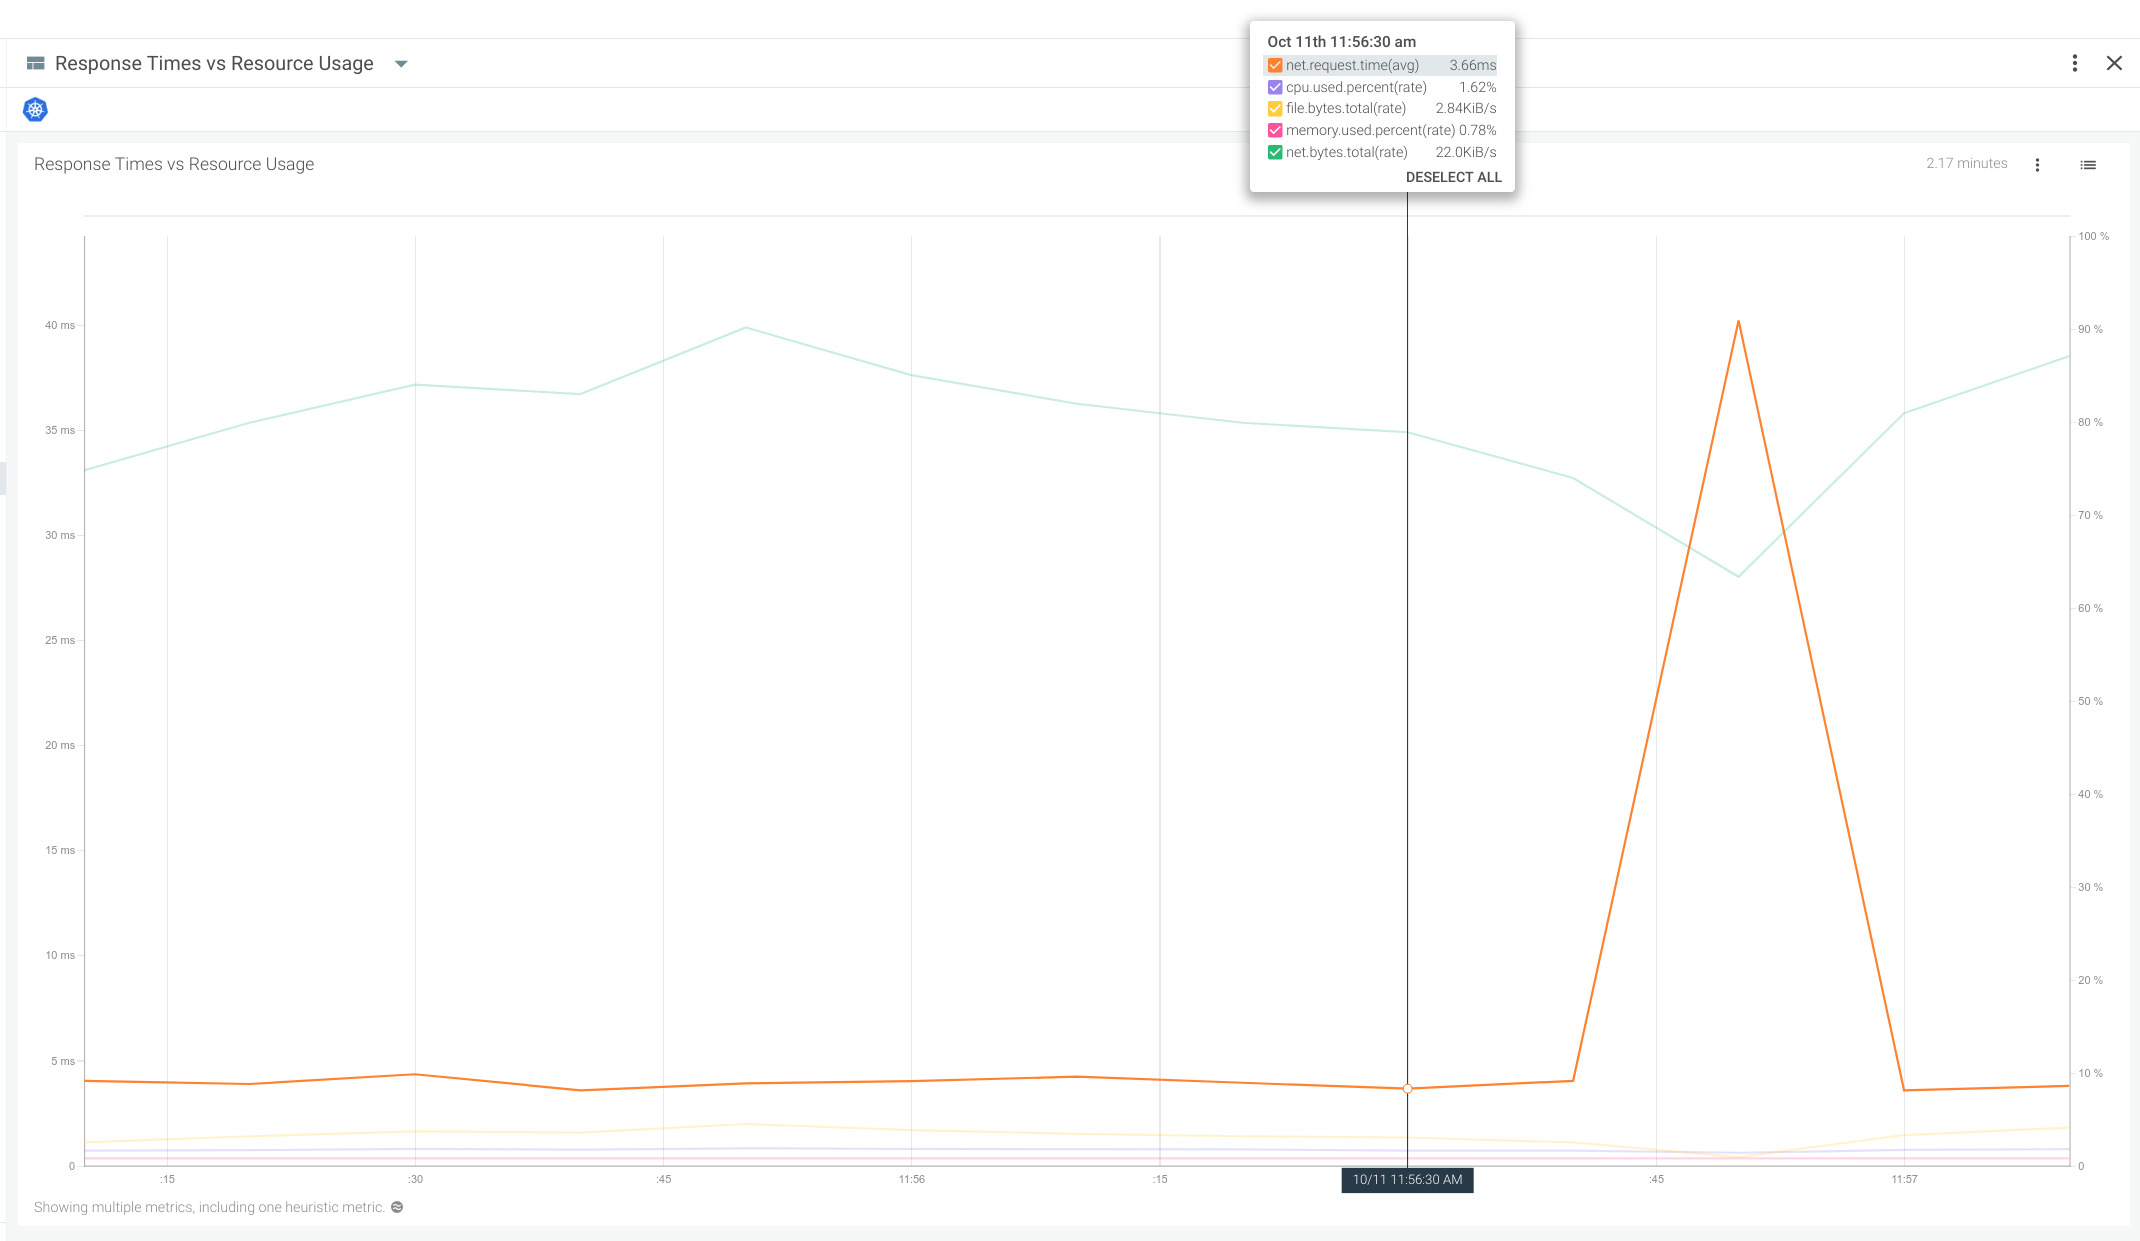
In this case, the surge in network latency is not correlated with a meaningful spike in any of the other system resources. We can conclude that this is purely a network bottleneck situation and not derived from server resource exhaustion.
Troubleshooting memory leaks in Java applications
Consistently-growing memory consumption in Java processes is one of the most pervasive and difficult to troubleshoot issues on long-lived server applications. This is partially due to the fact that small memory leaks are almost undetectable during programming and debugging, but they will continue to build up until they overload your system and crash your application.Open source sysdig makes it easy to observe and troubleshoot Java behaviour to identify memory issues.For this example, we'll start by launching a Java process that has a very noticeable memory leak:docker run -d mateobur/javatroubleshooting2Next we'll capture every system event using sysdig. If you want to wait a couple of minutes after launching the container before starting the system capture, it will make the capture file smaller.docker psNow, let's launch the capture:
CONTAINER ID IMAGE COMMAND CREATED STATUS PORTS NAMES
efeb6af91f3a mateobur/javatroubleshooting2 "java MemoryLeak" 2 minutes ago Up 2 minutessysdig -pc -w javamemleak.scap will use a container-friendly output format and
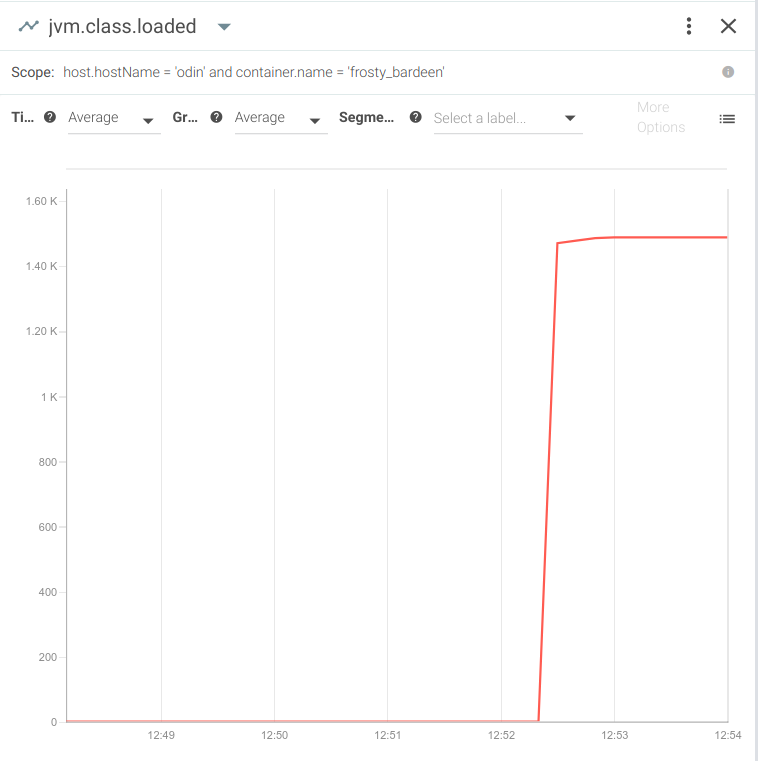
-pc-w specifies the output file for the capture. (For more instructions, check out our full user guide on GitHub.)In a few minutes, this test application and the container (since it's process 1) will both crash. If the app was being monitored, you will be able to see several clues as to what happened.For example, you'd immediately notice the high number of Java classes loaded in the VM:
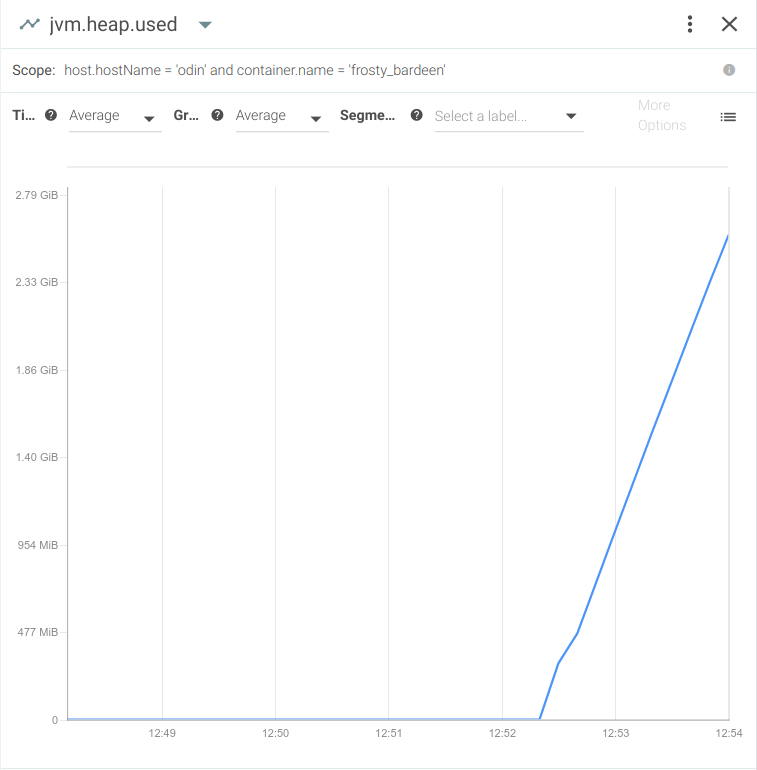
And of course, you'd see a spike in heap memory usage:
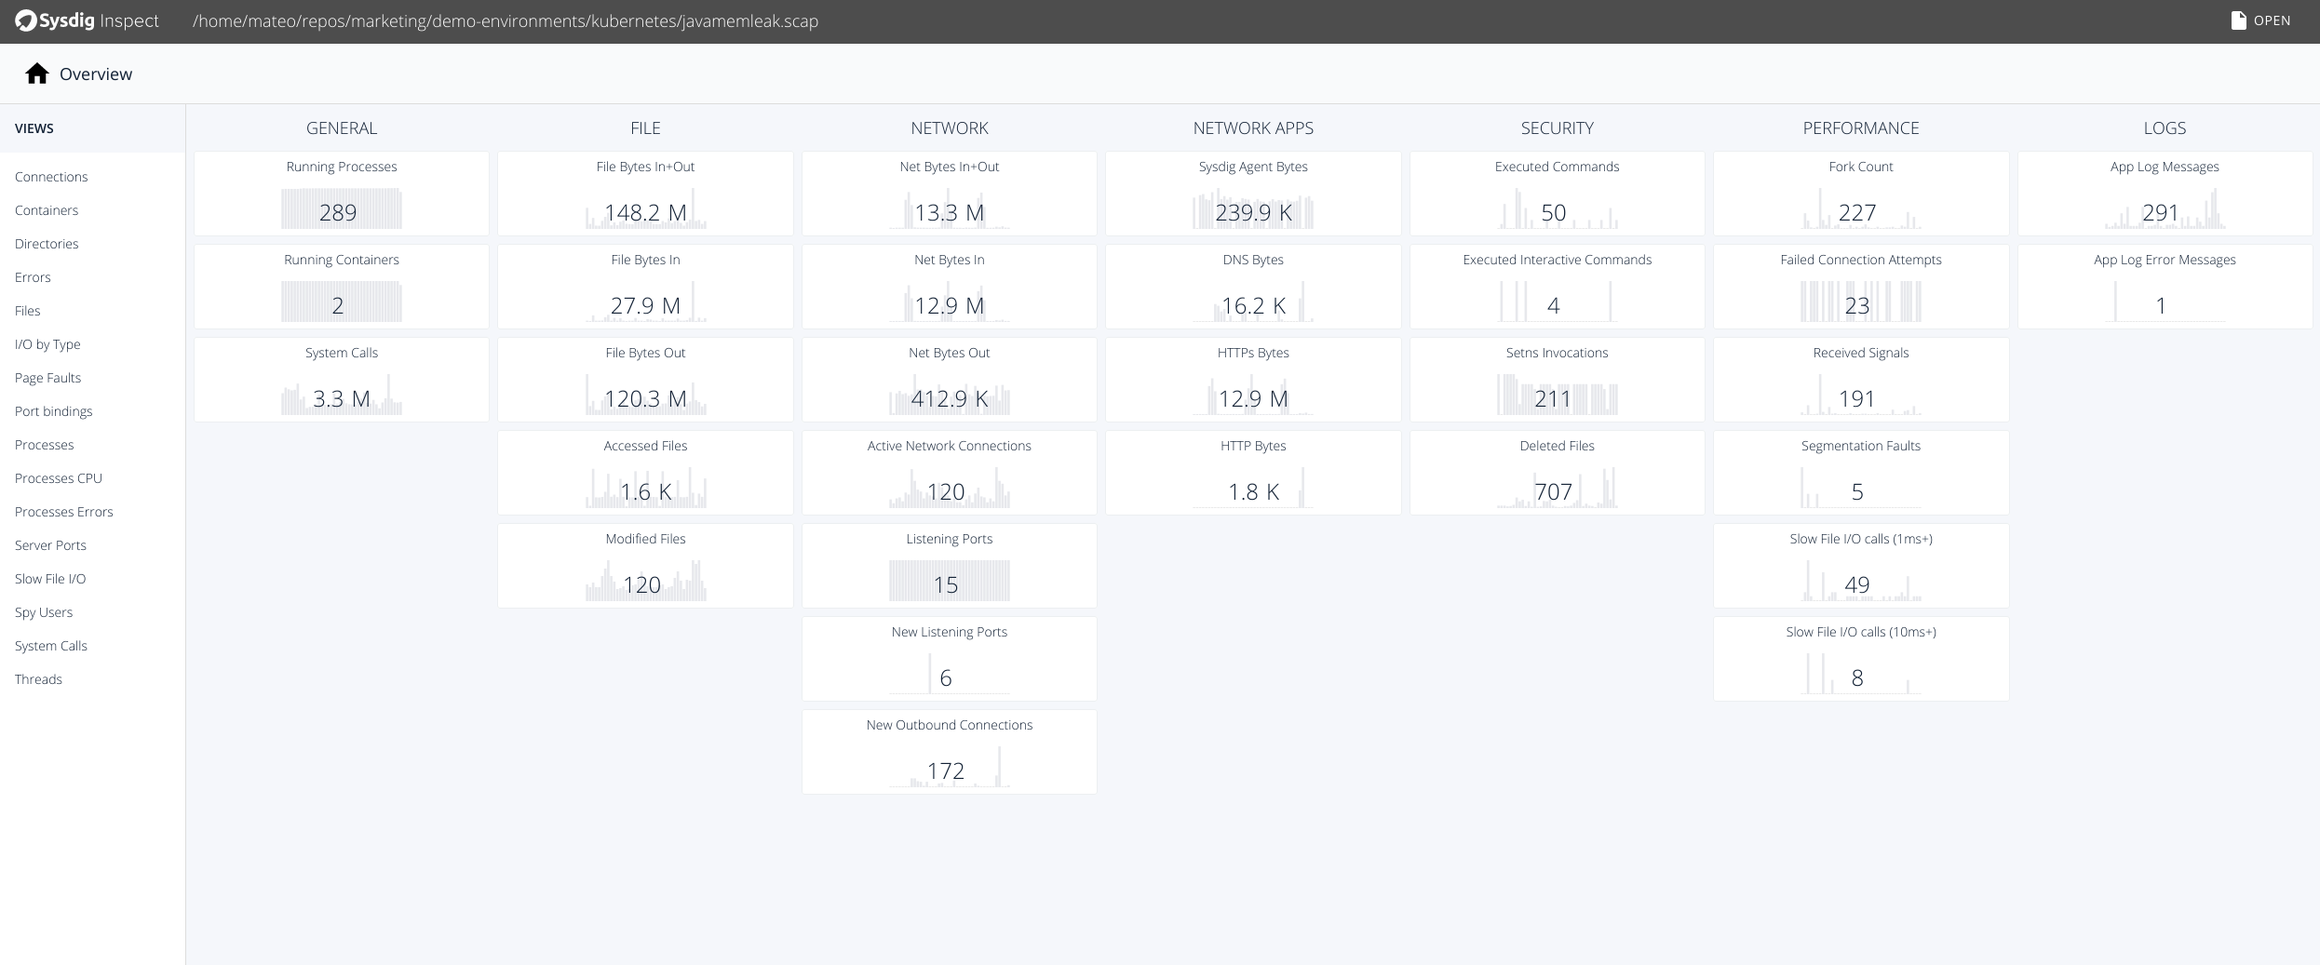
Going back to the capture we just created, let's use Sysdig Inspect—an open source tool with a user-friendly graphical UI that helps you make the most of inspecting sysdig captures.After installing Sysdig Inspect and opening the javamemleak.scap capture, you should be able to see every event (running containers, segmentation faults, application log error messages, opened connections, etc):
By selecting the "Containers" tab in the left menu, you will be able to inspect any container running on this machine:
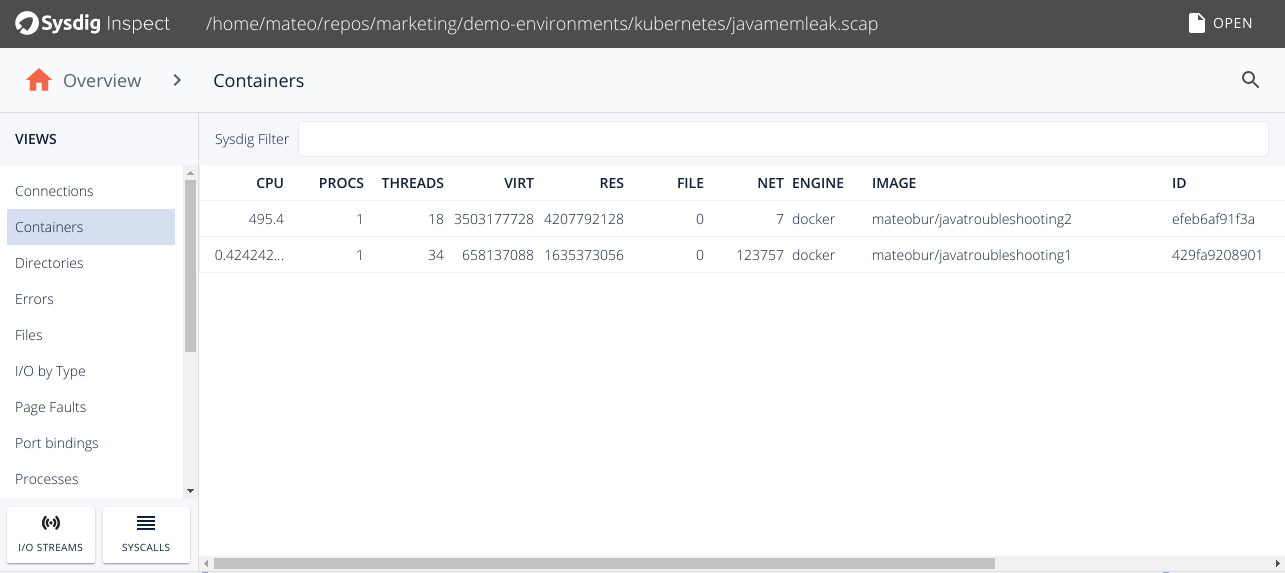
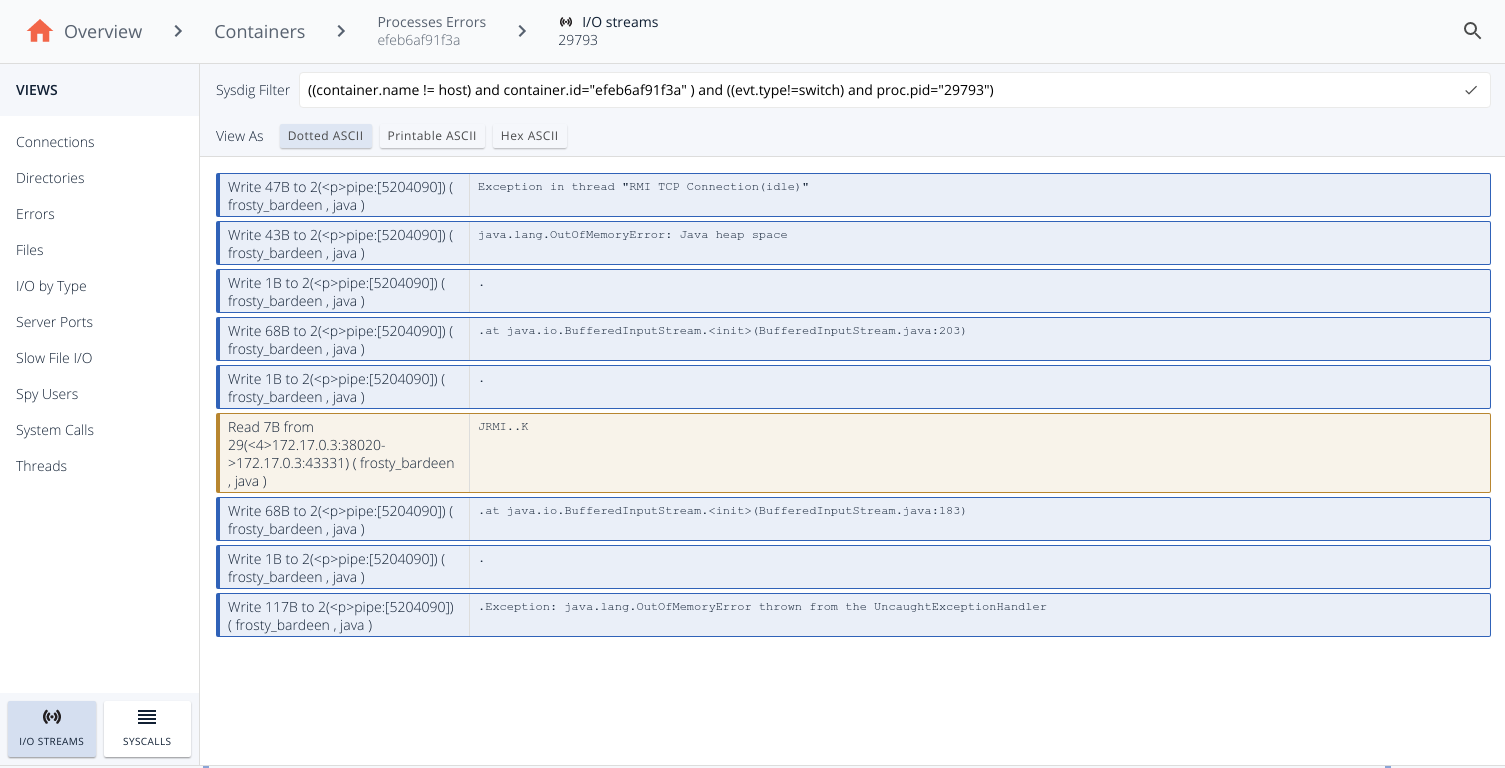
If you drill down into the javatroubleshooting2 container, you'll be able to see every process inside this container. To look for processes errors, click on the Processes Errors tab in the left menu.You will notice that there is a registered error for that process. Click on "I/O streams" to see the full Java exception stack (Java.lang.OutOfMemoryError).Aside from the easy-to-navigate interface, the most interesting part of this whole process is that you're able to read the output and error messages of a process that has died—and left no logs behind.
Troubleshooting Java thread locking
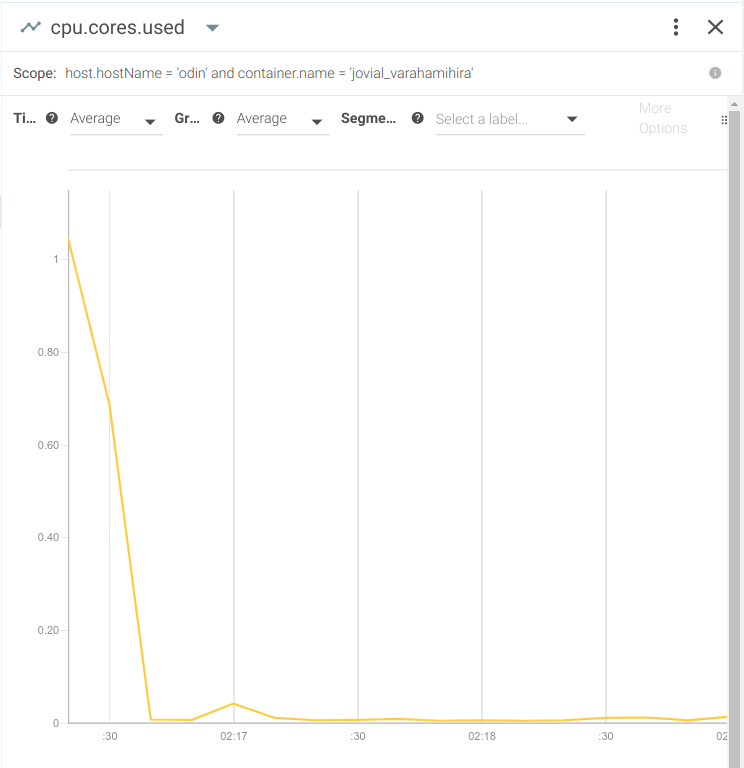
If your application makes extensive use of concurrency and SMP, another common Java troubleshooting scenario you may run into is dealing with deadlocks and race conditions.To illustrate this case, let's run the following dockerized Java application:docker run -d mateobur/javatroubleshooting3The monitoring tool you use for Java troubleshooting will register a sudden drop in CPU usage:
So what happened, and why isn't this application processing data anymore?Let's try to capture the tipping point with open source Sysdig:sysdig -pc -w deadlock.scapKill and launch the container and wait a few seconds for the deadlock to manifest again.Open the resulting capture file deadlock.scap using Sysdig Inspect, go to the Containers tab on the left menu, and drill down to the container you used for this experiment:
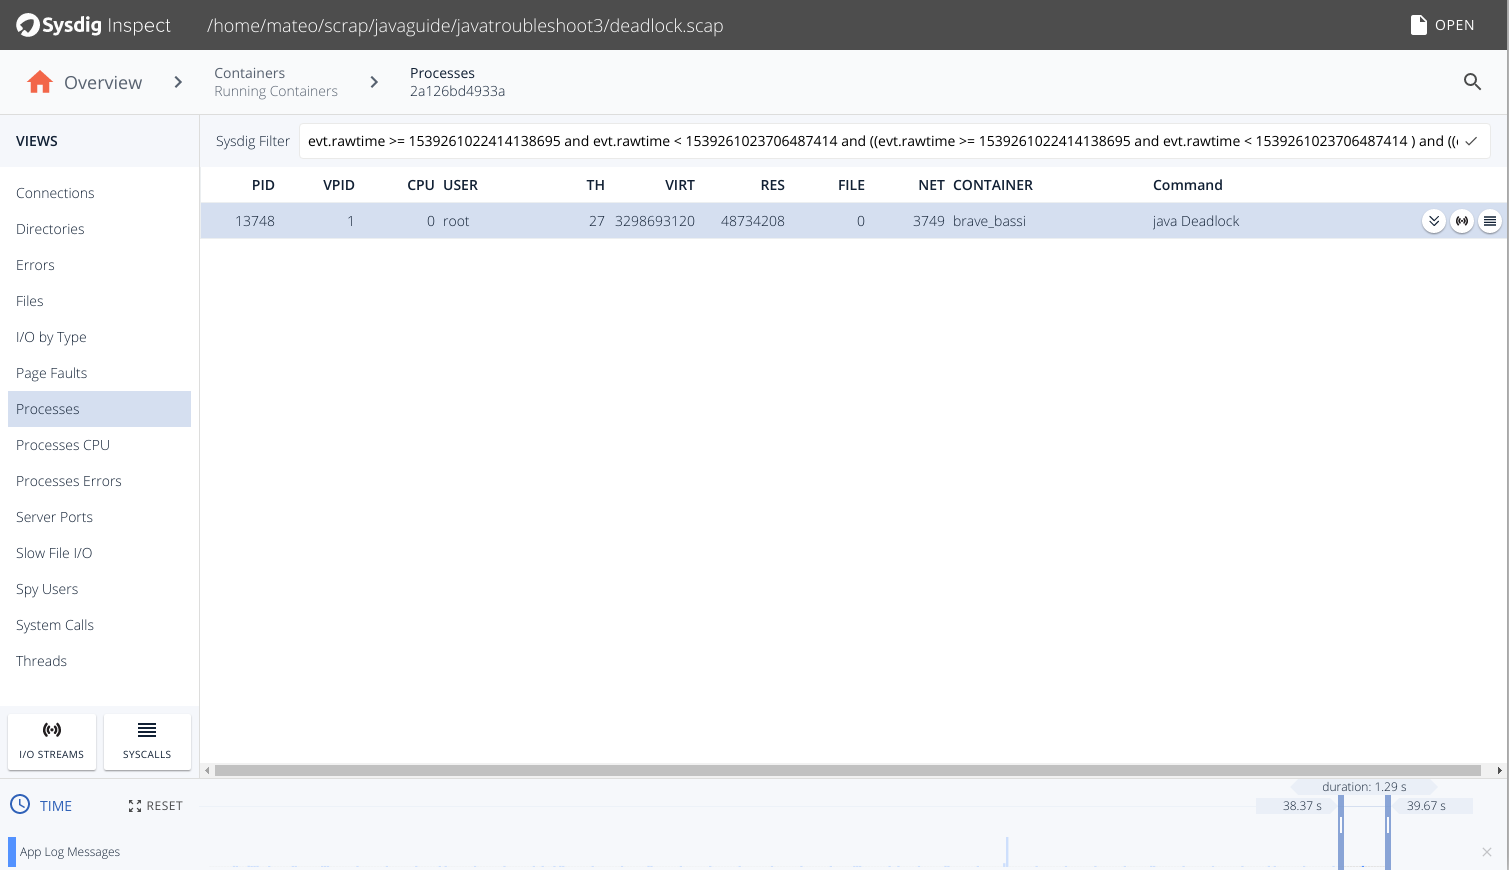
Let's start inspecting this process with system calls, which you'll access via the "hamburger" icon all the way to the right.You'll probably pull up a huge listing of system calls, so use the time slider at the bottom of the screen to focus in on the last few seconds:
Here we see that the process is only calling futex and receiving the ETIMEDOUT error.Using the Linux man pages, we find that:"The futex() system call provides a method for waiting until a certain condition becomes true. It is typically used as a blocking construct in the context of shared-memory synchronization."Because you were able to use Sysdig Inspect to troubleshoot system calls, you can determine that your process is locked in a synchronization barrier, the threads are not processing any useful data and this explains the drop in CPU usage.While the examples we used today are, of course, much simpler than situations you'd find when it comes to Java troubleshooting in real life, we hope they still help you understand which processes and tools to use to identify the root failure cause.With the shift to containers and microservices, it's time that Java troubleshooting and monitoring shifted, too. If you're ready to learn more about deep system inspection that's totally compatible with all the modern container platforms and natively integrated with Java, tryt Sysdig Monitor for free or just come chat about what you're looking for when it comes to Java troubleshooting.