


Falco Feeds extends the power of Falco by giving open source-focused companies access to expert-written rules that are continuously updated as new threats are discovered.

We are excited to announce that Prometheus Remote Write functionality is now generally available in Sysdig Monitor. This feature allows Prometheus users to easily push metrics directly from their Prometheus servers to Sysdig's Managed Prometheus Service.
Sysdig Monitor provides not only a scalable long term storage solution for custom metrics but also radically simplifies Prometheus monitoring. Sysdig untangles complex querying with our easy-to-use form-based query interface and our ability to extend PromQL eliminating most of the joins. Monitoring cloud-native services and applications is done right using Prometheus-based monitoring integrations with autodetection, assisted configuration, and out-of-the-box dashboards and alerts.
Sysdig customers avoid the need to manually plumb together all the pieces of their Prometheus monitoring stack and eliminate most of the operational work leveraging our SaaS service.
Now, metrics can be received through Prometheus Remote Write in parallel to Sysdig agents, which also support Prometheus Service Discovery mechanism and prometheus.yaml job configurations.
When do you need Prometheus remote write?
Long term storage service for Prometheus
Leveraging an external metrics storage allows you to maintain your existing Prometheus setup while reducing operational overhead and with the benefits of having all your metrics from different environments under a centralized single pane of glass.
You can leverage all the things you love about Prometheus …
- PromQL to query metrics
- Connect your Grafana dashboards to Sysdig endpoint like if it was a Prometheus server
- Dispatch PromQL alerts to your notification channels
… and still enjoy all the goodness from Sysdig's integrated user experience.
Monitor environments without installing agents
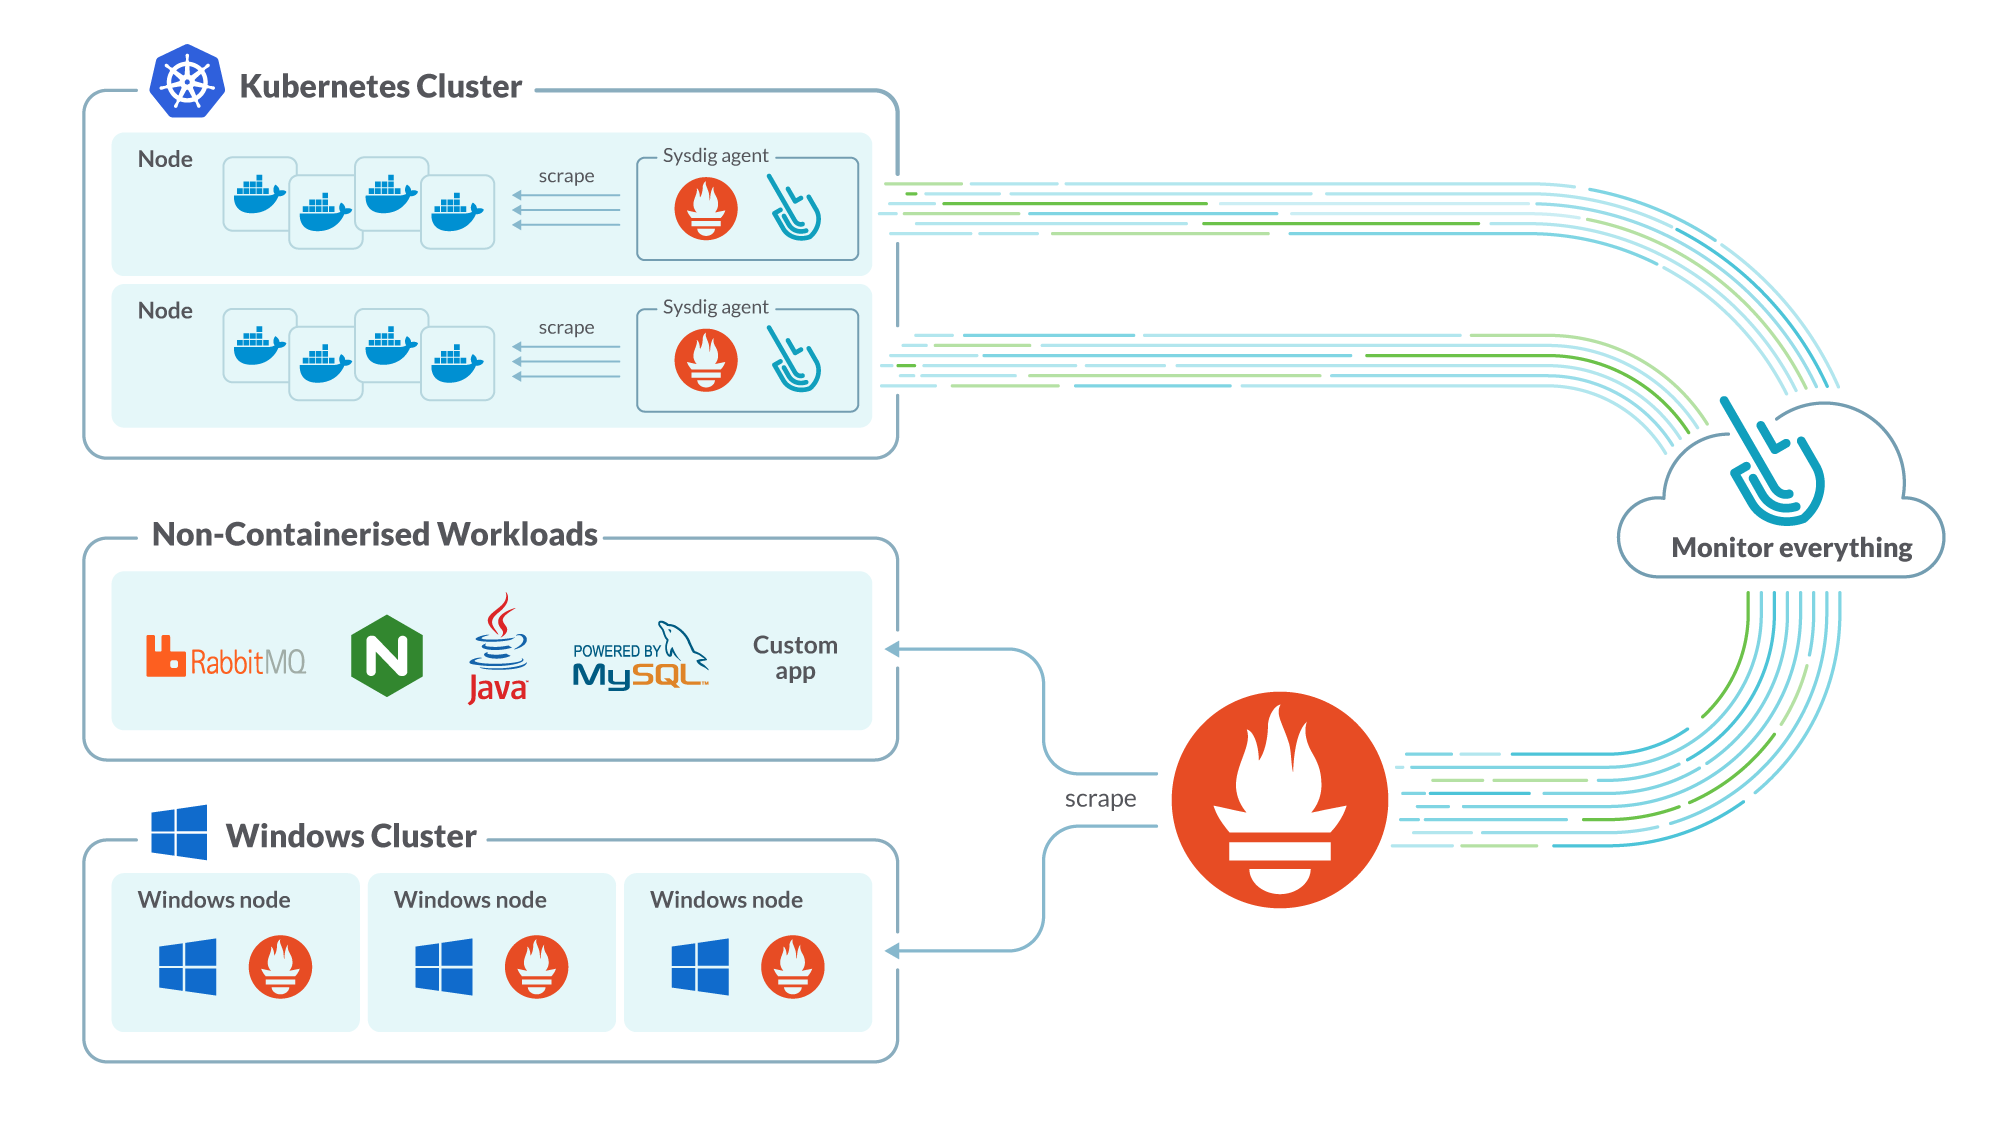
Prometheus remote write allows you to monitor Windows hosts, non-x86 based architectures like ARM or Power, IoT or edge computing devices, etc; any environment where you wouldn't normally install the Sysdig agent.
With this functionality, you can centralize metrics from different environments together with your Kubernetes monitoring. For Kubernetes, installing the Sysdig agent has additional benefits like collecting Kubernetes and container metadata for metric enrichment and events. This is very useful for adding context when troubleshooting using Sysdig's eBPF-based metrics, including per process metrics, network metrics, and golden signals from your HTTP and TCP services.
How to start using Prometheus remote write
You just need to configure your Prometheus servers to remote write to your Sysdig account, adding the remote_write block to your configuration files.
To authenticate against the Prometheus Remote Write endpoint you should use an Authorization Header with your API token as Bearer Token (don't confuse this with your instance's Sysdig agent access key). You will have to configure the remote_write section in your prometheus.yml configuration file like this:
global:
external_labels:
[ : ... ]
remote_write:
- url: "https:///prometheus/remote/write"
bearer_token: ""
You can also use the bearer_token_file entry to refer to a file instead of directly including the API Token, this is the typical scenario if you store this in a Kubernetes secret, and we recommend this! :)
You will find the right endpoint URL for the Sysdig region you are in our docs.
From version v2.26, Prometheus allows a new way to configure the authorization by including a section within your remote_write block called authorization:
global:
external_labels:
[ : ... ]
remote_write:
- url: "https:///prometheus/remote/write"
authorization:
credentials: ""
Here you can also use the credentials_file option, like above.
Note: Prometheus does not reveal the bearer_token value in the UI.
Controlling metrics sent to Prometheus remote write
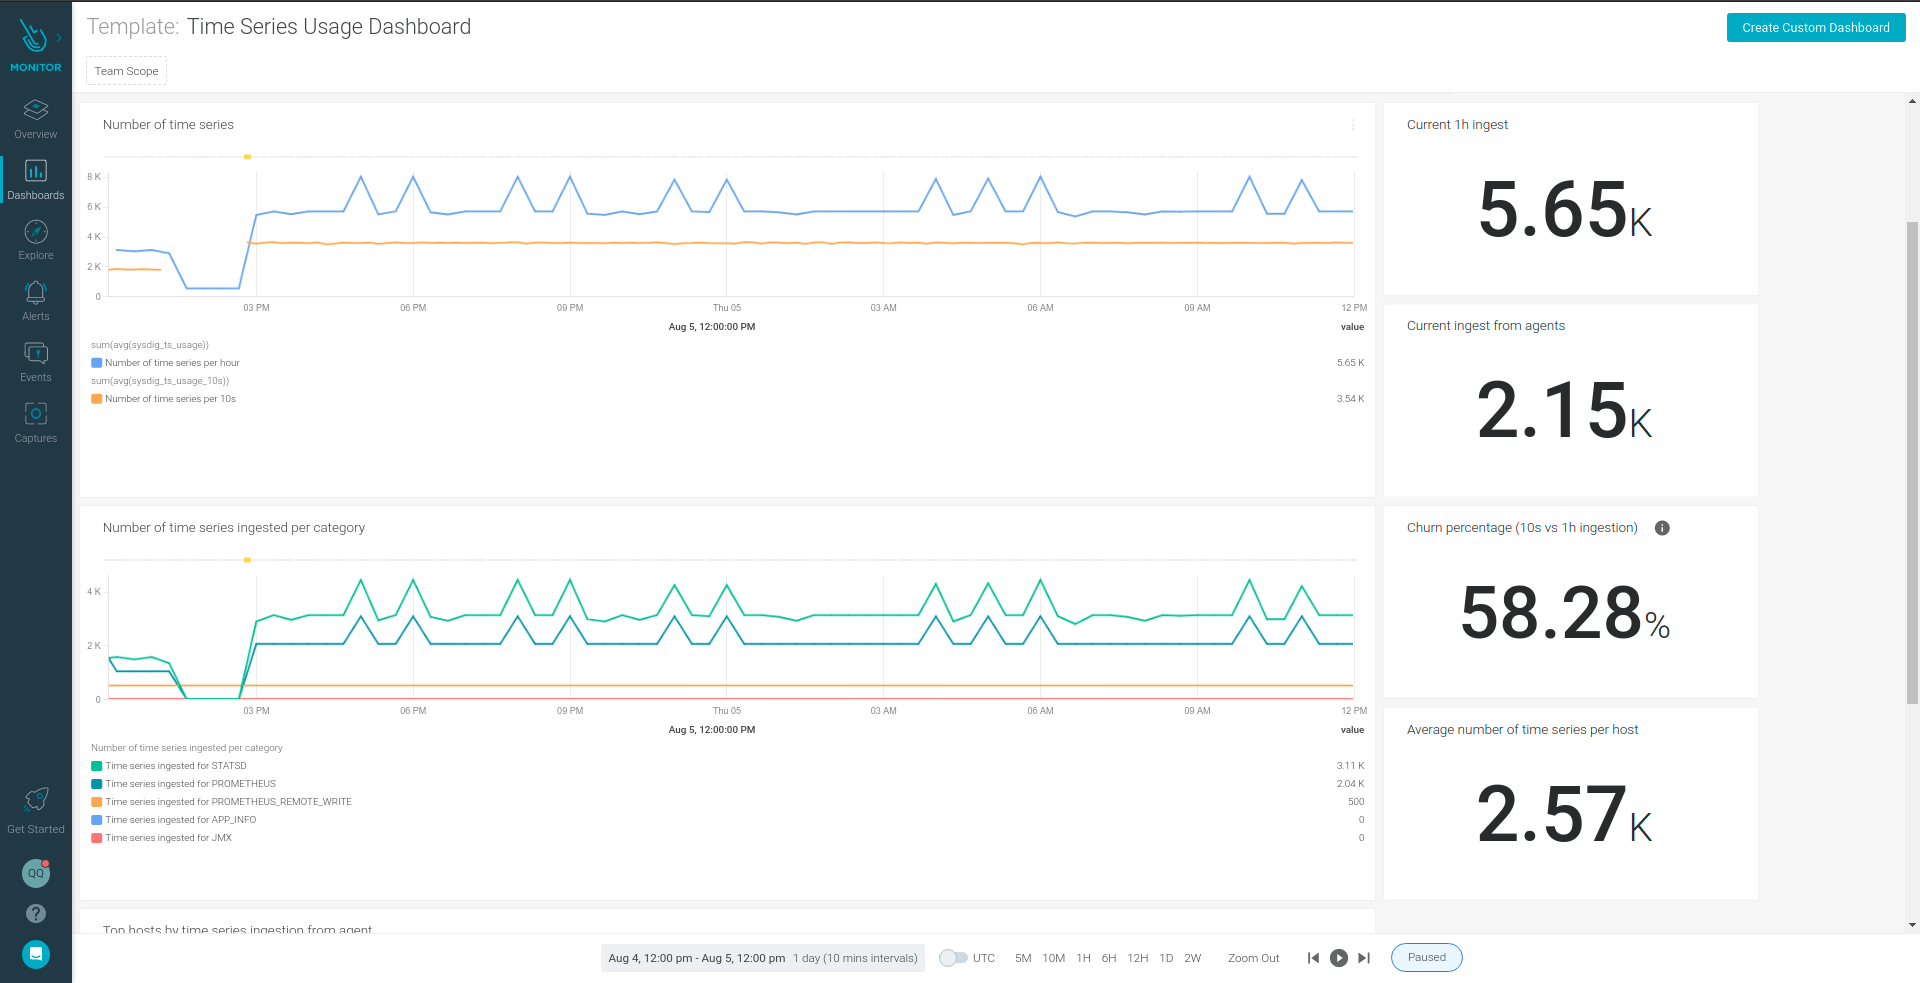
By default, all metrics scraped by your Prometheus servers are sent to the Prometheus Remote Write endpoint when you configure remote write. These metrics will include a remote_write: true label when stored in Sysdig Monitor, so you can easily identify them.
You can specify custom label/value pairs to be sent along with each time series, using the external_labels block within the global section. This allows you to filter/scope metrics when using them, similar to setting an agent tag.
Imagine if you had two different Prometheus servers configured to remote write to Prometheus Remote Write. You could easily include an external label to identify them.
You would configure one server as:
global:
external_labels:
provider: prometheus1
remote_write:
- url: ...
And the other as:
global:
external_labels:
provider: prometheus2
remote_write:
- url: ...
With the general configuration, all metrics are written remotely to Prometheus Remote Write. You can include relabel_config entries to control which metrics you want to keep, drop, or replace.
In the following example, we are only sending metrics from one specific namespace called myapp-ns.
remote_write:
- url: https:///prometheus/remote/write
bearer_token_file: /etc/secrets/sysdig-api-token
write_relabel_configs:
- source_labels: [__meta_kubernetes_namespace]
regex: 'myapp-ns'
action: keep
For more information using Prometheus Remote Write on Sysdig Monitor, please refer to our documentation.
Simple, usage-based pricing for Prometheus custom metrics
To accommodate Prometheus users leveraging Sysdig's Prometheus Managed Service, we are releasing a new pricing mechanism that will charge for additional custom metrics sent to the Sysdig service.
Now, in addition to our agent or host-based pricing, we provide a metrics ingest-based pricing. This provides flexible, usage-based, cost-efficient pricing for companies that want to increase their custom metric usage beyond what is already included with the Sysdig agent or if they are not using Sysdig agents because they leverage the Prometheus remote write functionality.
In order to make pricing simple to understand, when using the agent, infrastructure metrics (host, container, Kubernetes state metrics) remain included with the agent license, which also includes a large number of custom metrics so you can get started with Prometheus monitoring and service monitoring without incurring into extra cost.
If you are a heavy user of custom metrics, you can purchase additional metrics upfront to optimize your spend. For more detailed information on how pricing works, check out our docs.
Compared with other monitoring vendors, Sysdig's pricing is extremely competitive. So, whether you want the best in class Kubernetes monitoring or simplified, cost-efficient Prometheus monitoring, Sysdig Monitor can address your monitoring needs.
Start now
The Prometheus open-source ecosystem is wide and diverse, and we believe our approach will save you a lot of time and effort while avoiding vendor lock-in with an open standards approach, but with our support confidence. Sysdig has curated the best exporters for your applications to give you the option to easily configure and use them. This reduces time and complexity by having ready-to-use metrics, dashboards, and alerts in your account.
Sounds too good to be true? Take a few minutes and try it yourself. Monitoring your services is now just a few clicks away, just sign-up for a free trial of Sysdig Monitor.