


Falco Feeds extends the power of Falco by giving open source-focused companies access to expert-written rules that are continuously updated as new threats are discovered.

We are excited to announce ServiceVision for Prometheus. This further extends our native PromQL support in Sysdig Monitor, helping you write simpler PromQL queries faster. ServiceVision for Prometheus includes new ways to explore Prometheus metrics, automatic label generation, and new ways to group workloads together, resulting in richer dashboards to help increase visibility and solve problems faster.
ServiceVision uses Sysdig's patented technology to automatically enrich your metrics with your Kubernetes and application context. This works out-of-the-box without the need to instrument additional labels in your environment, reducing operational complexity and cost.
Now, with ServiceVision for Prometheus, metrics queried via PromQL are enriched with Kubernetes, host, and cloud context. This enrichment takes place in our metric ingestion pipeline after time-series have been sent to our backend.
Imagine you want to know the CPU usage in your cluster for each deployment. You may write a query like this:
Using our new ServiceVision for Prometheus, the query could be just like this:
Looks like magic, right? Don't worry: we'll discuss how this works in a moment.
How do we do it?
The Sysdig agent scrapes metrics out of all your clusters and gets your infrastructure information at a cloud provider, host, and container level. If there's a Kubernetes cluster, it also gets information from the Pods.
Sysdig Monitor then annotates every metric with all of the infrastructure information, and stores it in our time-series database. This essentially makes all your infrastructure information easily accessible along with your metrics.
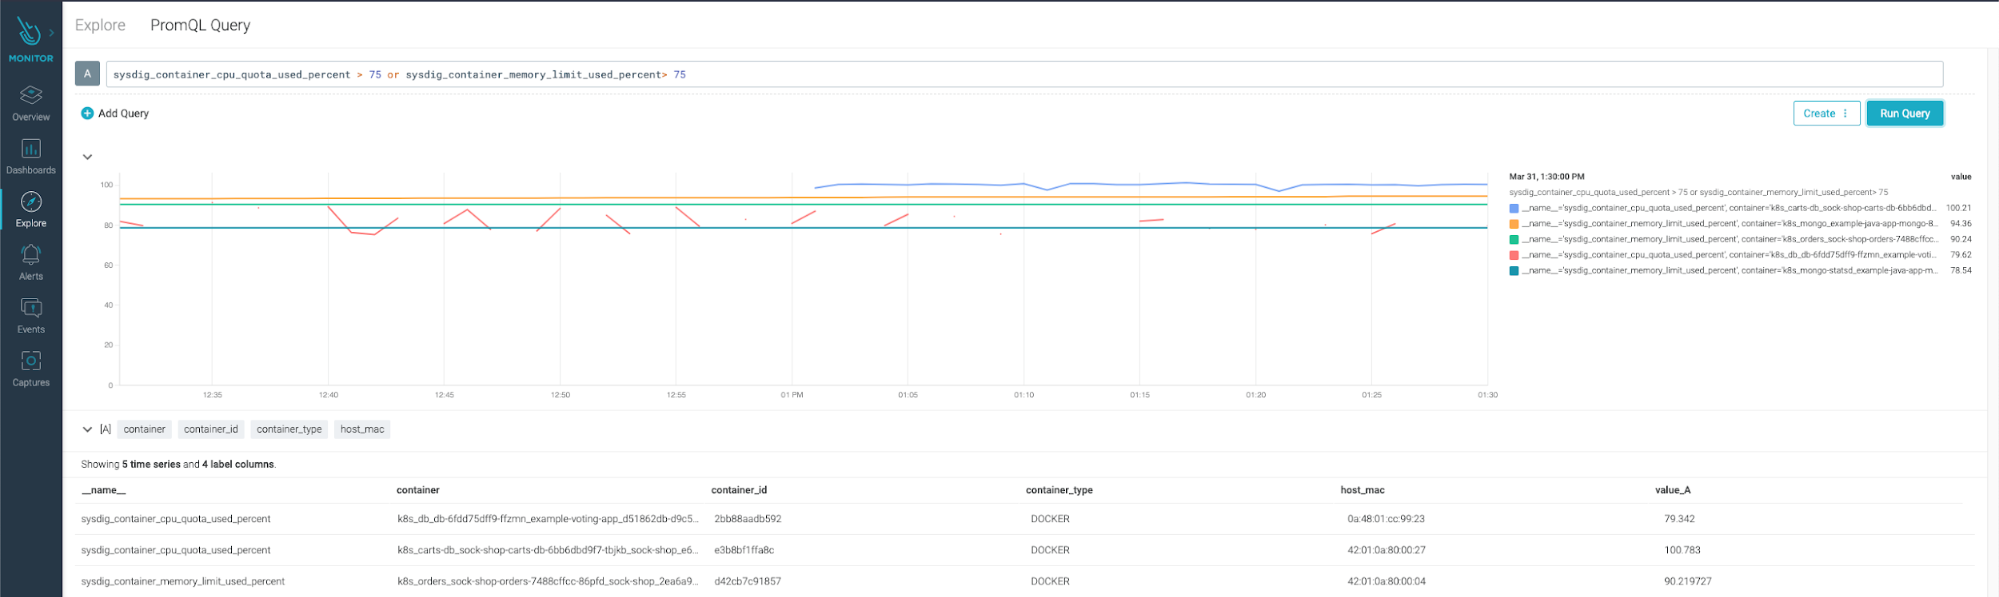
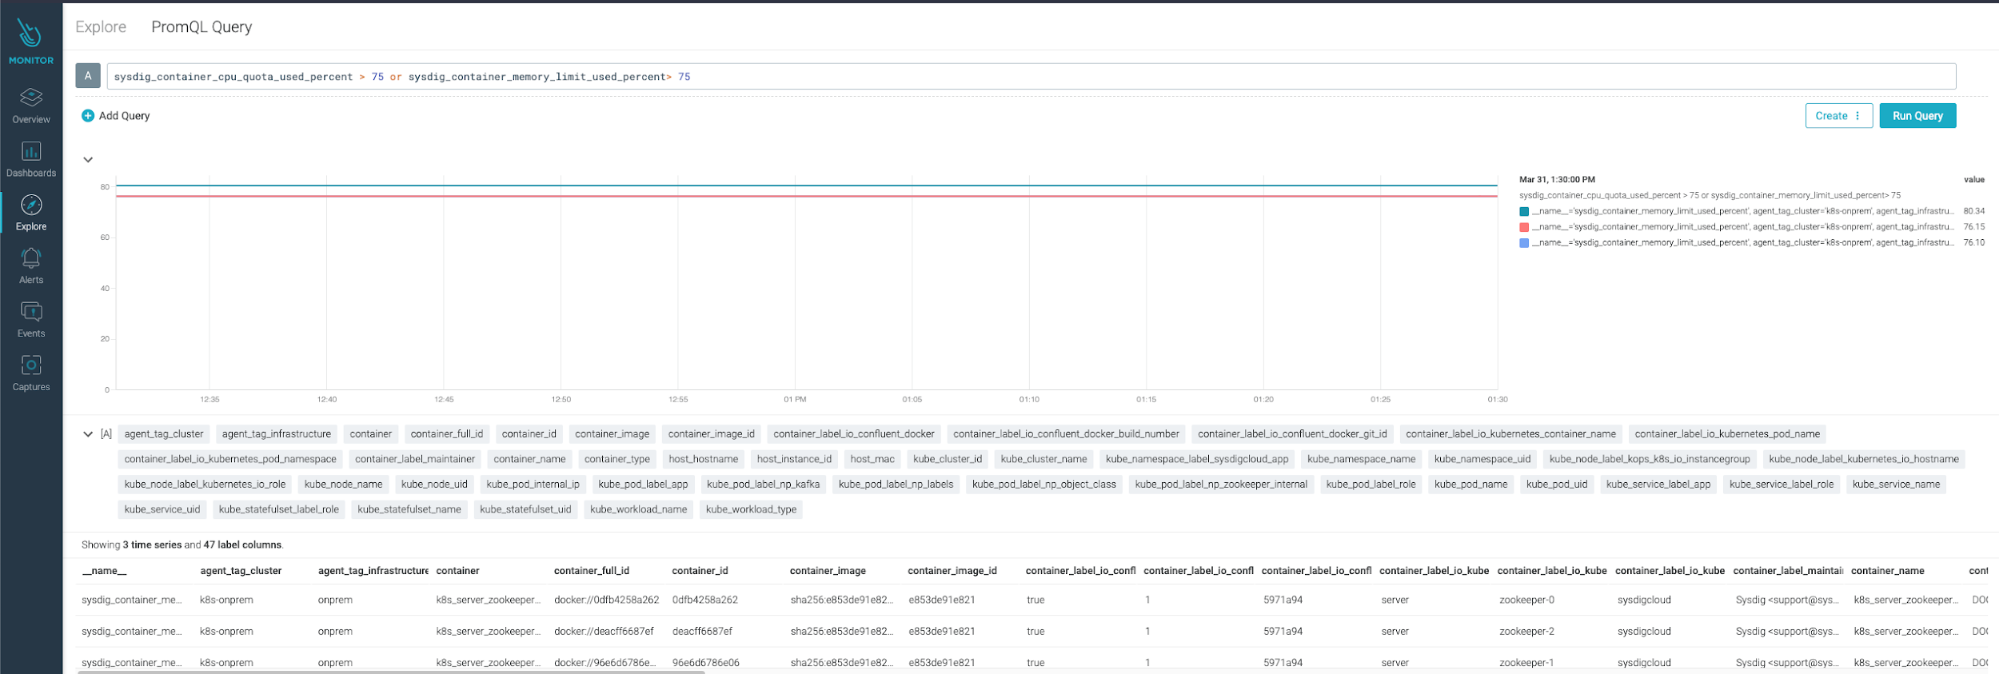
Look through all your data in PromQL Explorer
With ServiceVision for Prometheus, your metrics will now have better, more descriptive labels. You can use PromQL Explorer in Sysdig Monitor to analyze and make the most of all this rich metadata.
The Kubernetes metadata labels start with kube_, so that they are easily distinguishable from user-supplied labels.
Backward compatibility with PromQL
If you've been using Prometheus on Sysdig and created PromQL queries, these queries will remain working with the same performance.
If you would like to take advantage of ServiceVision for Prometheus and simplify your queries, you will gain query simplicity as well as improved query performance.
Dealing with complex queries
Let's take a look at a really complex query and rewrite it to make your life easier, and take full advantage of the new Sysdig Monitor's ServiceVision for Prometheus. Imagine that you want to know the container memory usage summarized by the Kubernetes cluster name, namespace, and workload cluster. In this example, you're interested in StatefulSets.
In PromQL you need to join (vector match) three metrics:
sysdig_container_memory_used_bytes, that has the main information you want.sysdig_container_info, that knows which container belongs to which Pod.kube_pod_owner, which tells us which Kubernetes object is the Pod owner.
Also, you'll often need to rely on the label_replace PromQL function if the label names don't match, which happens frequently.
In this case, as the label name for the Pod name in the kube_pod_owner metric is pod, we need to replace the label_io_kubernetes_pod_name label to have the name pod.
So, this is how we would do it in PromQL without the ServiceVision:
And this is how you do it with ServiceVision for Prometheus. Much simpler:
As you can see, with ServiceVision for Prometheus there's no need to perform vector matching operations (like group_left and group_right). You also don't need to be aware of the common labels between metrics either or use the label_replace PromQL function. These time-saving labels can be found in PromQL Explorer by typing into the search bar, since we will automatically show matching syntax.
Extending the PromQL support in Sysdig Monitor
ServiceVision for Prometheus further extends our existing support for PromQL in Sysdig Monitor. It automagically instruments additional infrastructure information based on your cluster and application context. This reduces the query complexity and helps write queries faster.
Although Prometheus has a lot of adoption, PromQL itself has a steep learning curve and can be challenging to use in a complex container-orchestrated environment. Thanks to ServiceVision for Prometheus, all necessary container, host, and cluster metadata are set on all the metrics. This makes the query very easy to write and understand.
Ready to start using ServiceVision for Prometheus?
To start taking advantage of ServiceVision for Prometheus, simply navigate to the Explore feature in Sysdig Monitor and check out the new PromQL Explorer. There, you can easily add queries to dashboards or create alerts.
This feature is available to existing customers starting in the Sysdig US-East region, and will be rolled out to our other regions over the next couple of weeks. In the meantime, see ServiceVision for Prometheus in action in our Supercharging Kubernetes Labels and Metrics webinar!