


Falco Feeds extends the power of Falco by giving open source-focused companies access to expert-written rules that are continuously updated as new threats are discovered.

nginx is an open source web server often used as a reverse proxy, load balancer, and web cache. Designed for high loads of concurrent connections, it's fast, versatile, reliable, and most importantly, very light on resources. In this article, you'll learn how to monitor nginx in Kubernetes with Prometheus, and also how to troubleshoot different issues related to latency, saturation, etc.
Ingredients
Before we begin, let's summarize the tools you'll be using for this project.
- nginx server (I bet it's already running in your cluster!).
- Our beloved Prometheus, the open source monitoring standard.
- The official nginx exporter.
- Fluentd, and its plugin for Prometheus.
Starting with the basics: nginx exporter
The first thing you need to do when you want to monitor nginx in Kubernetes with Prometheus is install the nginx exporter. Our recommendation is to install it as a sidecar for your nginx servers, just by adding it to the deployment. It should be something like this:
apiVersion: apps/v1
kind: Deployment
metadata:
  name: nginx-server
spec:
  selector:
    matchLabels: null
  app: nginx
  replicas: 3
  template:
    metadata:
      labels:
        app: nginx
      annotations:
        prometheus.io/scrape: 'true'
        prometheus.io/port: '9113'
    spec:
      containers:
        - name: nginx
          image: nginx
          ports:
            - containerPort: 80
          volumeMounts:
            - name: nginx-config
              mountPath: /etc/nginx/conf.d/default.conf
              subPath: nginx.conf
        - name: nginx-exporter
          image: 'nginx/nginx-prometheus-exporter:0.10.0'
          args:
            - '-nginx.scrape-uri=http://localhost/nginx_status'
          resources:
            limits:
              memory: 128Mi
              cpu: 500m
          ports:
            - containerPort: 9113
      volumes:
        - configMap:
            defaultMode: 420
            name: nginx-config
          name: nginx-config
This way, you've just added a nginx exporter container in each nginx server pod. Since we configured three replicas, there'll be three pods, each containing one nginx server container and one nginx exporter container. Apply this new configuration and voilà! You easily exposed metrics from your nginx server.
Monitoring nginx overall status with Prometheus
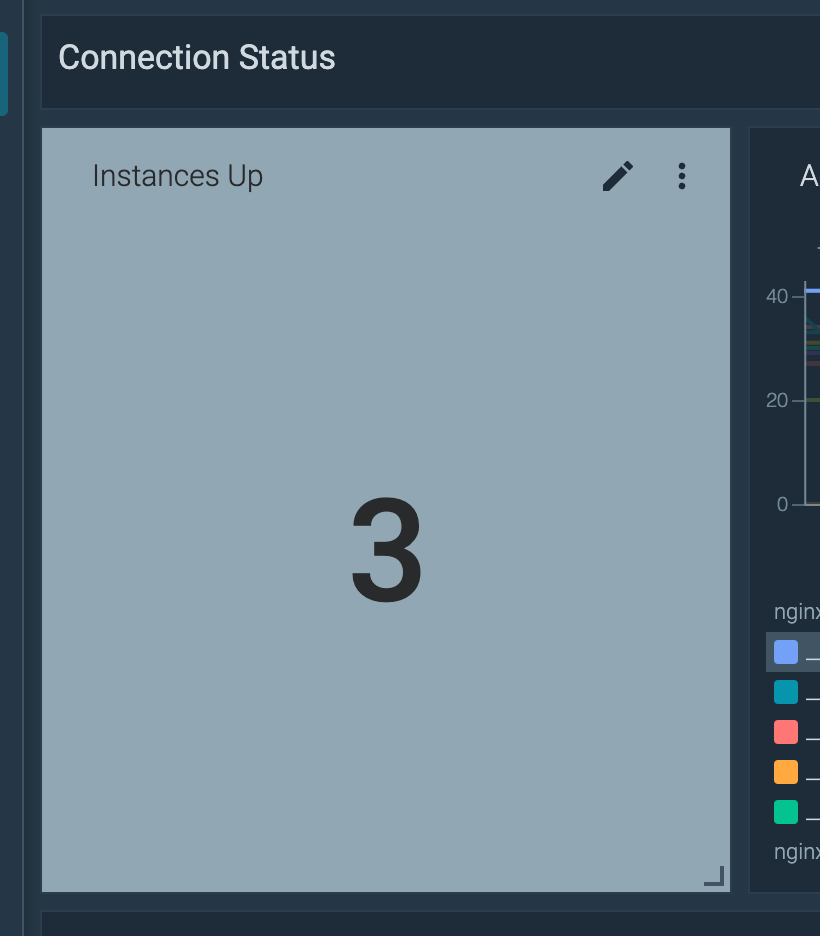
Do you want to confirm that it worked? Easy-peasy. Go to Prometheus and try this PromQL out:
sum (nginx_up)This will say there are three containers reporting nginx_up to one. Don't worry about the metrics yet, we'll be there in no time.
Do you want to practice in a real environment?
Register now to our free hands-on lab to configure a Prometheus exporter

Monitoring nginx connections with Prometheus
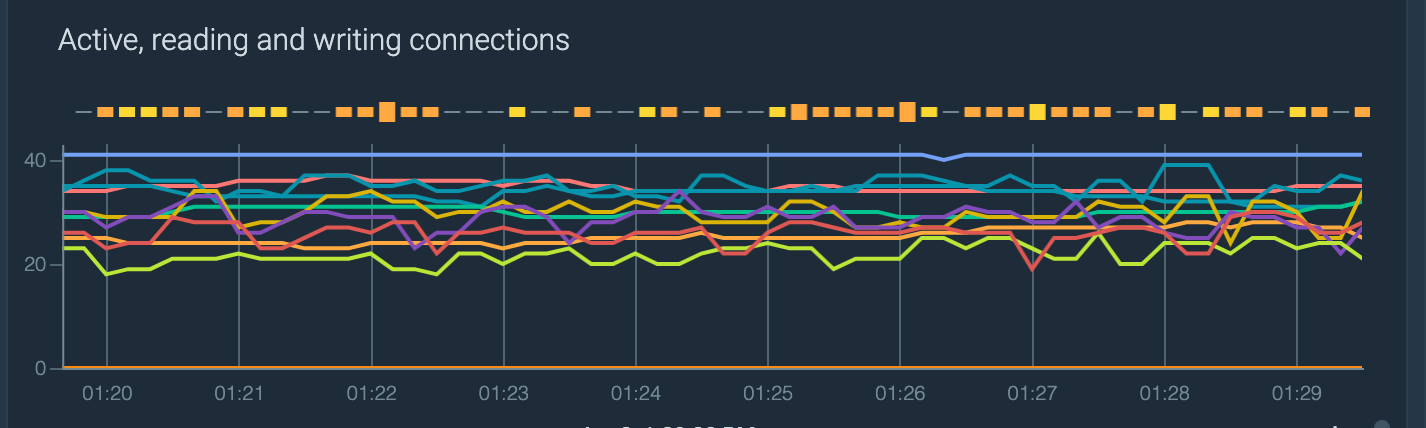
Active connections
Let's use the following metrics to take a look at the nginx active connections. You can also focus on which ones are reading or writing:
nginx_connections_activenginx_connections_readingnginx_connections_writing
Just by using them you'll have something like this:
Unhandled connections
Now, let's focus on how many connections are not being handled by nginx. You just need to take off the handled connections from the accepted connections. The nginx exporter gives us both metrics with:
nginx_connections_handlednginx_connections_accepted
So, let's get the percentage of accepted connections that are being unhandled:
rate(nginx_connections_accepted{kube_cluster_name=~$cluster}[$__interval]) - rate(nginx_connections_handled{kube_cluster_name=~$cluster}[$__interval]) or vector(0) / rate(nginx_connections_accepted{kube_cluster_name=~$cluster}[$__interval]) * 100Want to dig deeper into PromQL? Read our Getting started with PromQL guide to learn how Prometheus stores data, and how to use PromQL functions and operators.
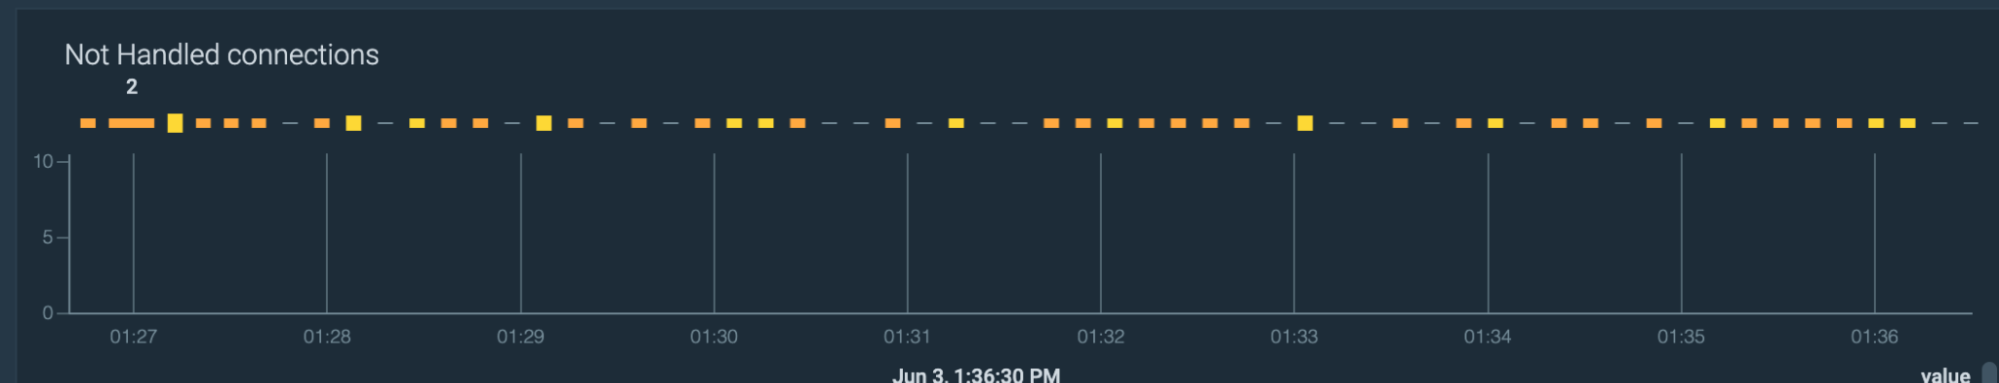
Hopefully this number will be near zero!
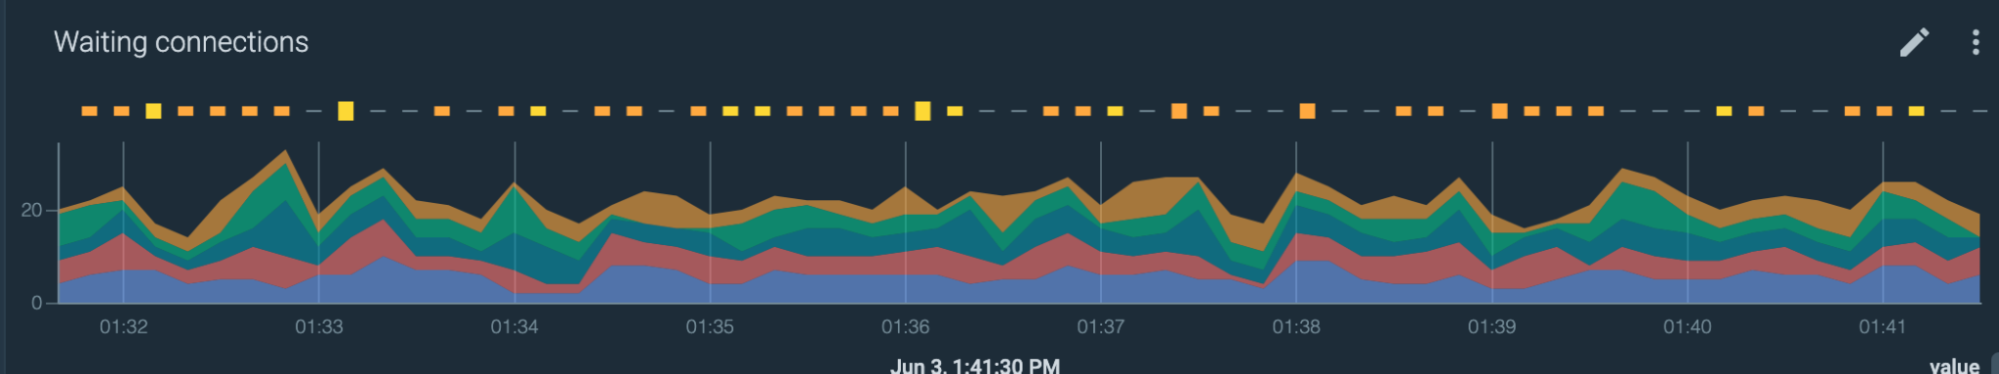
Waiting connections
Fortunately, this is also an easy query. Just type nginx_connections_waiting, which is the metric that nginx exporter uses to expose this information.
Need more metrics? Take them from the logs!
In case you need more information to monitor nginx in Kubernetes with Prometheus, you can use the access.log from nginx to take a little more information. Let's see how.
Fluentd, the open source data collector
You can configure Fluentd to pick up information from the nginx access.log and convert it into a Prometheus metric. This can be really handy for situations where the instrumented application doesn't expose much information.
How to install and configure Fluentd
We already talked about Fluentd and its Prometheus plugin here, so just follow the instructions in that article, and you'll be ready to rock.
Let's configure Fluentd to export a few more metrics
To do this, you need to tweak the access.log format a little: you can pick the default logging format, and add the $upstream_response_time at the end. This way, Fluentd will have this variable and use it to create some useful metrics.
name: nginx-config
data:
  nginx.conf: |
    log_format custom_format '$remote_addr - $remote_user [$time_local] '
      '"$request" $status $body_bytes_sent '
      '"$http_referer" "$http_user_agent" '
      '$upstream_response_time';
    server {
      access_log /var/log/nginx/access.log custom_format;
      ...
    }
This config goes in the nginx.conf, usually in a ConfigMap.
Next, you need to configure Fluentd to read the new log's format. You can do this by creating a new config for nginx in the Fluentd's fileConfig section.
<source>
    @type prometheus_tail_monitor
</source>
<source>
    @type tail
    <parse>
    @type regexp
    expression /^(?<timestamp>.+) (?<stream>stdout|stderr)( (.))? (?<remote>[^ ]*) (?<host>[^ ]*) (?<user>[^ ]*) \[(?<time>[^\]]*)\] \"(?<method>\w+)(?:\s+(?<path>[^\"]*?)(?:\s+\S*)?)?\" (?<status_code>[^ ]*) (?<size>[^ ]*)(?:\s"(?<referer>[^\"]*)") "(?<agent>[^\"]*)" (?<urt>[^ ]*)$/
        time_format %d/%b/%Y:%H:%M:%S %z
        keep_time_key true
        types size:integer,reqtime:float,uct:float,uht:float,urt:float
    </parse>
    tag nginx
    path /var/log/containers/nginx*.log
    pos_file /tmp/fluent_nginx.pos
</source>
<filter nginx>
     @type prometheus
</filter>
With that config, you basically created a regex parser for the nginx access.log. This is the expression config:
expression /^(?<timestamp>.+) (?<stream>stdout|stderr)( (.))? (?<remote>[^ ]*) (?<host>[^ ]*) (?<user>[^ ]*) \[(?<time>[^\]]*)\] \"(?<method>\w+)(?:\s+(?<path>[^\"]*?)(?:\s+\S*)?)?\" (?<status_code>[^ ]*) (?<size>[^ ]*)(?:\s"(?<referer>[^\"]*)") "(?<agent>[^\"]*)" (?<urt>[^ ]*)$/Take this log line for example:
2022-06-07T14:16:57.754883042Z stdout F 100.96.2.5 - - [07/Jun/2022:14:16:57 +0000] "GET /ok/500/5000000 HTTP/1.1" 200 5005436 "-" "python-requests/2.22.0" 0.091 With the parser, you broke that log line in the following parts:
timestamp: 2022-06-07T14:16:57.754883042Zstream: stdoutremote: 100.96.2.5host: -user: -time: 07/Jun/2022:14:16:57 +0000method: GETpath: /ok/500/5000000status_code: 200size: 5005436referer: -agent: python-requests/2.22.0urt: 0.091
Now that you configured Fluentd to read the access.log, you can create some metrics by using those variables from the parser.
nginx bytes sent
You can use the size variable to create the nginx_size_bytes_total metric: a counter with the total nginx bytes sent.
      <metric>
        name nginx_size_bytes_total
        type counter
        desc nginx bytes sent
        key size
      </metric>
Error rates
Let's create this simple metric:
<metric>
        name nginx_request_status_code_total
        type counter
        desc nginx request status code
        <labels>
          method ${method}
          path ${path}
          status_code ${status_code}
        </labels>
</metric>
This metric is just a counter with all the log lines. So, why is it useful? Well, you can use other variables as labels, which can be handy to break down all the information. Let's use this metric to get the total error rate percentage:
sum(rate(nginx_request_status_code_total{status_code=~"[4|5].."}[1h])) / sum(rate(nginx_request_status_code_total[1h])) * 100You could also get this information aggregated by method:
sum by (method) (rate(nginx_request_status_code_total{status_code=~"[4|5].."}[1h])) / sum by (method) (rate(nginx_request_status_code_total[1h]))Or even by path:
sum by (path) (rate(nginx_request_status_code_total{status_code=~"[4|5].."}[1h])) / sum by (path) (rate(nginx_request_status_code_total[1h]))Latency
Wouldn't it be great if you could monitor the latency of the successful requests? Well, it might as well be your birthday because you can! Remember when we told you to add the $upstream_response_time variable?
This variable stores the time spent on receiving the response from the upstream server in just seconds. You can create a histogram metric with Fluentd, like this:
<metric>
        name nginx_upstream_time_seconds_hist
        type histogram
        desc Histogram of the total time spent on receiving the response from the upstream server.
        key urt
        <labels>
          method ${method}
          path ${path}
          status_code ${status_code}
        </labels>
</metric>
So now, magically, you can try this PromQL query to get the latency in p95 of all the successful requests, aggregated by the path of the request.
histogram_quantile(0.95, sum(rate(nginx_upstream_time_seconds_hist_bucket{status_code !~ "[4|5].."}[1h])) by (le, path))To sum up
In this article, you learned how to monitor nginx in Kubernetes with Prometheus, and how to create more metrics using Fluentd to read the nginx access.log. You also learned some interesting metrics to monitor and troubleshoot nginx with Prometheus.