


Falco Feeds extends the power of Falco by giving open source-focused companies access to expert-written rules that are continuously updated as new threats are discovered.

In this article, we will explain how to monitor an Oracle Database with Prometheus using an exporter to generate metrics. Also, we will review the main metrics that you should monitor on resource usage and performance, and what to alert on to detect issues and incidents in your Oracle Database.
Why is it important to monitor an Oracle Database?
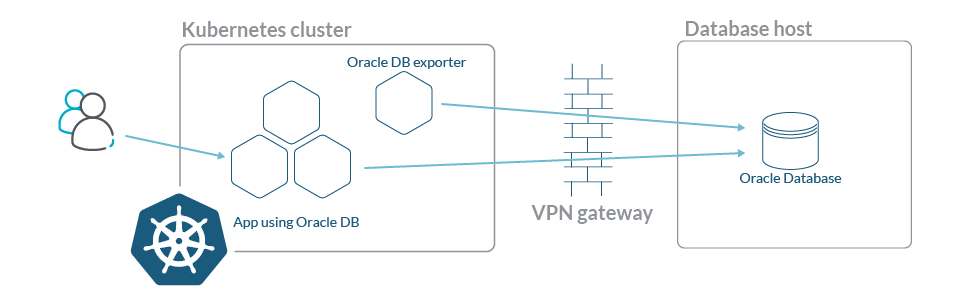
Let's meet Gabriela, a Site Reliability Engineer (SRE) in an energy supply company using Oracle as a database engine running in a dedicated host. The rest of the services and applications of the company have been migrated to cloud native microservices and orchestrated with Kubernetes, communicating with the Oracle Database through a VPN.
Users have been reporting errors caused by long running queries in her database. Developers can't reproduce the problem. Is it caused by resource starvation? Poorly optimized queries returning too many results? There's no way to solve the issue without more information.
To make things worse, Gabriela has noticed that the database is growing more than usual, matching the increased activity of her company. It's good news for her company, but now she has to plan capacity accordingly.
Gabriela needs automatic alerts, so the SRE team can troubleshoot those errors when they rise and accomplish their Service Level Objectives (SLOs). Also, a better monitoring for the Oracle database will help assess the size of the tables and tablespaces, and reveal where the growth is happening.
The OracleDB Prometheus exporter
The OracleDB exporter is an application that connects to the database and generates metrics in Prometheus format.
Once the metrics are available, you can use the Prometheus server of the SRE team to create dashboards for data visualization and exploration. Also, you can program alarms that can report your team on issues with the database in real time. This allows them to troubleshoot and solve the incidents on time to meet the SLOs of your department.
Let's see how Gabriela implemented this exporter, and what dashboards and alarms she created.
Setting up the Prometheus exporter
In this section, we will show how to install and set up the OracleDB exporter to collect metrics with Prometheus to monitor an Oracle Database. We will assume that the deployment is made in a Kubernetes cluster, even if the exporter can also be deployed as a docker image or a binary directly in a host.
To run the OracleDB exporter in Kubernetes, we will use a Deployment where we will add the standard Prometheus annotations. This way, the Prometheus server can autodiscover the OracleDB exporter endpoint and collect the metrics without further configuration.
The exporter needs the connection string of the Oracle Database to be able to access and generate metrics. This parameter is passed as an environment variable to the exporter. As the connection string contains the user and password to access the database, we will use a Kubernetes Secret to store it.
To create the secret of the connection string to the Oracle Database, you can use the following command:
In the deployment, we will configure the environment variable like this:
Be sure to check that your connection string is in the correct format:
You can check if your connection string is correct by using a docker image of SQL*Plus:
👉 Tip: In Oracle v12, the domain after the database_name is required. In Oracle v19, only the database_name is needed.
If you are getting an unknown service error, you can check the service that you have to use in the connection string (the last part of the connection string after the database_url). To do so, enter the container of the database and use the cli tool lsnrctl.
In Oracle v12, this command is located in the directory /u01/app/oracle/product/12.2.0/dbhome_1/ and in Oracle v19, in /opt/oracle/product/19c/dbhome_1/bin.
Last but not least, we will add some custom metrics to the OracleDB exporter. Custom metrics are additional ones that we want to add to the standard metrics already provided by the exporter.
We will add them to get metrics of slow queries, bug queries, and big tables.
In order to use the custom metrics:
- In the Deployment, we will add another environment variable with a route to a file with the new metrics.
- We will mount this new file as a volume from a ConfigMap.
Here is the complete configuration of the Deployment:
And here is the ConfigMap with the custom metrics (you can find the plain file with the custom metrics in the exporter repository):
Once we have created the Secret and the ConfigMap, we can apply the Deployment and check if it is getting metrics from the Oracle database in its port 9161.
If everything went right, Prometheus will autodiscover the annotated pod of the exporter and start scraping the metrics in minutes. You can check it on the 'targets' section of the Prometheus web interface to look for any metric starting by oracledb_.
What to monitor
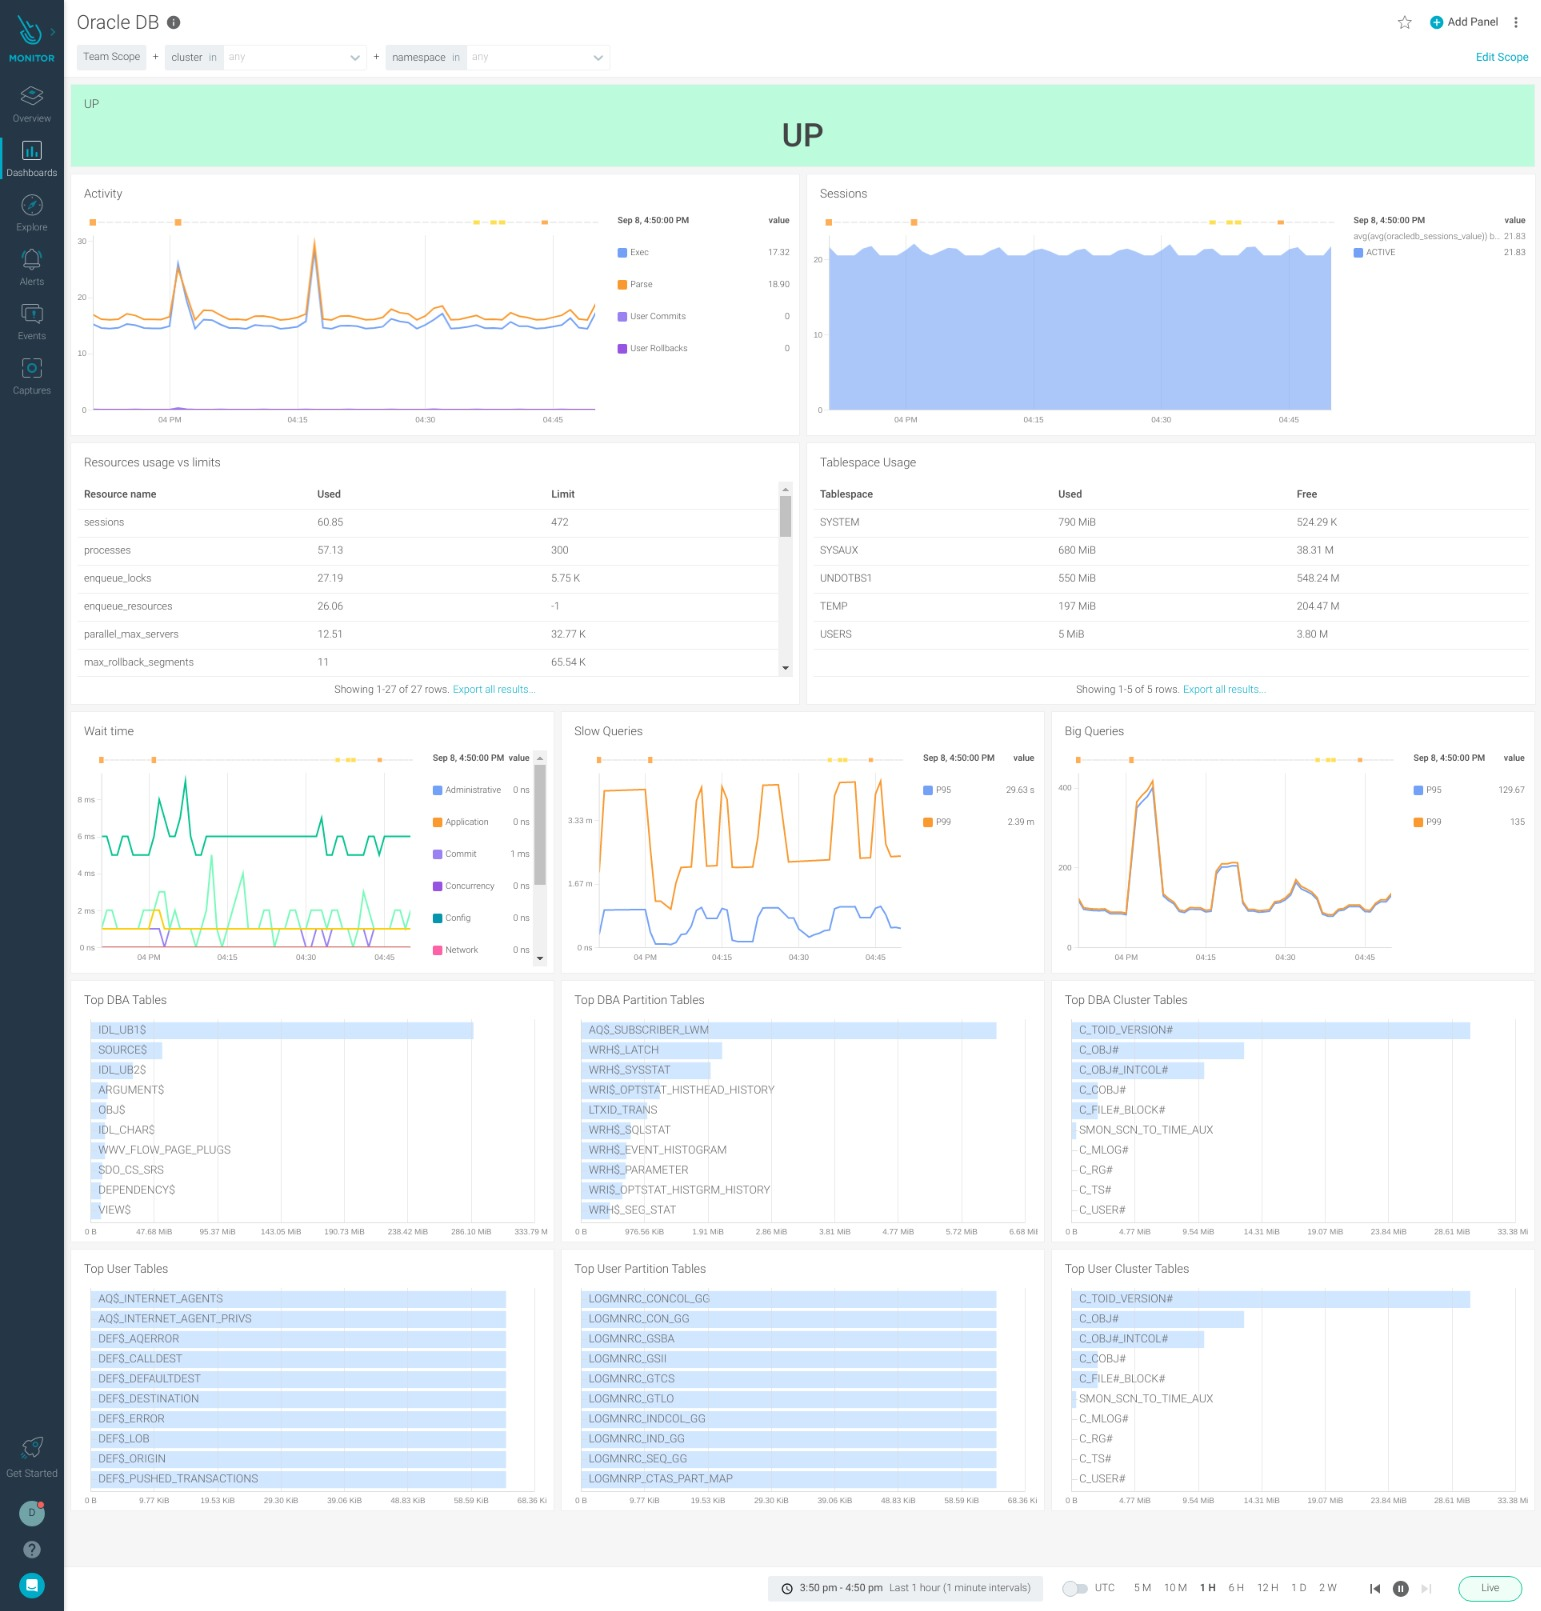
Now that Gabriela has her Prometheus collecting metrics, she can start monitoring the Oracle database.
Let's have a look at some of the metrics that she would like to monitor to address the problems that we discussed in the introduction. We will start with the performance metrics.
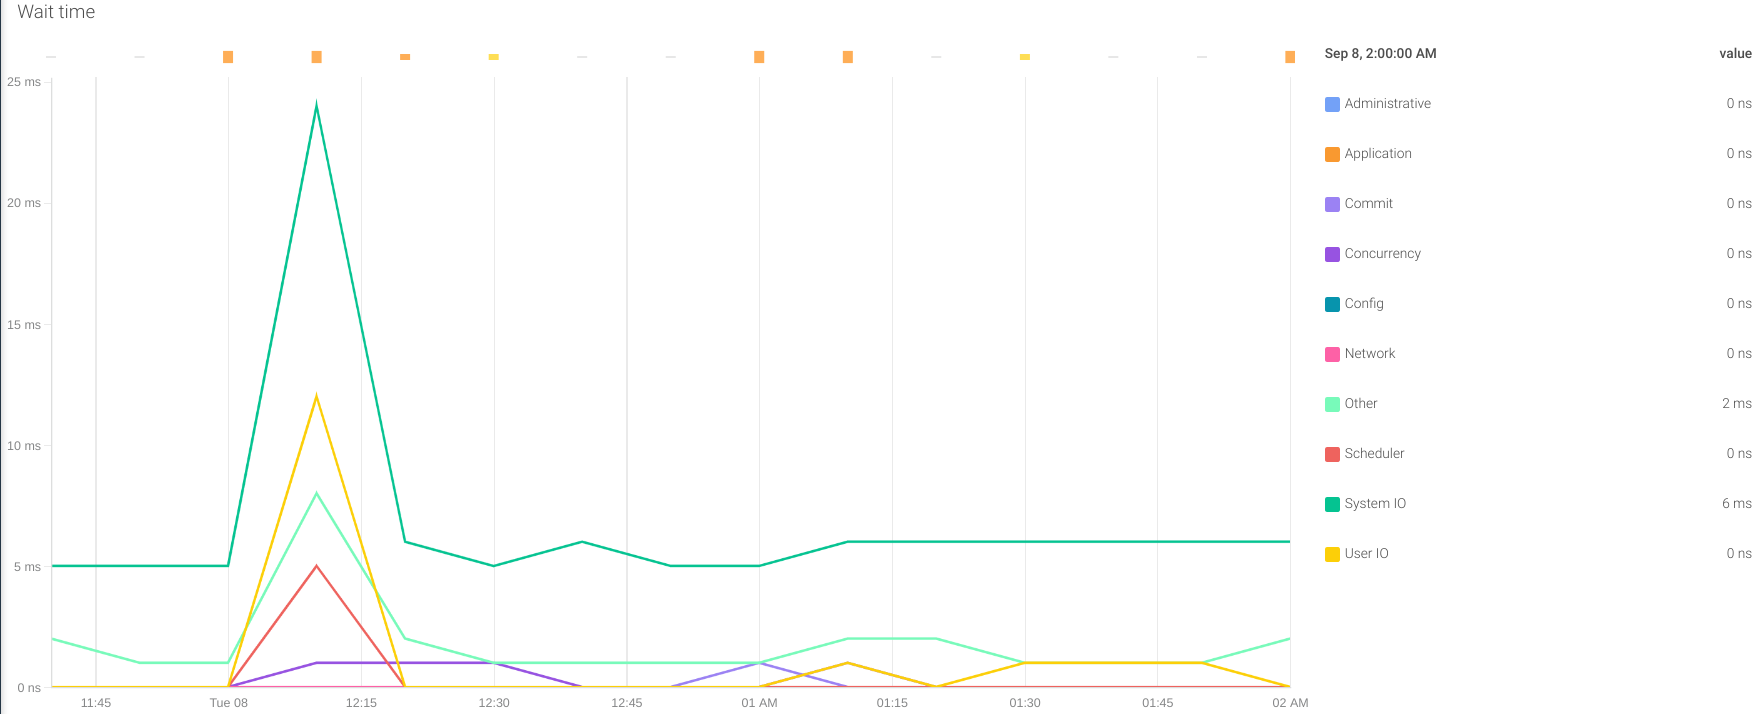
Wait time: The exporter offers a series of metrics of the wait time in different activities of the Oracle database. They all start with the prefix oracledb_wait_time_ and they help to assess where the database is spending more time. It can be in I/O, network, commits, concurrency, etc. This way, we can identify possible bottlenecks in our system that may have an impact on the overall performance of the Oracle database.
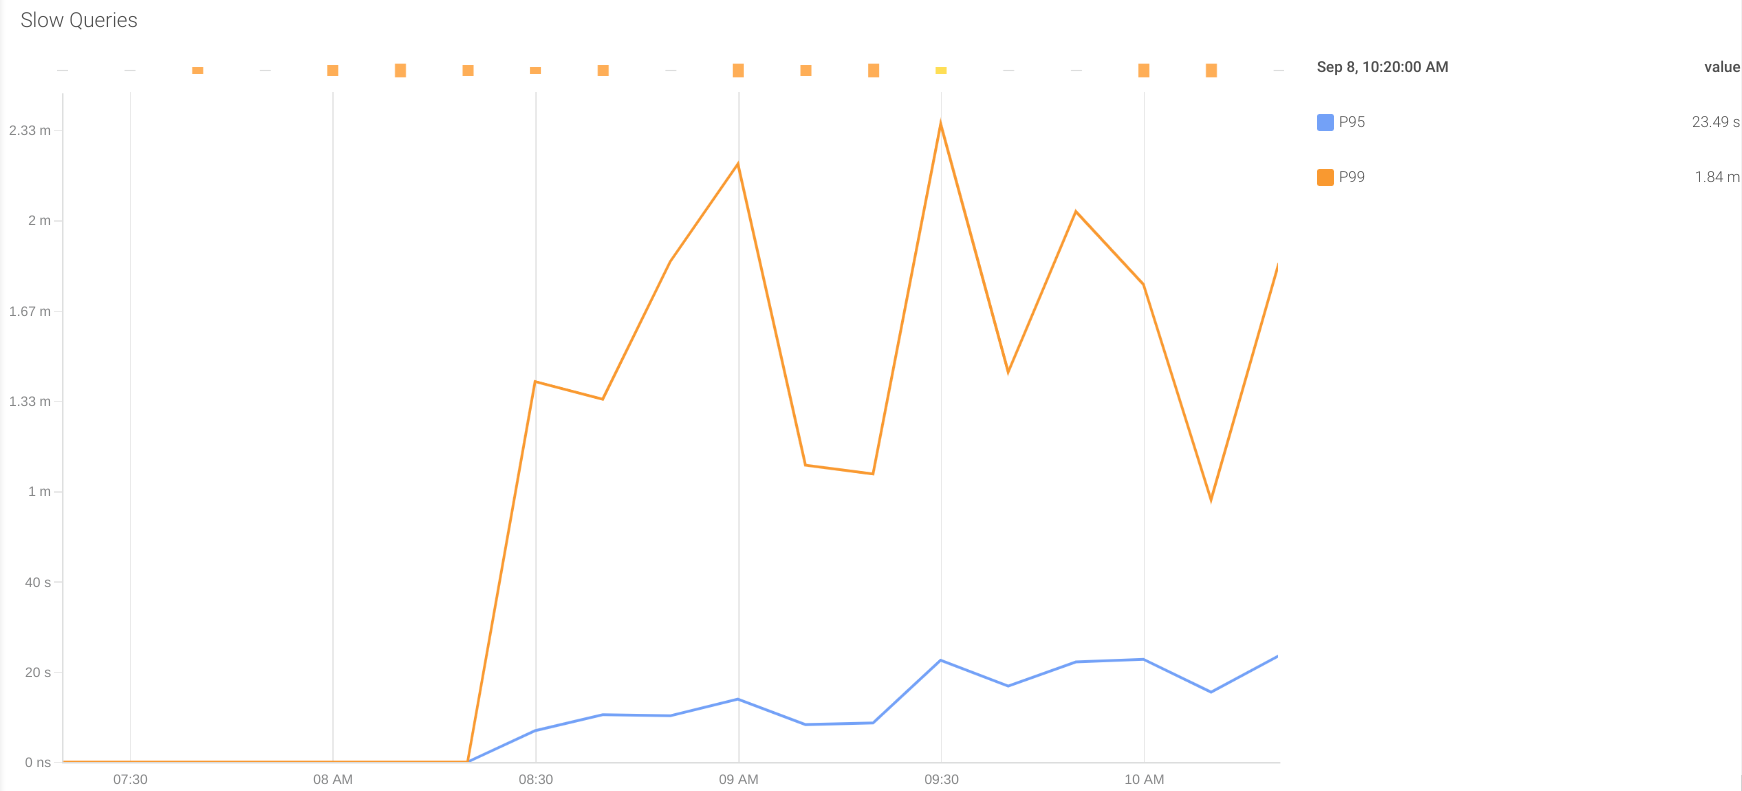
Slow Queries: Some queries may take longer than others to return results. If this time is higher than the timeout configured in the application to receive a response, it will consider it a timeout error from the database and retry the query. This kind of behavior can overload the system with extra work and also affect the overall performance.
In the configuration shown above, there are two custom metrics to give information of the percentile 95 and 99 of the response time of the queries executed in the last 5 minutes. These metrics are:
oracledb_slow_queries_p95_time_usecsoracledb_slow_queries_p99_time_usecs
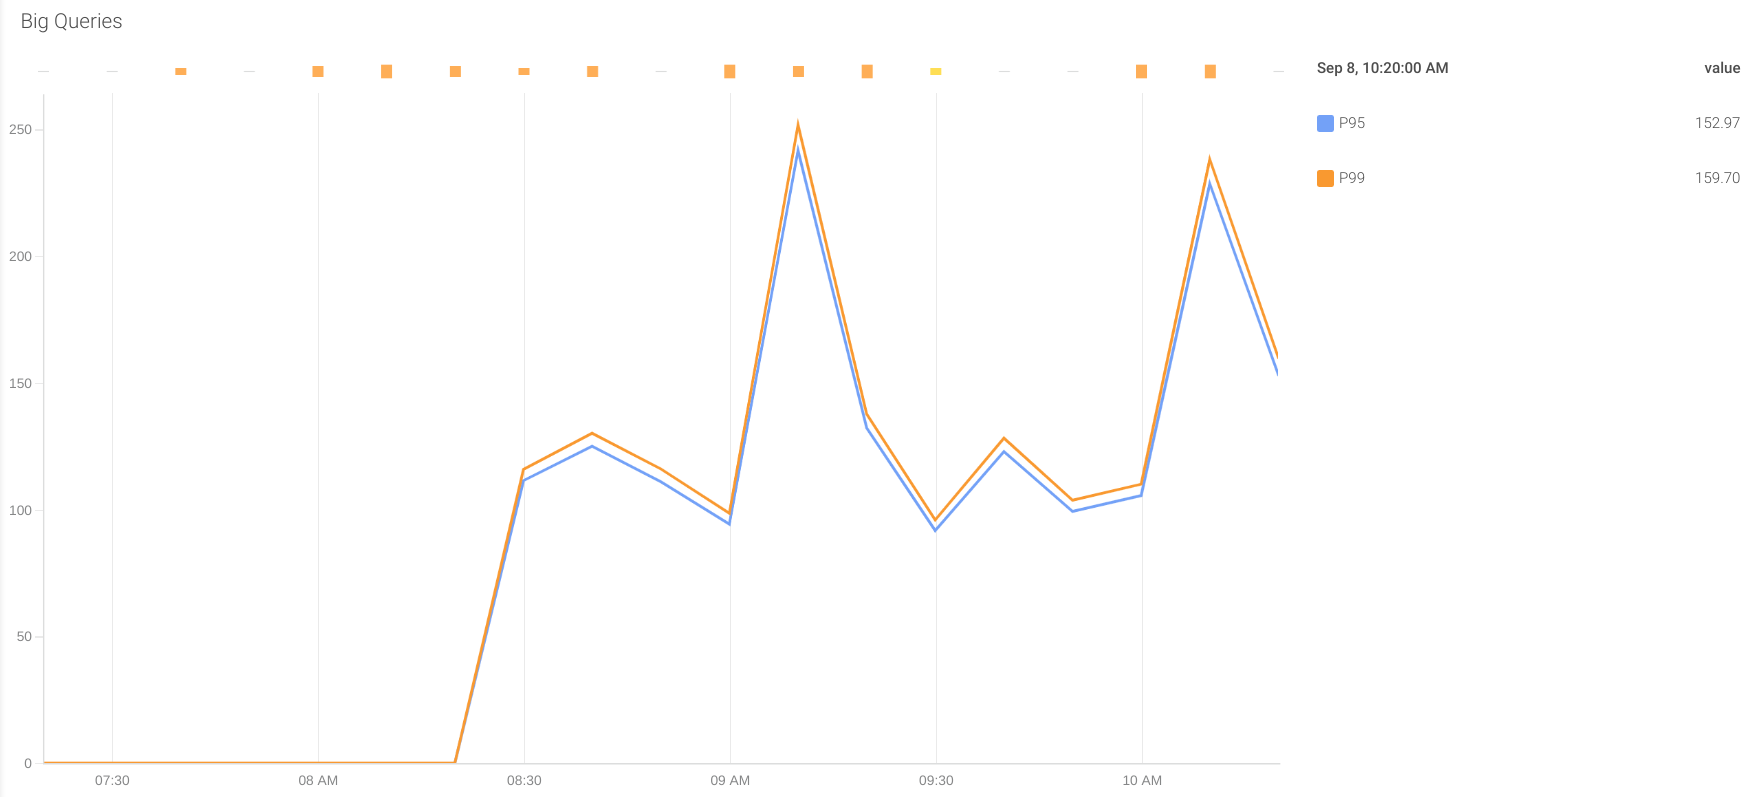
Big queries: Sometimes, queries can return a high amount of rows. This can be something foreseen in development as something expected, or can be an unplanned behavior causing memory and networking overload, as well as high intensive (and slow) I/O operations.
To detect these issues, our ConfigMap offers two metrics to monitor the percentile 95 and 99 of the queries by returned rows in the last 5 minutes.
oracledb_big_queries_p95_rowsoracledb_big_queries_p99_rows
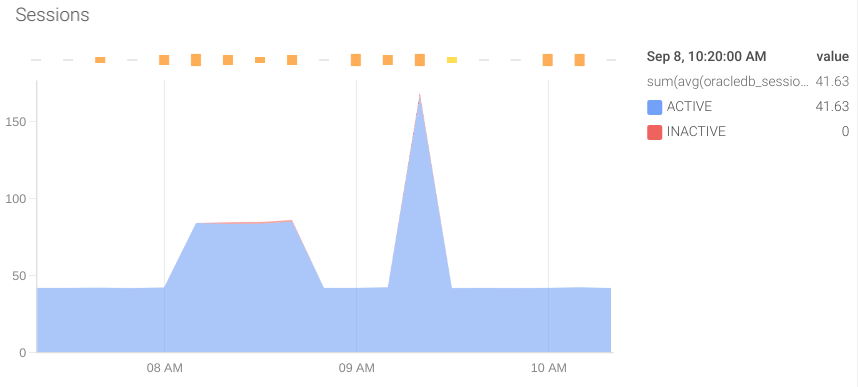
Sessions active: It is important to monitor the sessions active in Oracle databases. If there are more than the limit configured, the database will refuse new connections, causing errors in the application. The metric that gives this information is oracledb_sessions_value and the label status can give more information.
Activity: It is also important to monitor the operations performed by the database. To do this, we can rely on the following metrics:
oracledb_activity_execute_countoracledb_activity_parse_count_totaloracledb_activity_user_commitsoracledb_activity_user_rollbacks
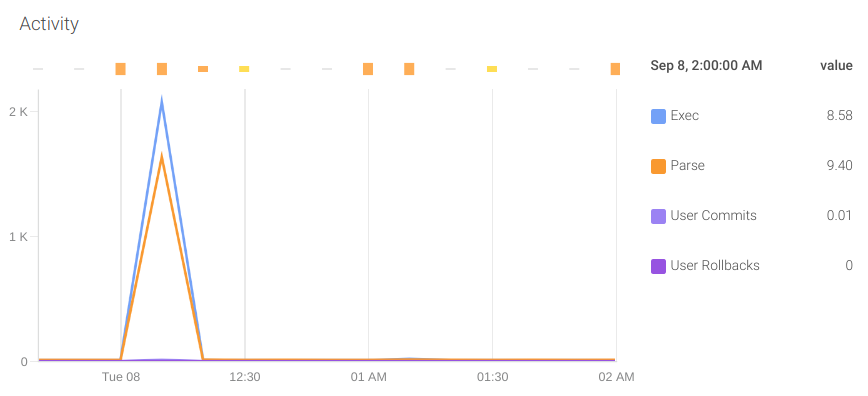
These metrics will give you insight into what optimizations will have a greater impact in your system. For example, optimizing the queries and tuning the parser cache so it does not need to perform hard parses and can make use of soft parses.
Now, we will see some aspects of resource utilization to be aware of while monitoring Oracle databases.
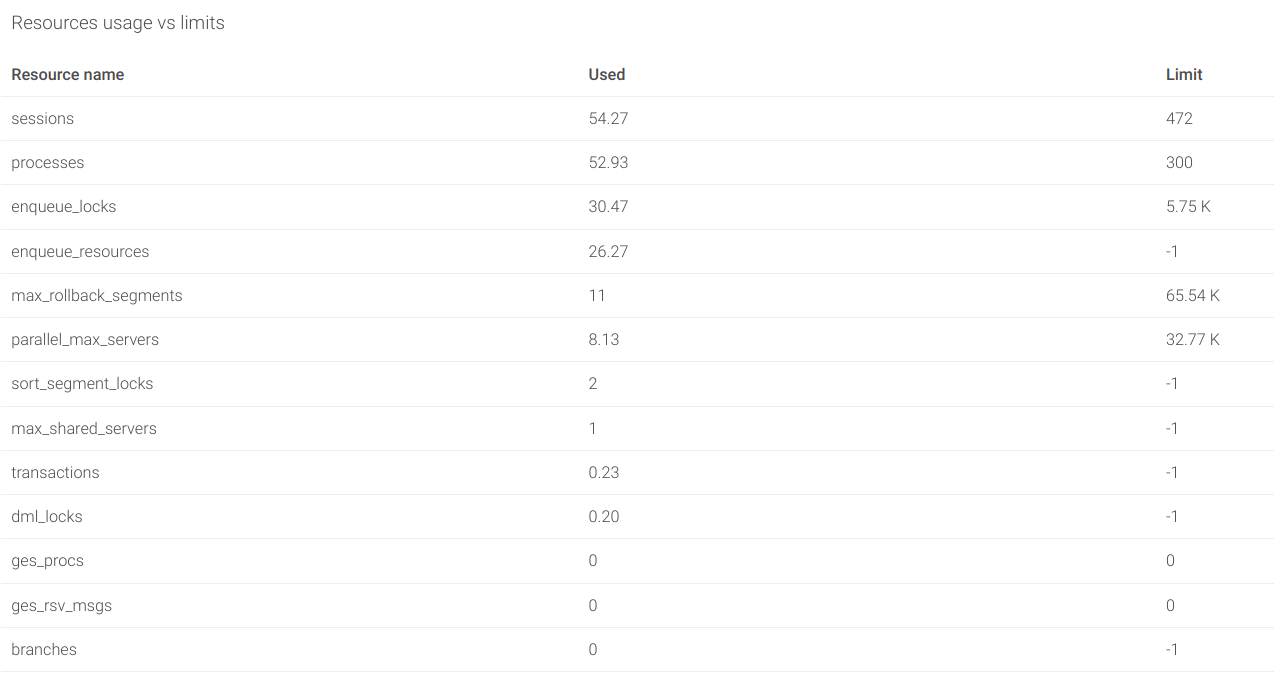
Resource usage: One of the concerns that any database administrator has is the usage of the different kinds of resources and how close they are from starvation. The OracleDB exporter offers two metrics that give information on the current utilization and limit of each kind of resource:
oracledb_resource_current_utilizationoracledb_resource_limit_value
These two metrics have a label resource_name to identify the kind of resource they refer to. You can find the list of resources in the Oracle Official documentation. Some interesting resources to monitor are:
- sessions
- processes
- transactions
- enqueue_resources
- dml_locks
- enqueue_locks
- sort_segment_locks
- temporary_table_locks
Tablespaces: Oracle organizes the space in tablespaces. Each tablespace contains datafiles where the objects are stored. There are two metrics that allow us to monitor the current used and free bytes of each tablespace:
oracledb_tablespace_bytesoracledb_tablespace_free
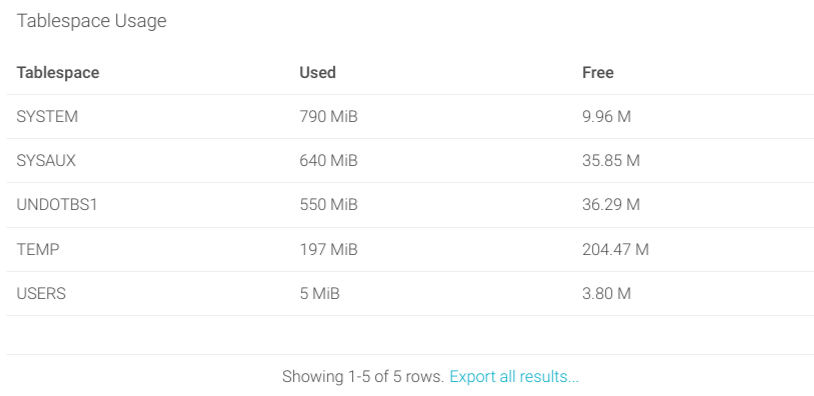
By monitoring the available space in tablespaces, you can plan and implement increases in disk and scale up the resources of your database before they are full.
Top tables: In some cases, you can be interested in assessing the usage that each table is making of the available size in the database. Some of the custom metrics that we configured in the exporter provide information about the size of the top 100 tables, table partitions, and clusters for both administration and user spaces.
size_user_segments_top100_tablesize_user_segments_top100_table_partitionsize_user_segments_top100_clustersize_dba_segments_top100_tablesize_dba_segments_top100_table_partitionsize_dba_segments_top100_cluster
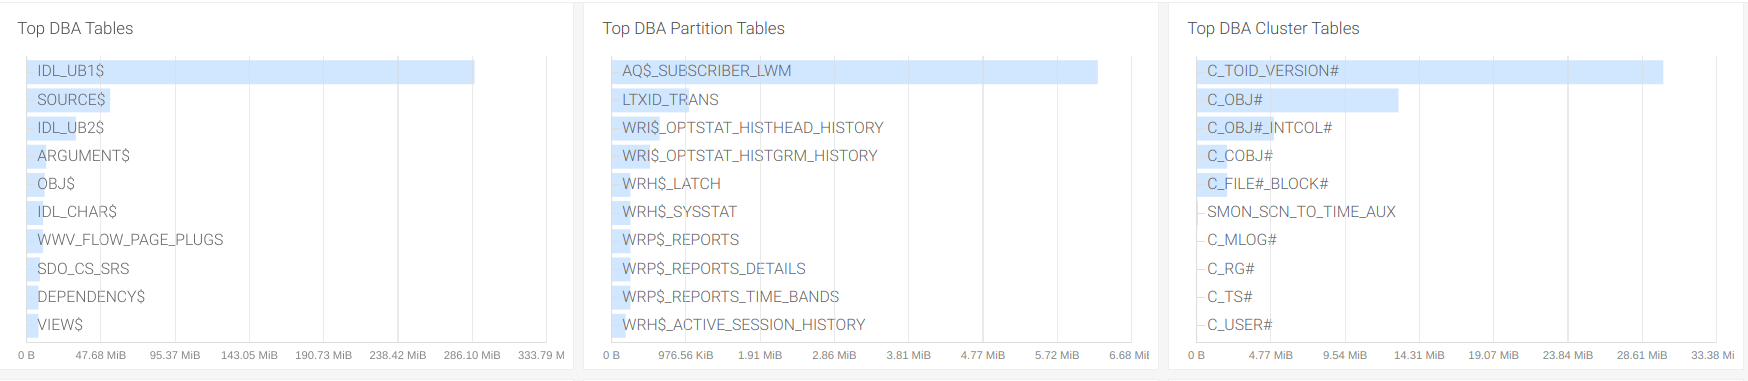
This is interesting in case you need to release space from the database and want to study the possible cleaning of data in the biggest tables, like dropping unused columns or removing old records, especially in the user tables.
What to alert
We have seen which metrics are worth monitoring and why. But there are some issues that can happen in the database that need immediate action from the SRE team and cannot wait for someone to check on the dashboard to find the problem.
Coming back to Gabriela's team, they have some SLA's to meet, and their department has a SLO budget available that they need to maintain on availability and performance. We will now see some alerts that will help them to meet their objectives:
Database down: This is probably one of the most important ones. The metric oracledb_up equals 1 is the exporter can connect to the database. The connection can be unavailable for many possible causes, but if the exporter cannot access the database, the database will most likely not be available for other applications either. This promQL query will trigger when the Oracle database is not available:
Resource utilization close to the limit: We can use the oracledb_resource_current_utilization and oracledb_resource_limit_value metrics to create an alert when the utilization of a resource is higher than a certain limit, like 85%.
This alert can be fine tuned later for each of the resources, depending on how critical or volatile the resource is. Also, we will add another check in the PromQL query to trigger only if the resource has a limit defined (it is defined if it is higher than 0).
Predicted sessions over limit: For some critical resources, we can create forecasting alerts to react before we have an issue. These alerts will predict the value of the metric using linear regression.
In the example query below, we will check if the number of sessions from the last 2 days are trending towards a starvation in the next 5 days. We recommend using a sample of at least 25-30% of the time to predict to make the regression. We will also include a clause to alert in case the current usage is over 75% of the sessions available (if a limit is configured).
The query looks like this:
Low free space in tablespace: As we have seen before, we can set an alert to warn the SRE team when a tablespace is close to reaching the limit of space available. We can do this in absolute values or in a percentage:
Percentile 99 of response time longer than 10 seconds: The percentile 99 of the response time on queries can determine the overall performance of the system. Keep in mind that an increase in overall response time will have a negative domino effect on concurrent operations and the later processing of data. Setting the response time close to the time out defined in the application will help the SRE team address these kinds of situations.
This PromQL alert will trigger when the percentile 99 of the response time in the last 5 minutes is longer than 10 seconds:
In this example, we used a 10 seconds threshold, but this value can be adjusted to fit the requirements of the application querying the database.
Percentile 99 of returned rows higher than 1M: As stated before, an uncontrolled number of returned rows in queries can lead to disk and network intensive processing, which can affect the response time and memory usage of the database.
This PromQL will trigger when the percentile 99 of the returned rows in the last 5 minutes is higher than 1 million:
This alert may need further tuning, adjusting the five minutes window or the number of rows. To change the window of time used to calculate the percentile in this metric, go to the custom metric that we defined in the ConfigMap and find the line:
There, you can edit the minutes changing 5/(24*60) for /(24*60).
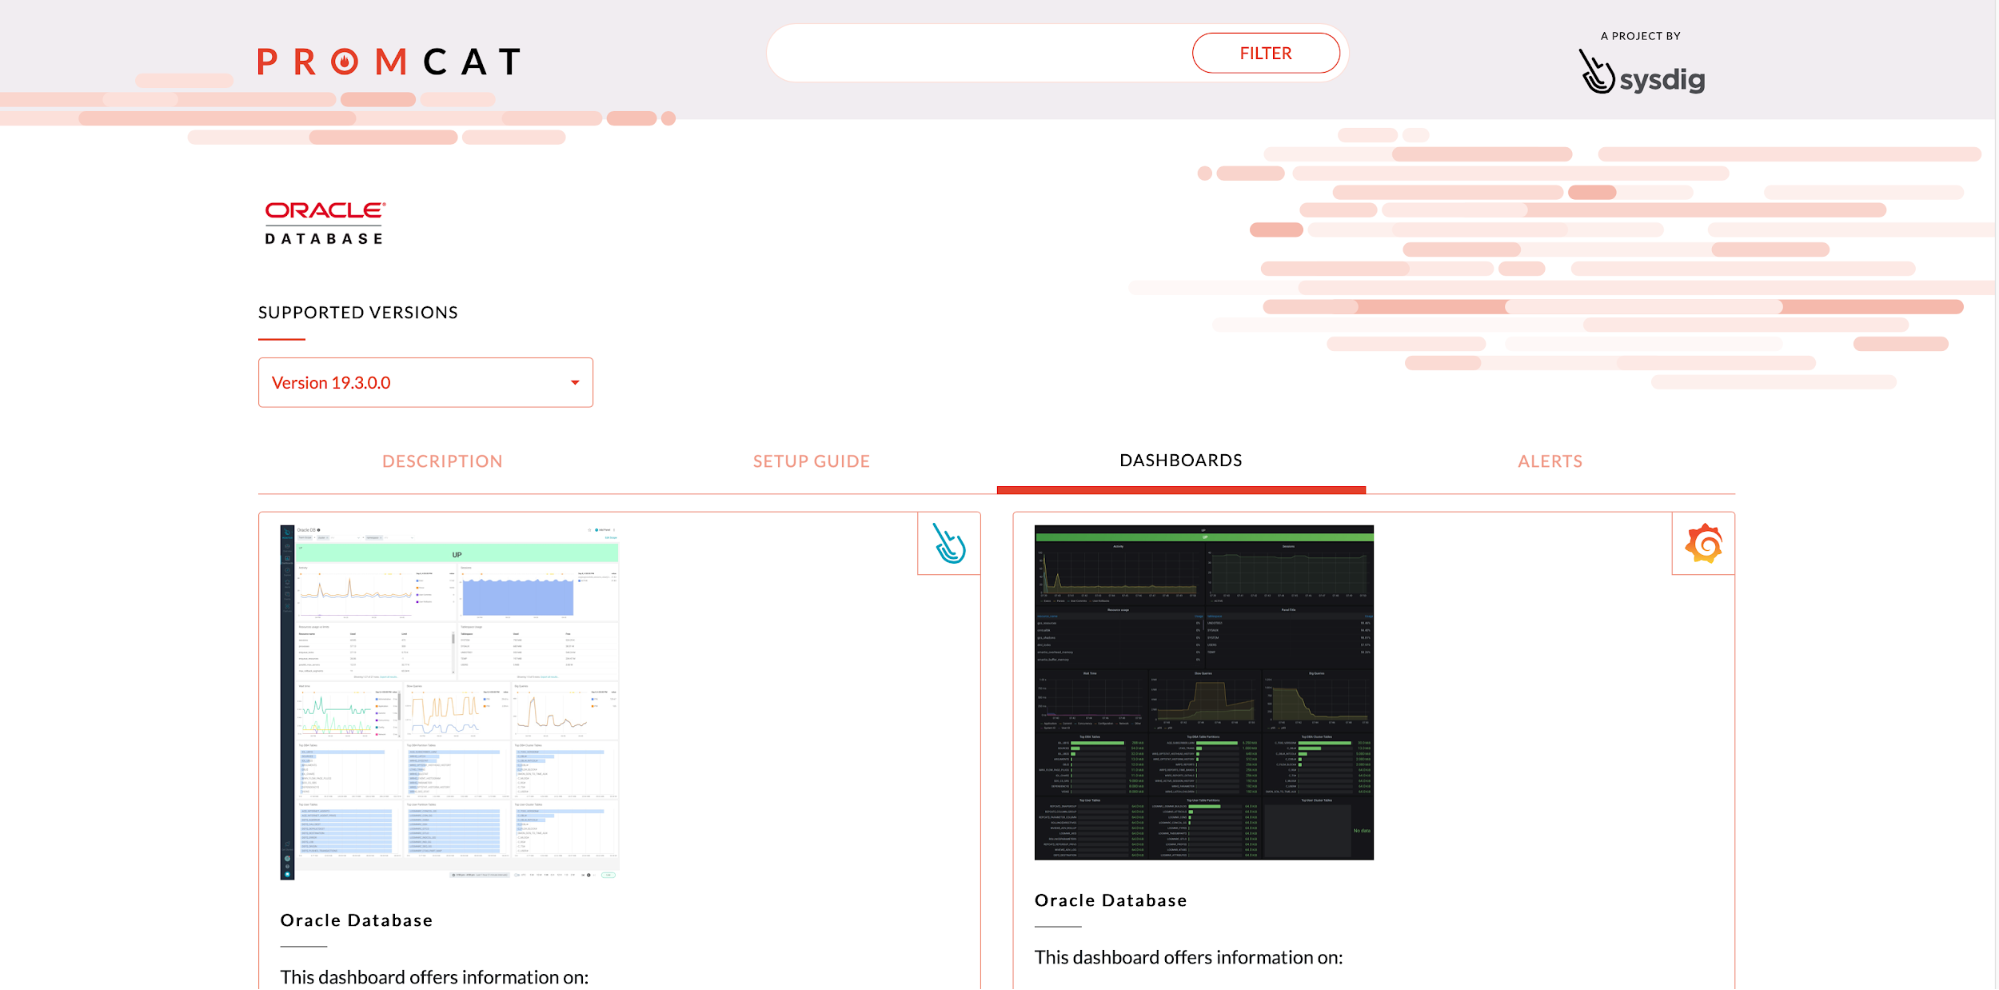
More resources in PromCat.io
In PromCat.io, you can find a dashboard and the alerts showcased in this blogpost, ready to use in your Grafana. These integrations are curated, tested, and maintained by Sysdig.
Monitoring Oracle Database with Sysdig
Sysdig has native compatibility with Prometheus, offering an enterprise-grade Prometheus service. That means that the agent can natively collect metrics directly from the Prometheus exporters and send the data to Sysdig Monitor, where you can use all the power of PromQL to set up visualizations, dashboards, and alerts.
Also, Sysdig offers a series of integrations through PromCat.io, where you can find a dashboard and the alerts showcased in this blogpost ready to use in your Sysdig Monitor account.
Conclusion
In this article, we have explained how to monitor an Oracle Database with Prometheus. We have shown how to install and configure the OracleDB Prometheus exporter, connecting it to the Oracle Database and adding some custom metrics to get insights on performance and resource utilization. Finally, we dive into the metrics and the alerts that the SRE team needs to set up in order to monitor an Oracle Database.
Now it's your turn! You can use the example above to set up the OracleDB Prometheus exporter and try it out by yourself. You can explore the metrics featured in this blogpost and program your alerts based on your SLOs.
Find more information about this exporter and other Prometheus integrations in the open source repository of PromCat.io, maintained and curated by the Sysdig team. Make sure to visit it and find all of the resources that you need for your Prometheus monitoring!
Take a look at the 1 month free trial of Sysdig Essentials, either directly in Sysdig or in the AWS marketplace. You will have full access to the features of Sysdig Monitor to explore your metrics in an enterprise-grade SaaS platform with full Prometheus compatibility. Try Sysdig today!