Introducing intelligent vulnerability remediation, powered by Sysdig Sage™
LEARN MORE
Customers rate Sysdig top CNAPP in Customers' Choice category within Gartner® VOC report
LEARN MORE
Sysdig Home
×
Platform
Back
Platform
Platform
Sysdig Secure
CNAPP powered by runtime insights
Environments
Integrations
Sysdig Monitor
Powered By
Falco
The core engine providing runtime insights to the Sysdig platform
hidden header
Sysdig Sage™ GenAI
AI cloud security analyst with multi-step reasoning
555 Benchmark
Detect and respond to cloud attacks faster than attackers can complete them
Solutions
Back
Solutions
Real-time Cloud Security
Cloud-Native Application Protection Platform
Unified cloud security to protect your cloud, containers, and workloads
AI Workload Security
Detect, prioritize, and remediate active AI risk
Cloud Detection & Response
Detect, investigate, and respond to threats at cloud speed
From Prevention to Detection & Response
Cloud Workload Protection
Vulnerability Management
Cloud Security Posture Management
Cloud Identity & Entitlement Management
hidden
Container & Kubernetes Security
Server Threat Detection & Response
Infrastructure as Code Security
Cloud Security Requires Runtime Insights
Real-time visibility for detection and response and rich context to prioritize what matters most
Company
Back
Company
Why Sysdig
Our Customers
Hear how our customers secure and accelerate innovation in the cloud
Runtime Insights
Learn how runtime insights powers real-time cloud security
Threat Research Team
Get the latest threat research and security findings
About Sysdig
Who We Are
Leadership Team
Newsroom
Compare Sysdig
Aqua
Crowdstrike
Lacework
Orca
Prisma Cloud
SentinelOne
Wiz
Customer Spotlight
BigCommerce achieves real-time cloud security
Open Source
Back
Open Source
OSS
Sysdig & OSS
The future of security is open
Projects
Falco
Detect threats in real time
Falco Feeds by Sysdig
Enterprise detection rules for Falco users
Stratoshark
Analyze, troubleshoot, and secure cloud environments
hidden
Open Policy Agent
Unify policy enforcement for cloud-native environments
Prometheus
Monitor cloud-native applications and Kubernetes
Why Open Source Matters
Falco’s journey to CNCF graduation
Resources
Back
Resources
Learn
Blog
Get the latest news and insights from cloud security experts
Learn Cloud Native
Learn cloud and container security fundamentals
Content Library
Explore cloud and container security content
Engage
Webinars & Workshops
Events
Contact Us
Get Support
Contact Support
Sysdig Status
Docs
Sysdig Threat Research
Security research focused on the latest cloud-native security threats, vulnerabilities, and attack patterns
Search
Back
Search for:
Search
Best Match
View all search results
Languages
Back
Language
Language Header – Hidden
Deutsch
English
Español
Français
Italiano
日本語
Log In
Back
Log In
Monitor
US-East
US-West
EU-Central
AWS-AP-Sydney
AWS-AP-South
GCP-US-West
Secure
US-East
US-West
EU-Central
AWS-AP-Sydney
AWS-AP-South
GCP-US-West
Log In – 3rd Column Header – HIdden
Support
Get Demo
555 Benchmark
Detect and respond to cloud attacks faster than attackers can complete them
Blog
David de Torres Huerta
David de Torres Huerta
Monitoring
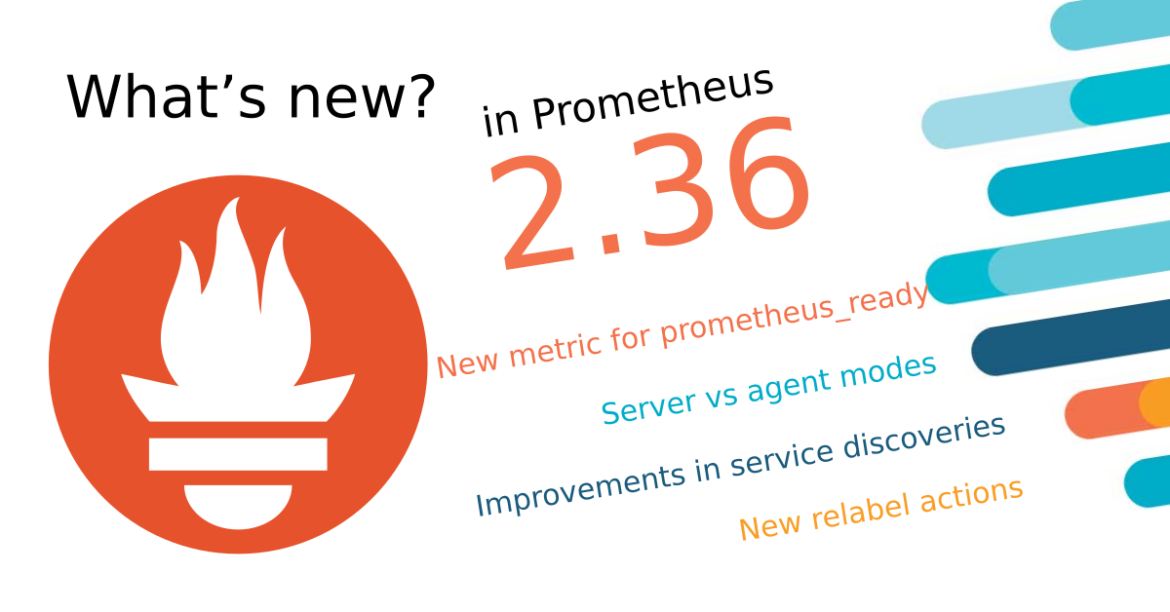
Prometheus 2.36 – What’s new?
Open Source, Monitoring
Highlights on Prometheus Day 2022 EU (Valencia)
Blogs by David de Torres Huerta
Filter By:
Monitoring
Prometheus 2.36 – What’s new?
David de Torres Huerta | June 8th, 2022
Open Source, Monitoring
Highlights on Prometheus Day 2022 EU (Valencia)
David de Torres Huerta | May 31st, 2022
Monitoring
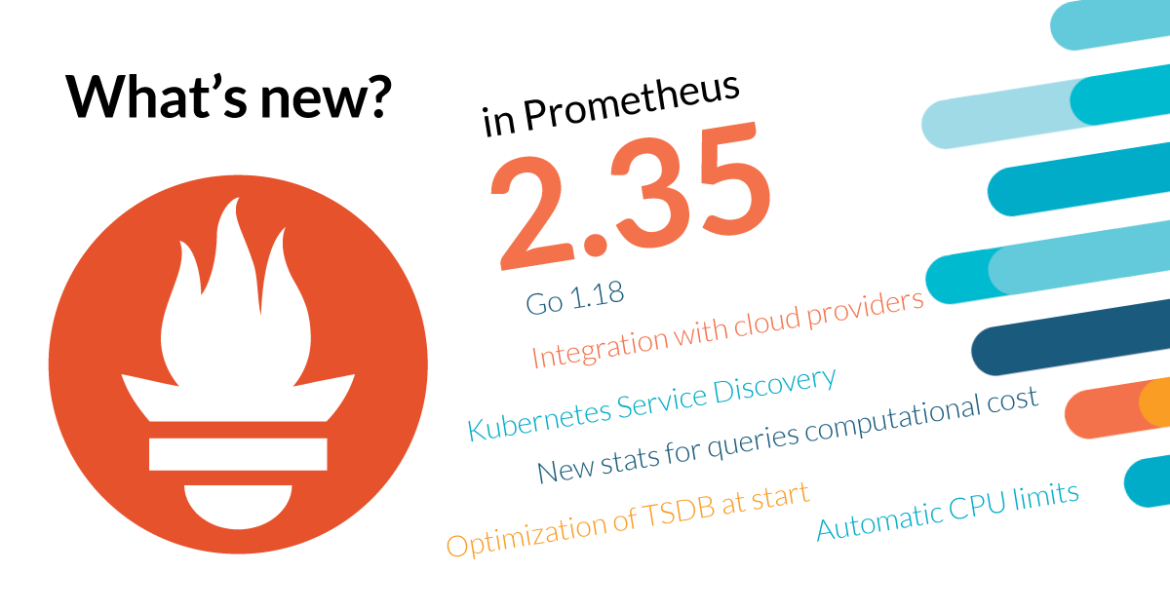
Prometheus 2.35 – What’s new?
David de Torres Huerta | May 5th, 2022
Monitoring
Top key metrics for monitoring MySQL
David de Torres Huerta | November 4th, 2021
Monitoring
Trigger a Kubernetes HPA with Prometheus metrics
David de Torres Huerta | October 7th, 2021
Monitoring
How to monitor Redis with Prometheus
David de Torres Huerta | September 23rd, 2021
Monitoring, Sysdig Features
No pain… More gain! Sysdig Monitor radically simplifies monitoring integrations based on open source
David de Torres Huerta | August 11th, 2021
Monitoring, Open Source
How to rightsize the Kubernetes resource limits
David de Torres Huerta | June 10th, 2021
Monitoring
How to monitor Amazon SQS with Prometheus
David de Torres Huerta | February 4th, 2021
How to monitor an Oracle database with Prometheus
David de Torres Huerta | December 16th, 2020
Monitoring AWS Lambda with Prometheus and Sysdig
David de Torres Huerta | July 14th, 2020
Monitoring AWS Fargate with Prometheus and Sysdig
David de Torres Huerta | June 9th, 2020
Back to Blog